SIGN LANGUAGE STATIC GESTURE RECOGNITION USING LEAP MOTION A thesis proposal presented to the faculty of the Graduate School of
Western Carolina University in partial fulfillment of the requirements for the degree of Master of Science in Technology
By
Stephen H. McNeil, Jr. Director: Dr. Robert Adams
Associate Professor
Professor of Engineering & Technology Committee Members:
Dr. Paul Yanik, School of Engineering & Technology
Dr. Mark Budden, Department of Mathematics and Computer Science November 2017
ii
TABLE OF CONTENTS
LIST OF TABLES ... iii
LIST OF FIGURES ... iv
LIST OF ABBREVIATIONS ... v
ABSTRACT ... vi
Chapter 1: Introduction ... 1
1.1 Key Terms ... 2
Chapter 2: Literature Review ... 3
2.1 Sign Language in the United States. ... 3
2.2 Technologies used for gesture recognition ... 5
2.2.1 Sensor Gloves ... 5
2.2.2 Histogram Matching ... 6
2.2.3 Depth Sensing Cameras ... 6
2.3 Leap Motion Controller ... 7
Chapter 3: Methodology ... 10
3.1 Selection of Static Gestures ... 10
3.2 Development of Database ... 11
3.3 Analysis Procedure for Static Hand Gesture Recognition ... 20
Chapter 4: Results and Analysis ... 24
4.1 General Analysis ... 24
4.2 Digital Relationships ... 24
4.2.1 Tightly Clustered Gestures ... 25
4.2.2 Clustered With “Half” Extensions ... 27
4.2.3 One Digital Extension ... 28
4.2.4 Two Adjoined Digital Extensions ... 29
4.2.5 Two Non-Adjoined Digital Extensions ... 31
4.2.6 Three Digital Extensions ... 32
4.2.7 Four to Five Digital Extensions ... 33
Chapter 5: Conclusions and Future Consideration ... 35
References ... 38
iii
LIST OF TABLES
Table 3.1: Variables of Reference for Hand Skeleton………...13
Table 3.2: Comparison of Database Collector to Tested Gestures………...….18
Table 3.3: Computed Metrics for a Sample Test Subject Presenting a “W” Hand Gesture…...22
Table 3.4: Computed Metrics for a Sample Test Subject Presenting a “K” Hand Gesture……...22
Table 3.5: Computed Metrics for a Sample Test Subject Presenting a “M” Hand Gesture…..…23
Table 4.1: Recognition Accuracy of Scaled Algorithms by Test Subject……….24
Table 4.2: Accuracy Comparison for Tightly Clustered Gestures………....25
Table 4.3: Accuracy of Half Extended Gestures with Corresponding Fingers……….27
Table 4.4: Accuracy of Gestures with One Extended Finger………....28
Table 4.5: Accuracy of Gestures with Two Adjoined Extended Fingers………..30
Table 4.6: Accuracy of Gestures with Two Non-Adjoined Extended Fingers………..31
Table 4.7: Accuracy of Gestures with Three Extended Fingers………32
Table 4.8: Accuracy of Gestures with Four or Five Extended Fingers……….………33
Table A1: Recognized Gestures from Test Subject #1………..40
Table A2: Recognized Gestures from Test Subject #2………..41
Table A3: Recognized Gestures from Test Subject #3………..42
Table A4: Recognized Gestures from Test Subject #4………..43
Table A5: Recognized Gestures from Test Subject #5………..44
Table A6: Recognized Gestures from Test Subject #6………..45
iv
LIST OF FIGURES
Figure 2.1: Context in Sign Language [3] ... 4
Figure 2.2: Hand Hierarchy [9] ... 8
Figure 2.3: Leap Motion Controller Axes [9] ... 9
Figure 3.1: Sign Language Letter and Number Gestures ... 10
Figure 3.2: Recorded Vertices (shown in yellow) for Data Collection ... 11
Figure 3.3: Tip of Thumb and Thumb Proximal Knuckle Distances ... 14
Figure 3.4: Leap Motion’s Visualization of the Letter A ... 15
Figure 3.5: Matrix for “A” of Rounded Euclidean Distances ... 15
Figure 3.6: Leap Motion’s Visualization of the Number 5 ... 16
Figure 3.7: Matrix for “5” of Rounded Euclidean Distances... 17
Figure 3.8: 2nd Scaling Factor (SF2) Distance and 3rd Scaling Factor (SF3) Distance ... 20
Figure 4.1: Tightly Clustered Gestures ... 25
Figure 4.2: Gestures with Clustered Partial Finger Extensions ... 27
Figure 4.3: Gestures with One Finger Extension ... 28
Figure 4.4: Gestures with Two Extended, Touching Fingers ... 29
Figure 4.5: Gestures with Two Extended Non-Adjoined Fingers ... 31
Figure 4.6: Gestures with Three Extended Fingers ... 32
v
LIST OF ABBREVIATIONS
ASL: American Sign Language DB: Database
HI: Hearing Impaired HSV: Hue Saturation Value IR: Infrared
MoS: Metric of Similarity NH: Normal Hearing NIR: Near-Infrared
NUI: Natural User Interface PSE: Pidgin Signed English RGB: Red Green Blue
SDK: Software Development Kit SEE: Signed Exact English SF1: Scaling Factor 1 SF2: Scaling Factor 2 SF3: Scaling Factor 3 TSG: Test Subject Gesture
vi ABSTRACT
SIGN LANGUAGE STATIC GESTURE RECOGNITION USING LEAP MOTION Stephen H. McNeil, Jr., M.S.T
Western Carolina University (November 2017) Director: Dr. Robert Adams
Currently scientists and engineers are using near-infrared (NIR) technology to detect motions of human body parts, and can develop programming for gesture recognition. Software is being developed by researchers for both stationary and mobile NIR cameras to operate as Sign Language Recognition devices. This thesis focus was on adapting an application of a NIR camera to be used on any device with application compatibility, essentially allowing a Hearing Impaired (HI) person to use a highly portable camera to communicate with non-speakers of Sign Language. Some examples of the devices that are able to use this technology include computers, tablets, and smart phones. I have developed a Sign Language recognition technology to establish better techniques, databases, and interactive applications for improved function of
communication in the HI culture. The algorithm performed at a 76.67% accuracy across all gestures tested for first-time participants.
CHAPTER ONE: INTRODUCTION
The ability to communicate is extremely important to human existence. The natural form of conversational communication for most humans is oral, but this is a problem for Hearing Impaired (HI) people due to auditory impairment. The HI community, or culture, consists of people that experience either partial or full deafness. The HI culture has had to rely on Normal Hearing (NH) individuals to learn Sign Language in order to communicate more rapidly. NH people who learn Sign Language do so in order to interact with, teach, or interpret for HI people. Modern technology provides new resources for the HI culture to communicate more effectively in a dominantly NH society without the assistance of another person [1].
This research effort involves the use of Near Infrared (NIR) technology to implement computer recognition of hand gestures. NIR technology can be used to provide tracking of key hand skeletal positions, including the positions of all finger joints. The process of teaching a computer to recognize gestures may be accomplished by evaluating a few levels of skeletal tracking and data analysis. The first step in developing such a training program is to assemble a database of key hand skeletal positions for a set of sign language gestures. In this study, a set of sign language gesture for 36 letters and numbers were chosen to be included in the database. The database is constructed by having an individual fluent in sign language perform a gesture multiple times, in satisfactory view of a NIR camera. Next, a computer is programmed to acquire a set of data from the NIR camera for each gesture, typically involving skeletal
recognition and motion tracking. Then recognized joint information is extracted, ordered, and combined. The data provides x, y, and z coordinates of key hand features that can be used to measure distance of critical components for each gesture. Next, these distances are averaged in order to provide a more accurate database for the tested gestures. An algorithm analyzes the
2
performed gestures and compares them to the established database. In this research effort, three statistical analysis methods were employed to make the comparison between database gestures and participant gestures. The accuracy of the three methods in recognizing hand gestures is compared. This recognition can allow an HI person to use their natural form of person-to-person communication to more effectively communicate with NH individuals.
This thesis is organized as follows. First, a brief overview of Sign Language, and challenges for the HI culture is presented. This is followed by a discussion of current technologies that are being developed, and how the Leap Motion sensor can provide more accurate recognition for a more complete database. Analysis methods are then presented. Finally, I will explain the mathematical process for the analysis of the data, as well as achieved results.
1.1 Key Terms
Euclidean Norm/ Euclidean Distance: Most common method for measuring distance of x, y, and z coordinates for points of interest.
Frobenius Norm: Also known as the matrix norm, and is used to measure distances of higher degree matrices.
MATLAB: Short for “Matrix Laboratory,” and is a technical computing program that will be used for technical computation of mathematical data.
CHAPTER TWO:LITERATURE REVIEW 2.1 Sign Language in the United States.
Just like the vocabulary of any spoken language, Sign Language has gestures to express meaning and intent. Some may assume that Sign Language is a literal translation of English to a nonverbal form, but this is not the case. For example, the English word “right” is used to express correctness or direction, meaning the opposite of “wrong” or “left” respectively. In Sign
Language the two different meanings of “right” are expressed with two different gestures in ASL[3]. On the other hand, the English words “help” and “therapy” are very close in meaning and likewise the corresponding hand gestures are very similar and are difficult to differentiate. Since gestures express a meaning, or idea, a single sign might be able to express an entire sentence or collection of words. In Figure 2.1 we see simple gestures for “I ask her,” and “she asks me.” [3]
4
Figure 2.1: Context in Sign Language [3]
The hand orientation, finger position, and direction of the gesture are all used to express the meaning and intent in conversation [3].
In the United States there are three major forms of Sign Language: American Sign Language (ASL), Pidgin Signed English (PSE), and Signed Exact English (SEE). ASL is preferred in the deaf culture since PSE and SEE require speech-reading or listening skills to be fluent. Since ASL has its own syntax and grammar it is considered a separate language and can be taught as a second language in university level education. The vocabulary for ASL is also used in PSE and SEE with some variations that make them easier for NH people to use. PSE is the most widely used form of Sign Languages in America due to its popularity with NH persons who interact with the deaf culture on a more regular basis. Words that do not carry information, such as “to,” “the,” and “am,” as well as word endings, such as “-ed,” “-s,” and “-ment,” are
5
often dropped. This allows a signer to gesture at a pace with spoken English, and does not require the understanding of the structure or idioms of ASL. Opposite of PSE, SEE expands the ASL vocabulary to include words, tenses, prefixes, and endings. This provides a complete visual representation of conversational English. SEE requires more time to sign than PSE due to these additions, but is typically preferred by NH people since it follows the same structure as spoken English [4].
2.2 Technologies Used for Gesture Recognition
Technology involving sensor gloves, image capturing, and depth sensing cameras have been used to develop methods for software to digitally recognize Sign Language gestures. The information captured by these methods can be analyzed computationally using Hidden Markov Models, Nearest Neighbor algorithms, Local Orientation Histograms, Neural Network Models, Bottom-up and Top-down Approach, Zernike moments, etc. [2,5]. The following sections discuss some of the strengths and weaknesses of the implementation of these technologies and respective analysis techniques.
2.2.1 Sensor Gloves
Sensor gloves are typically made out of cloth and have a particular number of sensors depending on the need of data analysis. The sensors are connected by wires to a computer and provide position information of key points on the hand. The gloves can provide more flexibility than a stationary camera, but have a limited range due to the wired connection to the computer. Kahn and Mehdi [5] use 7-sensor gloves for their research with five sensors for the fingers and thumb, and two for tilt and rotation of the hand. The sensors are optic fibers that can relay flexures of fingers and thumb numerically. One of the greatest weaknesses of using these gloves is the inability to recognize motion since they only capture information about the shape of the
6
hand. By applying sensor glove data and appropriate weights to an Artificial Neural Network, Khan and Mehdi were able to recognize static gestures, such as letters and numbers, to an accuracy rate of 88%.
2.2.2 Histogram Matching
Pansare et al [6] have shown that a method involving image capture, skin color detection, edge detection combined with histogram matching provides fairly accurate recognition of hand gestures. The first part Pansare’s system uses an 8 Megapixel webcam and the RGB color space method to capture images of a gesture. Next, in pre-processing, the RGB image is converted to a Hue Saturation Value (HSV) image. This allows the researchers to use Gaussian Filters to preserve edges and gray scale image smoothening. Then a Region of Interest is calculated, and edges are stored as vectors in an analysis software database. Finally, they are able to match a gray scale image histogram of the frequency of gray levels, and calculate maximum similarity values of the images in their developed database. Using a least Euclidian distance algorithm to detect static Devnagri Sign Language gestures, this system achieved an accuracy rate of 87.82% [6].
2.2.3 Depth Sensing Cameras
Depth sensing cameras are also referred to as RGB-D cameras due to color (RGB) and depth (D) sensing components within the device. The most widely known RGB-D camera is the Kinect made by Microsoft. The Kinect has an RGB Camera that delivers three basic color components of the video. The camera operates at 30 frames per second, and can offer images at 640 ×480 pixels with a resolution of 8-bits per pixel. Kinect also has the option to produce higher resolution images, running at 10 frames per second at the resolution of 1280 × 1024 pixels. For depth sensing the Kinect consists of an infrared (IR) laser projector and an IR
7
camera. Together, the projector and the camera create a depth map, which provides the distance information between an object and the camera. The sensor has a practical ranging limit of 0.8m − 3.5m distance, and due to its range and resolution the Kinect has shown weakness in tracking gestures that require finger position analysis [7, 8].
2.3 Leap Motion Controller
We used the Leap Motion Controller for this project. The Controller costs approximately $80, and the software, app store, and software development kit (SDK) is free. The software can be downloaded without registering an account with the company, but the SDK required
registration and a non-disclosure agreement. Leap Motion seems to be making great effort to provide any necessary resources to developers. The app store comes with introductory programs designed to help users familiarize themselves with the NUI (Natural User Interface). More interactive apps are available varying in cost from free to just over $10 [9].
Since a large portion of Sign Language is dependent on alphabet gestures, we focused on creating a database of alphabet and numeric characters. We analyzed the Leap Motion
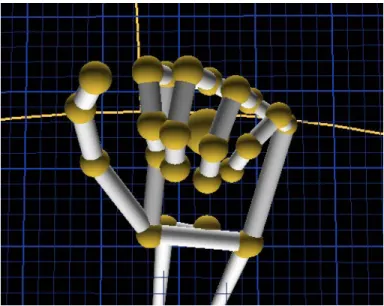
Controller sensor camera’s capability to interface with programming to correctly recognize and identify these static Sign Language gestures. NUI hardware, like the Leap Motion Controller, maps objects within a limited focal region directly to 2D or 3D coordinates in a virtual space. The coordinates for joints (vertices) and bones (edges) can be extracted from the Diagnostic Visualizer provided by Leap Motion. For this research, we focused on extracting 3D coordinates for finger tips, proximal finger joints, and the palm position from Leap Motion’s “Hand
8
Figure 2.2: Hand Hierarchy [9]
The controller tracks infrared light with a wavelength of 850 nanometers, and tracking is optimal when no external sources of infrared light are present. Since infrared light is invisible to the human eye precautions were taken to control lighting conditions during data collection and experimental testing. Natural and incandescent light may contain the infrared wavelength, so we operated the controller in fluorescent lighting since florescent lights do not emit energy in the infrared region. The controller has an effective range that is approximately 25 to 600 millimeters above the device, and it can track movements at more than 200 frames per second. We
performed gestures in what Leap Motion calls an Interaction Box, which is a 3D rectangular space that is a subspace of the controller’s field of view. The Interaction Box provides a
guarantee of image capture, provided the user keeps a hand or finger in the Box. The Interaction box is approximately 82.5 millimeters above the controller, and has a length, width, and height of 147, 235, and 235 millimeters respectively. The controller provides x, y, and z coordinates for
9
all objects that it tracks as shown in Figure 2.3. It is significant to note that name of an axis is irrelevant to the calculation of Euclidean Distance, a key analysis measure that is discussed later in this paper [9].
Figure 2.3: Leap Motion Controller Axes [9]
The Controller allows for increased sensitivity during motion tracking by allowing users to manipulate the scale for the axes, but since we are only interested in static gestures this is not relevant to methodology. However, the size of an individual’s hand greatly affected the
Euclidean Distance between our chosen critical vertices. Due to variations in the size of individual’s hands, we needed to collect distance information on a large sample from multiple subjects [9]. Guna’s study [14] of the Leap Motion sensor’s precision and reliability
demonstrated a standard deviation of tracking position no greater than 0.5 millimeters at all times, and an optimal scenario of less than 0.01 millimeters. Because of its accuracy we have chosen the Leap Motion Controller for this project. We discuss the data collection and methodology in Chapter 3.
10
CHAPTER THREE:METHODOLOGY
3.1 Selection of Static Gestures
Figure 3.1 shows the sign language gestures for letters of the alphabet and single digit numbers.
Figure 3.1: Sign Language Letter and Number Gestures
The gesture for “10” does not appear in Figure 3.1, but is included in the testing process for this project. The gesture “10” resembles what most are familiar with as a “Thumbs-Up” gesture and a representation can be seen in Figure 4.3. We have selected the following 28 gestures to use in our study:
[A, B, C, D, E, F, G, H, I, K, L, M, N, O, R, S, T, V, W, X, Y, 1, 3, 4, 5, 7, 8, 10] Gestures that are similar in shape, but vary in position orientation were not considered in this study. These include gestures for “P” and “Q” which are transpositions of the gestures “K” and “G” respectively as shown in Figure 3.1 and have been omitted from analysis. Similarly, “0”, “2”, “6”, and “9” are exact duplicates of letters “O”, “V”, “W”, and “F” respectively and will also not be included for our database or testing. Recognition of these gestures that are identical, but only differ in context of use, is out of the scope of this study.
11
3.2 Development of Database
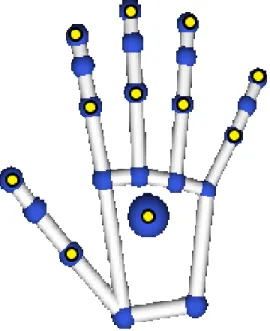
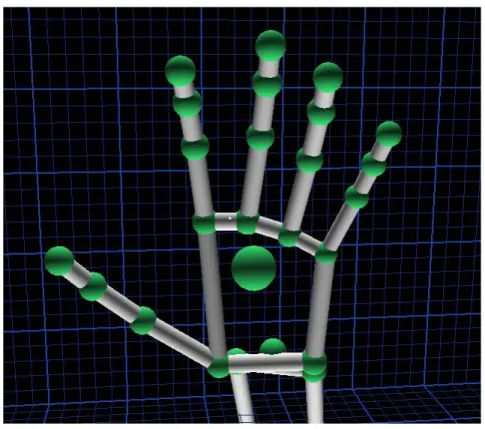
Figure 3.2: Recorded Vertices (shown in yellow) for Data Collection
In order to enable a recognition process, it was necessary to construct a database of accurate hand gestures. There are several steps required to constructing this database. First, an individual proficient in American Sign Language was selected to make accurate hand gestures. Secondly, the Leap Motion controller captured from this individual 20 samples for each of 28 targeted hand gestures. The data collected by the leap motion controller included the 3D coordinates of each of the 11 hand joints illustrated in Figure 3.2. Thirdly, for each gesture and for each sample, we calculated the Euclidian distances between the 11 key hand vertices. In all there are 55 distances between the 11 vertices. Next, for each gesture, the 55 distances were averaged over all 20 samples and then were stored in a matrix. This process was repeated for all 28 targeted gestures to form a database consisting of 28 matrices of mean Euclidian distances. The Diagnostic Visualizer provided by Leap Motion was used to ensure that the controller and participant were observing correct hand skeletal positioning.
12
The vertices chosen include each fingertip, proximal knuckle (closer to the palm), and the hand’s palm centroid, providing 11 critical 3D coordinates for comparison. These particular vertices were chosen because they are widely distributed throughout the hand and provide the variation for tracking differences in the gestures. All distances related to each vertex were captured as seen in Figure 3.3, and recorded in respective rows of the matrices. Figure 3.5 shows the database matrix for the letter A. Notice that there are 55 non-zero entries. These numbers represent the average distance in mm for each of the 55 collected hand gesture distances. Figure 3.3 shows the 10 distances collected from the tip of the thumb. These 10 entries were placed in the first row of the distance matrix. Figure 3.3 also shows the 9 distances collected from the thumb proximal knuckle. These 9 entries were placed in the second row of the distance matrix. Accuracy was insured by averaging multiple samples, and implementation of a scaling factor for the test subject’s gesture. After collecting multiple sets of data on our chosen critical vertices for each gesture, we then calculated the Euclidean Distance of each individual vertex to all of the other chosen vertices. These distances have been averaged and collected into a database for comparison to data recorded from test subjects. Due to the distinct nature of hand skeleton positioning for the Sign Language alphabet and numbers, this method provided a distinct matrix for each of the selected static gestures. The 11 vertices used to construct the database are labeled and recorded as seen in Table 3.1.
13
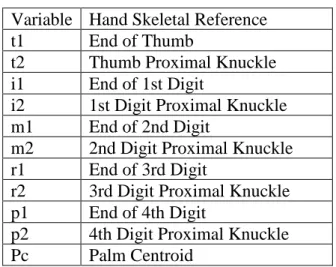
Table 3.1: Variables of Reference for Hand Skeleton Variable Hand Skeletal Reference
t1 End of Thumb
t2 Thumb Proximal Knuckle i1 End of 1st Digit
i2 1st Digit Proximal Knuckle m1 End of 2nd Digit
m2 2nd Digit Proximal Knuckle r1 End of 3rd Digit
r2 3rd Digit Proximal Knuckle p1 End of 4th Digit
p2 4th Digit Proximal Knuckle Pc Palm Centroid
Leap Motion offers software development kits (SDK) for almost every programming platform. We decided to create our data collection programs in Java because of its popularity. The Leap Motion camera reports a vast amount of data including shapes, lengths, and coordinates. We created a container program to manage the data capture program, which “Listened” to the information being emitted from the Leap Motion camera. We wrote a program to accept a key stroke to capture the necessary data for one hand gesture. The data was then written as a comma-delimited string to a text (.txt) file to be interpreted by our Matlab algorithms. We set variables in the listener program to record the three-dimensional coordinates from the points of interest listed in Table 3.1. When the Matlab programs search through lines of the text file they sort the coordinates into three-dimensional vectors so that we can start measuring the Euclidean distances. This provided the measurements for the matrices used in our comparison algorithm.
14
Figure 3.3: Tip of Thumb and Thumb Proximal Knuckle Distances
The distances between these critical vertices are measured by a Euclidean Norm of the difference in each point’s x, y, and z coordinates [13]. For example, the mathematical formula for the Euclidean Distance D between vertices t1 and i1 is
𝐷𝐷 =��𝑡𝑡1(𝑥𝑥)− 𝑖𝑖1(𝑥𝑥)�2+�𝑡𝑡1(𝑦𝑦)− 𝑖𝑖1(𝑦𝑦)�2+�𝑡𝑡1(𝑧𝑧)− 𝑖𝑖1(𝑧𝑧)�2, (3-1) which provides a distance in millimeters to be placed in the matrix for the specific gesture. An example of visualization for the gesture of the letter “A” is shown in Figure 3.4, along with a distance matrix for fingertip position in Figure 3.5. The matrix of Euclidean distances provides the distances between each combination of fingertips. For example, the 1st row refers to the tip of the thumb and the 4th column refers to the proximal knuckle of the 1st digit (index finger). Therefore the element A(1,4) = 31 means that there is a distance of 31 mm between the thumb fingertip and the 1st digit’s proximal knuckle.
15
Figure 3.4: Leap Motion’s Visualization of the Letter A
Figure 3.5: Matrix for “A” of Rounded Euclidean Distances
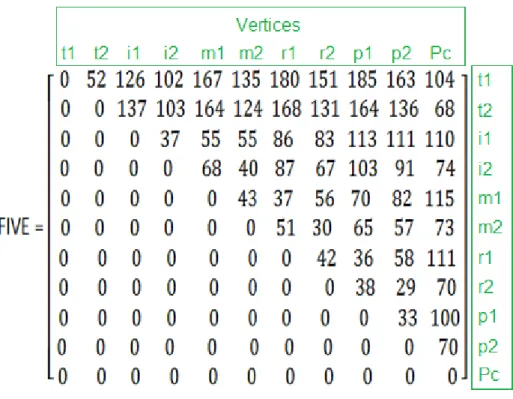
For contrast, one of the larger spanning gestures, the number “5”, is shown visually and mathematically in Figures 3.6 & 3.7, respectively. Here we can see the distance from the tip of the thumb and the proximal knuckle of the 1st digit FIVE(1,4) = 102 mm, a much larger distance than the 31 mm recorded for “A”. Similar to this singular measurement, most of the distances of critical vertices recorded in the matrix for “5” are greater than their counterparts for the smaller gesture “A”. We can also see that elements that are not capable of drastic changes are similar in
A = ⎣ ⎢ ⎢ ⎢ ⎢ ⎢ ⎢ ⎢ ⎢ ⎢ ⎡0 0 47 62 54 72 64 83 72 95 600 47 40 31 50 46 63 67 73 87 73 0 0 0 35 11 35 24 44 36 58 50 0 0 0 0 44 18 52 40 56 61 58 0 0 0 0 0 40 15 44 29 54 52 0 0 0 0 0 0 44 23 44 45 54 0 0 0 0 0 0 0 40 16 44 49 0 0 0 0 0 0 0 0 33 22 49 0 0 0 0 0 0 0 0 0 31 42 0 0 0 0 0 0 0 0 0 0 51 0 0 0 0 0 0 0 0 0 0 0 ⎦⎥ ⎥ ⎥ ⎥ ⎥ ⎥ ⎥ ⎥ ⎥ ⎤
16
both matrices. For instance the distance from the thumb’s end to its proximal knuckle has a 5 mm difference between the smaller and larger gesture, A(1,2) = 47 and FIVE(1,2) = 52.
17
Figure 3.7: Matrix for “5” of Rounded Euclidean Distances
The distances shown in the previous figures are in millimeters, and have been rounded to the nearest millimeter. The actual data collected from the Leap Motion camera, rounded to the nearest ten-thousandth of a millimeter, provides more accuracy for the recognition algorithm. Coordinates were converted to vectors and recorded as variables listed in Table 3.1 using MATLAB. The Euclidean distances were stored in matrices similar to Figures 3.5 & 3.7 for each sample gesture collected. Individual matrices generated by this method for the same gesture were added together, and finally divided by the number of samples collected to generate average distance matrices for each gesture. This resulted in a database consisting of 28 distance matrices, one for each of the selected gestures.
The overall size and skew of these matrices, which is measured by the Frobenius norm, ‖𝐴𝐴‖𝐹𝐹 = �∑𝑖𝑖=111 ∑11𝑗𝑗=1|𝑎𝑎𝑖𝑖,𝑗𝑗|2, (3-2)
18
where 𝑎𝑎𝑖𝑖,𝑗𝑗 is the element corresponding to row i and column j, played a large role in the
identification and scaling algorithms [15]. Using the Frobenius norm we were able to verify that data from each sample used was consistent with the expected result, and outliers were removed. These outliers could have come from samples that were corrupted during the recording or transferring process. Further exploration of accuracy evaluation when writing, transferring, and reading data through multiple programs and devices may be evaluated in future studies.
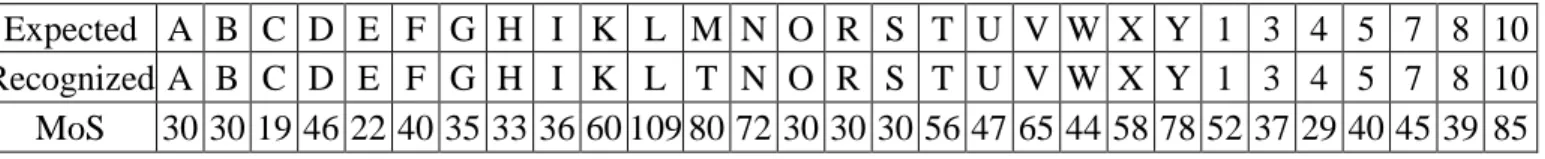
Table 3.2: Comparison of Database Collector to Tested Gestures
Expected A B C D E F G H I K L M N O R S T U V W X Y 1 3 4 5 7 8 10 Recognized A B C D E F G H I K L T N O R S T U V W X Y 1 3 4 5 7 8 10 MoS 30 30 19 46 22 40 35 33 36 60 109 80 72 30 30 30 56 47 65 44 58 78 52 37 29 40 45 39 85
The algorithm was initially tested on the individual from whom we collected the database. We computed the Frobenius norm of the difference between the performed gesture and each of the data base gestures. Later we will refer to this value as the metric of similarity (MoS) used in the last stage of recognition algorithms discussed in Section 3.3. Table 3.2 shows the recognized gesture and the MoS associated with that gesture. Note that all gestures were correctly identified except for “M,” which was recognized as a “T.” This result is similar to the findings in subsection 4.2.1 in which we analyze tightly clustered gestures.
At the beginning of the experiment each test subject was asked to perform an open hand (“5”) gesture so that we could get an unobscured view of their skeletal structure by using Leap Motion controller. This initial gesture allowed us to calculate scaling factors as needed when performing the analysis portion of this project. We assumed a scaling factor would be necessary because of the difference in overall size of the hand used for database collection and each
individual test subject’s hands. A scaling factor allows us to make a more accurate recognition algorithm.
19
The first scaling factor (SF1) that we decided to use also came from the Frobenius norm for the gesture “5”. Since this sign is performed by extending all fingers as far from the palm as possible, as seen in Figure 3.6, we were able to observe and compare the size of the test subject’s hand to the size of the hand used for database collection. Next, we incorporated these norms into a scaling variable
𝑆𝑆𝑆𝑆1 = ‖𝑇𝑇𝑇𝑇𝑇𝑇(5)‖𝐹𝐹
‖𝐷𝐷𝐷𝐷(5)‖𝐹𝐹 (3-3) where 𝑇𝑇𝑆𝑆𝑇𝑇(5) is the distance matrix for the test subject’s open hand (“5”) gesture, and 𝐷𝐷𝐷𝐷(5) is the distance matrix for the database “5” gesture. In order to ensure accuracy, we expanded potential scaling factors beyond this method. The other two scaling factors (SF2 and SF3) considered the distance to the palm centroid from the tip of the thumb and middle finger tip as seen in Figure 3.8. The corresponding equations for SF2 and SF3 are shown in Equations 3-4 and 3-5:
𝑆𝑆𝑆𝑆2 = 𝑇𝑇𝑇𝑇𝑇𝑇(5)𝑡𝑡1,𝑝𝑝𝑝𝑝
𝐷𝐷𝐷𝐷(5)𝑡𝑡1,𝑝𝑝𝑝𝑝 (3-4) 𝑆𝑆𝑆𝑆3 = 𝑇𝑇𝑇𝑇𝑇𝑇(5)𝑚𝑚1,𝑝𝑝𝑝𝑝
𝐷𝐷𝐷𝐷(5)𝑚𝑚1,𝑝𝑝𝑝𝑝 (3-5) where 𝑇𝑇𝑆𝑆𝑇𝑇(5)𝑡𝑡1,𝑝𝑝𝑝𝑝refers to a distance from the test subject’s gesture and t1, m1, and pc refer to the tip of the thumb, tip of the middle finger, and palm centroid, respectively. Visual
20
Figure 3.8: 2nd Scaling Factor (SF2) Distance and 3rd Scaling Factor (SF3) Distance The scaling factor is greater than 1 (SF > 1) for any hands larger than the one used for data collection, and less than 1, (SF < 1), for hands that were smaller. Finally, each of the test subjects distance matrices were divided by this scaling factor,
𝑇𝑇𝑆𝑆𝑇𝑇∗ = 𝑇𝑇𝑇𝑇𝑇𝑇𝑇𝑇𝐹𝐹(∗) (3-6)
where𝑇𝑇𝑆𝑆𝑇𝑇(∗) was the sample matrix collected and 𝑇𝑇𝑆𝑆𝑇𝑇∗ was the resulting normalized test subject gesture that could then be used in the recognition algorithm. This increased the value of the distance matrix elements for test subjects with smaller hands, and decreased the ones from larger hands.
3.3 Analysis Procedure for Static Hand Gesture Recognition
To test my design I recruited eight volunteers, and recorded static information from their performance of all letter and number gestures collected in the database. The recorded data consists of a collection of normal and blind study samples from each test subject’s right hand to ensure program and testing accuracy. The “Recognizer” program accurately, and consistently,
21
identifies static gestures within a certain threshold of error, which will be discussed in Chapter 4. After the test subject’s gestures were collected the Frobenius Norm F is computed as
𝑆𝑆 =�∑𝑖𝑖=111 ∑11𝑗𝑗=1|(𝑎𝑎𝑖𝑖,𝑗𝑗 − 𝑏𝑏𝑖𝑖,𝑗𝑗)|2, (3-7)
where a and b are representative of elements from two different matrices [14, 15]. The smallest absolute values from this calculation imply the greatest similarity for the test gesture and
established gestures in the database.
We chose to compute a metric of similarity (MoS) to judge how close a user’s gesture was to a given database gesture. This metric is the Frobenius norm function performed on the difference between a given database distance matrix and the test subject’s distance matrix, and is computed using:
𝑀𝑀𝑀𝑀𝑆𝑆 =𝑆𝑆(𝐷𝐷𝐷𝐷∗− 𝑇𝑇𝑆𝑆𝑇𝑇∗) (3-8)
where𝐷𝐷𝐷𝐷∗ is the database distance matrix for a given symbol under test and 𝑇𝑇𝑆𝑆𝑇𝑇∗ is the normalized test subject’s distance matrix. For example, the Frobenius norm expression 𝑆𝑆(𝐷𝐷𝐷𝐷𝐴𝐴− 𝑇𝑇𝑆𝑆𝑇𝑇∗) is a measure of how close database gesture A is to the test subject’s gesture. The smaller this metric is, the closer the test subject’s gesture is to the given data base gesture. The algorithm computes the MoS for each symbol under test, and then finds the symbol with the smallest MoS using:
𝑛𝑛= min[𝑆𝑆(𝐷𝐷𝐷𝐷𝐴𝐴− 𝑇𝑇𝑆𝑆𝑇𝑇∗),𝑆𝑆(𝐷𝐷𝐷𝐷𝐷𝐷− 𝑇𝑇𝑆𝑆𝑇𝑇∗),𝑆𝑆(𝐷𝐷𝐷𝐷𝐶𝐶− 𝑇𝑇𝑆𝑆𝑇𝑇∗)⋯ 𝑆𝑆(𝐷𝐷𝐷𝐷10− 𝑇𝑇𝑆𝑆𝑇𝑇∗)] (3-9)
where 𝐷𝐷𝐷𝐷𝐴𝐴 , 𝐷𝐷𝐷𝐷𝐷𝐷,𝐷𝐷𝐷𝐷𝐶𝐶, etc. are the database distance matrices for the symbols A, B, C, etc. We stored n and the database gesture associated with the smallest MoS. This process was repeated for all three scaling factors given in equations (3-3) through (3-5). The recognized gesture was chosen based on the smallest calculated MoS. An example is shown in Table 3.3. In this example, computed metrics of similarity, given by 𝑆𝑆(𝐷𝐷𝐷𝐷∗− 𝑇𝑇𝑆𝑆𝑇𝑇∗), are tabulated for a test subject who performed a “W” Hand Gesture. In this example, 53 is the smallest MoS, and was
22
computed using scaling factor 3 with the Database Gesture “W.” The best fit algorithm correctly recognized the “W” gesture, because the lowest MoS value was associated with the Database Gesture “W”. Note that the letter “W” had the smallest metric of similarity for all scaling factors, and thus showed that the test subject’s gesture most closely matches the letter “W”.
Table 3.3: Computed Metrics for a Sample Test Subject Presenting a “W” Hand Gesture
Database Gesture A B C D E F G H I K L M N O R S T U V W X Y 1 3 4 5 7 8 10 Metric of similarity SF1 3 6 2 2 4 4 2 6 2 2 8 6 2 8 0 2 7 7 3 4 6 2 6 6 3 3 7 2 5 8 3 0 5 3 5 3 3 5 2 3 4 2 2 4 6 3 7 6 3 4 0 2 3 3 2 3 1 6 7 3 2 9 3 3 8 3 2 0 2 5 6 1 9 8 3 1 4 2 3 2 2 6 8 3 5 9 SF2 372 251 269 292 288 281 356 275 345 265 309 363 362 351 254 386 350 239 235 75 337 344 328 257 202 313 237 271 367 SF3 323 216 238 260 250 266 309 231 307 233 290 312 312 304 219 335 300 213 216 53 294 320 293 259 186 322 216 258 325
Table 3.4 shows an example in which the best fit algorithm did recognize the test subject’s gesture, but not all scaling factor methods did. Table 3.4 we can see that the MoS for recognizing “K” was the lowest in comparison with all other gestures for both SF1 and SF2. However, the MoS for SF3 was lowest for “G.” Since the lowest MoS of 101 occurred while comparing the database ‘K” with the user’s gesture, the “Best Fit” process correctly identified ‘K’ as the user’s gesture.
Table 3.4: Computed Metrics for a Sample Test Subject Presenting a “K” Hand Gesture Database Gesture A B C D E F G H I K L M N O R S T U V W X Y 1 3 4 5 7 8 10 Metric of similarity SF1 228 255 263 170 245 288 130 155 260 105 235 212 209 224 187 226 203 211 218 269 141 325 148 310 262 407 237 263 260 SF2 233 256 263 169 246 286 134 157 262 101 232 218 214 228 186 231 208 209 215 267 144 325 147 306 259 404 234 260 263 SF3 210 255 265 179 242 300 113 153 254 127 250 192 190 208 193 205 185 223 234 281 135 328 155 330 274 423 250 278 249
Table 3.5 shows an example in which the best fit algorithm did not recognize the test subject’s gesture. In this example the test subject was signing an “M.” The best fit algorithm identified 106 as the smallest MoS associated with the letter ‘N” and therefore chose “N” as the recognized gesture. It is notable that the two gestures are very similar and this test revealed some vulnerabilities with our methods. Table 3.5 shows that the MoS for “M” is only slightly larger than “N” for SF1 and SF2, and “S” for SF3. This is an example of how our algorithm recorded similar MoS values for these three gestures. The gestures “M”, “N”, and “S” are
23
examples of tightly clustered gestures. We provide results and analysis concerning these types of gestures in subsection 4.2.1.
Table 3.5: Computed Metrics for a Sample Test Subject Presenting a “M” Hand Gesture Database Gesture A B C D E F G H I K L M N O R S T U V W X Y 1 3 4 5 7 8 10 Metric of similarity SF1 137 250 271 254 232 361 157 197 242 258 351 110 107 135 255 109 112 299 325 331 180 351 247 429 323 491 311 350 226 SF2 136 247 267 250 229 358 155 194 239 255 348 108 106 132 251 108 110 295 321 327 177 349 243 425 319 487 307 346 225 SF3 144 266 286 270 247 377 167 212 253 275 365 121 118 147 270 115 124 314 341 349 193 363 260 445 341 507 328 366 234
24
CHAPTER FOUR: RESULTS AND ANALYSIS 4.1 General Analysis
The final difference metric selected the gesture from the method that computed the best or closest fit. By looking for the smallest comparison (n) value we were able to see which gesture was recognized with the least amount of difference in distance between the sample and all gestures in the database. As shown in Table 4.1, the first scaling factor, using the Frobenius norm of an open hand, provided a 72.86% accuracy for all gestures tested. The other two scaling factors, using single distances from thumb and middle finger tip to palm centroid (Figure 3.8), provided a 72.38% and 66.67% accuracy respectively. The best fit difference metric consisted of choosing the reported gesture with the smallest Frobenius norm of difference, or “least”
difference, from all three scaling factors. Using this method, we were able to improve accuracy to 76.67% across all gestures. The “Best Fit” measures are highlighted in the test subject’s reported gestures in Appendices A-1 through A-7.
Table 4.1: Recognition Accuracy of Scaled Algorithms by Test Subject
4.2 Digital Relationships
The most significant factor for recognition accuracy is discovered when considering the number of fingers extended for a particular gesture, position of visible fingers, and
Test Subject Scale 1 Accuracy Scale 2 Accuracy Scale 3 Accuracy Best Fit Accuracy
1 56.67% 56.67% 46.67% 56.67% 2 76.67% 70.00% 73.33% 73.33% 3 83.33% 83.33% 73.33% 83.33% 4 70.00% 76.67% 60.00% 83.33% 5 70.00% 66.67% 76.67% 83.33% 6 76.67% 76.67% 66.67% 76.67% 7 76.67% 76.67% 70.00% 80.00% Average 72.86% 72.38% 66.67% 76.67%
25
correspondence to neighboring fingers. All three of these factors give us a clear look at what the Leap Motion camera is capable of distinguishing for the purpose of gesture recognition, and which weaknesses need to be considered for further development. Further research might also include directional orientation so that gestures such as “P”, “Q”, and “U” can be distinguished from “K”, “G”, and “H”.
4.2.1 Tightly Clustered Gestures
Figure 4.1: Tightly Clustered Gestures
Table 4.2: Accuracy Comparison for Tightly Clustered Gestures Gesture Scale 1 Scale 2 Scale 3 Best Fit
Mistaken Gesture (of 7 subjects) A 100.00% 100.00% 85.71% 100.00% All Correct M 0.00% 0.00% 0.00% 0.00% S,I,N,N,N,N,S N 42.86% 28.57% 57.14% 57.14% S,T,H S 85.71% 85.71% 100.00% 100.00% All Correct T 42.86% 28.57% 14.29% 42.86% S,O,S,S
The gestures above are tightly clustered and lacking digital, or finger, extensions away from the palm. This category of gestures has the most diverse results as can be seen in Table 4.2. The most critical factor for these gestures is finger visibility. “A” and “S” have all five fingers exposed to the camera and provide the most accuracy. Each scaling factor is above average for
26
reporting the correct gesture, which also provides above average results for the Best Fit difference metric as well.
When the camera tries to distinguish between gestures where some fingers are covered the accuracy decreases, and no matter which scaling factor is used, the results are below average for the study. Although “M” is the only gesture in this study with a 0% accuracy, the algorithm falsely recognized it as either “N” or “S” for over 85% of the test subjects. Our algorithm considers M, N, and S to be very similar, because the differences in distance are very similar for all three gestures. In addition, difficulty discerning “M”, “N”, and “T” fits a hypothesis made earlier when we considered “shadowing” glitches that were observed when the Leap Motion camera had difficulty discerning fingers that were blocked from view. “N” had the best results for a gesture that involved crossing the thumb, and was confused with “S” and “T” for only 28.57% of test subjects. “T” was just as likely to be correctly reported as it was to register as “S”. We assume that these gestures might be more easily identified if thumb visibility is addressed in the algorithm, or if we were to integrate the new Leap Motion “IsExtended” parameter in the data collection, which provides a True/False condition for whether a finger is extended or not.
27 4.2.2 Clustered With “Half” Extensions
Figure 4.2: Gestures with Clustered Partial Finger Extensions
Table 4.3: Accuracy of Half Extended Gestures with Corresponding Fingers Gesture Scale 1 Scale 2 Scale 3 Best
Fit Mistaken Gesture (of 7 subjects) O 57.14% 28.57% 14.29% 57.14% S,S,S E 57.14% 71.43% 57.14% 57.14% S,S,O C 57.14% 57.14% 42.86% 57.14% B,E,E
We can see more conformity for this grouping of gestures, but with all scaling factors reporting below average results there is no significant improvement of accuracy. When the algorithm failed to recognize “O” it reported “S” for all test subjects, which may be a result from a blocked view as observed in the gestures from section 4.2.1. Similarly, “E” was mistaken as “S” or “O” 42.86% of the time. “C” was incorrectly recorded as “E” for 28.57% of test subjects and “B” for 14.29%. In this set we can see that SF1 matched the accuracy of the Best Fit
difference metric, while the other two scaling factors were not as accurate. These gestures might be more easily identified by an additional algorithmic condition involving the distance of the finger tips do the palm centroid.
28 4.2.3 One Digital Extension
Figure 4.3: Gestures with One Finger Extension
Table 4.4: Accuracy of Gestures with One Extended Finger Gesture Scale 1 Scale 2 Scale 3 Best Fit
Mistaken Gesture (of 7 subjects) D 85.71% 85.71% 14.29% 57.14% G,1,1 G 42.86% 42.86% 71.43% 71.43% X,D I 100.00% 100.00% 71.43% 100.00% All Correct X 42.86% 42.86% 57.14% 57.14% G,G,G 1 71.43% 71.43% 57.14% 71.43% X,X 10 100.00% 100.00% 85.71% 100.00% All Correct
The four gestures on the left (D, G, X, 1) are all performed by fully, or partially,
extending the index finger from a closed hand, or fist. The letter “D” is performed by making an “O” and extending the index finger. Whenever a recognition algorithm has to discern between gestures that have slight differences, there will be falsely recognized gestures. For example, “X” and “1” are very similar in shape and they only differ by the degree to which the index finger is
29
extended. For this reason, it may explain why “D”, “G”, “X”, and “1” were not perfectly recognized. For these four gestures, all scaling factors performed slightly below their total average of accuracy with the exception of recognizing the gesture “D”. This is one of only two gestures that one or more of the scaling factors, in this case SF1 and SF2, actually reported the correct gesture with greater accuracy than the Best Fit selection of samples. The letter “X” was reported as “G” incorrectly for 42.86% of test subjects, which is assumed to be due to the proximity of the thumb and index finger in both gestures.
While the two gestures on the right, “I” and “10”, also involved extension of one finger, and no other gestures exclusively involve the extension of only the pinky or thumb. Initial hypothesis of the combined algorithm was confirmed when these gestures resulted with 100% accuracy when using SF1, SF2, and Best Fit difference metric. Several suggested improvements would be to further distinguish between these gestures by 1) using the new Leap Motion
“IsExtended” parameter to determine which finger is extended, 2) calculating finger azimuth and elevation angles to distinguish orientation differences, and 3) using coordinate data to compare curvature of the fingers (since “X” has a bent index finger).
4.2.4 Two Adjoined Digital Extensions
30
Table 4.5: Accuracy of Gestures with Two Adjoined Extended Fingers Gesture Scale 1 Scale 2 Scale 3 Best
Fit Mistaken Gesture (of 7 subjects) H 57.14% 85.71% 85.71% 85.71% R R 42.86% 28.57% 42.86% 42.86% H,H,U,H U 28.57% 28.57% 14.29% 28.57% R,R,R,R,R
H, R, U are gestures in which two neighboring fingers adjoin, meaning they are extended and touching. The accuracy level for “R” and “U” is decreased for all scaling factors. “R” was confused for either one of the other gestures from this group for 57.14% of the test subjects, and “U” was recognized as “R” for 71.43% of users. One will notice that U and H are very similar except that the orientation is different between the two. The algorithm used for recognition was distance-based and did not consider angles in computing the metric of similarity. After
experience with how our data collection worked with our algorithms we should not have analyzed both “H” and “U”, but should have chosen only one of these to include the list of chosen gestures to test with our recognition algorithm. It is suggested that future research efforts develop a gesture recognition algorithm that combines both distance measures and angles in computing a metric of similarity.
Although there is a “crossing” of the fingers for “R” there is no real difference for the distance between vertices for the extended fingers in “R” and “U”. Correspondence to a
neighboring finger in gestures that are perpendicular to the camera seems to have caused greater confusion for the data collection due to visual interference from other fingers clustered below the extended fingers. The gesture “H” is performed by making a gesture parallel to the desk top surface providing a better view of the extended fingers. When considering the false positives for these gestures we can see that the algorithm may not have been specific enough to detect much
31
variation between them. One improvement for better recognition of these gestures could be to detect whether two adjacent fingers are crossed or not. This could be implemented by computing the angle between the two adjacent fingers.
4.2.5 Two Non-Adjoined Digital Extensions
Figure 4.5: Gestures with Two Extended Non-Adjoined Fingers
Table 4.6: Accuracy of Gestures with Two Non-Adjoined Extended Fingers Gesture Scale 1 Scale 2 Scale 3 Best Fit
Mistaken Gesture (of 7 subjects) K 57.14% 57.14% 28.57% 42.86% H,H,H,H L 100.00% 100.00% 100.00% 100.00% All Correct V 100.00% 100.00% 71.43% 100.00% All Correct Y 100.00% 100.00% 100.00% 100.00% All Correct
While this group also involves two extended fingers, we call them non-adjoining because they are not touching. For this set we can see the algorithm had difficulty correctly identifying the gesture “K”, and it assumed the data reported from the Leap Motion camera was an “H” for 57.14% of the test subjects. This is likely due to the thumb blocking the camera’s view of the index finger because of the orientation of the gesture “K”, and would cause the camera to assume the finger behind the thumb was extended as well. The gesture “K” is the second out of two gestures to have higher accuracy with SF1 and SF2 than with the Best Fit selection.
32
The gestures “L”, “V”, and “Y” were detected with complete accuracy across all scaling factors with the exception of how SF3 worked with the gesture “V”. Again, we consider this to be a greater error with the camera’s capability to collect data due to difficulty with visibility of the extended fingers. We are assuming the increase in accuracy for this group is because there are no other gestures that use two non-adjoining extended fingers. This category is extremely accurate compared to the sections before, but the confusion with “K” and “H” might be resolved by determining parallelism for the index and middle fingers.
4.2.6 Three Digital Extensions
Figure 4.6: Gestures with Three Extended Fingers
Table 4.7: Accuracy of Gestures with Three Extended Fingers Gesture Scale 1 Scale 2 Scale 3 Best Fit
Mistaken Gesture (of 7 subjects) F 100.00% 100.00% 100.00% 100.00% All Correct W 100.00% 100.00% 100.00% 100.00% All Correct 3 100.00% 100.00% 85.71% 100.00% All Correct 7 100.00% 100.00% 100.00% 100.00% All Correct 8 85.71% 85.71% 85.71% 85.71% B
The gestures with a more open hand, or more extended fingers, have the greatest accuracy in this algorithm, and seem to be less affected by correspondence and visibility, or
33
shadowing, errors. Here we can see that the scaling factors have 100% accuracy across the study, with the exception of how our algorithm records “3” with SF3 and each with the gesture “8”. These instances still have an accuracy above the average recognition capability for their perspective scaling factors. The only gesture from this group that did not reach complete accuracy with the Best Fit difference metric was “8”, which was falsely recognized as “B” for 14.29% of test subjects. We believe this is also due to the thumb’s line-of-sight interference with the camera on the tabletop. Otherwise this group of gestures is completely accurate with this algorithm.
4.2.7 Four to Five Digital Extensions
Figure 4.7: Gestures with Four or Five Extended Fingers
Table 4.8: Accuracy of Gestures with Four or Five Extended Fingers Gesture Scale 1 Scale 2 Scale 3 Best Fit
Mistaken Gesture (of 7 subjects) B 28.57% 42.86% 100.00% 100.00% All Correct 4 100.00% 100.00% 100.00% 100.00% All Correct 5 100.00% 100.00% 100.00% 100.00% All Correct
As hypothesized, this is the most accurate set of gestures with complete accuracy for all three gestures with the Best Fit consideration. We are assuming that this is because the extended and open fingers eliminate error of detection for the 3D camera. During formation of database
34
and testing we were able to observe the Leap Motion program would typically assume that a finger was extended if it did not have a “clear” view of it. We assume the falsely recognized “B” gestures using SF1 and SF2 were due to visibility errors and proximity to corresponding fingers.
One of our original hypotheses was that the algorithm would have trouble differing between the gestures “B” and “4”. This showed to be true for recognition using SF1 and SF2, but SF3 was 100% accurate, and provided the Best Fit, as can be seen in tables in the appendices. While “B” was reported incorrectly for “C” and “8” there were no instances of it reported for the gesture “4”.
35
CHAPTER FIVE:CONCLUSIONS AND FUTURE CONSIDERATION This study was focused on developing and measuring the accuracy of a static gesture recognition method using modern innovative technologies. This was accomplished with the Leap Motion camera and distance analysis algorithms through the computational software Matlab. A combination of a difference metric for best fit among three scaling methods provided a 76.67% accuracy for all gestures tested.
We collected data from seven test subjects that were at least moderately familiar with the set of tested static gestures. To ensure confidence, the test subjects would practice the gestures with the test administrator before they were recorded for data collection. The subjects were also shown a demonstration with the Leap Motion camera, and giving them time to interact with it helped them understand and orient to the camera’s capability. Once they were comfortable with the equipment and confident of their capability to perform the correct gestures we initiated the interaction of the Java program and the camera. We collected 29 differing gestures to compare against a database that had been previously recorded by the test administrator.
Using a Leap Motion camera, we have collected data on skeletal structure of the human hand while performing sign language gestures. We selected to record the Euclidean coordinates for critical vertices, or finger joints and the center of the palm, that would shift in location or orientation, across all selected gestures. The Leap Motion camera emits a great amount of data for the hand that it observes, and we developed a java program that could collect the specified data desired. Once we had this data stored into a delimited line of text in a file we were able to export/import the information into Matlab which we used for analysis. We
three-36
dimensional coordinates for all vertices. We designed an algorithm that would search for the closest match to our database using the Frobenius norm for matrix comparisons.
In order to eliminate issues with size or skeletal structure that may differ from person-to-person we introduced scaling factors for the assembled matrices. The first scaling factor used the Frobenius norm of the distances of the test subjects open hand. For SF2 we chose the distance from the tip of an extended thumb to what was recorded as the center of the palm. Similarly, SF3 was created using a comparison of the distance from the tip of the middle finger and the center of the palm. SF1 was slightly more accurate than SF2, and considerably better than SF3, across all test subjects and gestures. In order to take advantage of all three scaling factors, we developed a best fit model that selected the gesture recognized by the method with the smallest difference metric. Our combination of algorithms showed the most accuracy when the skeletal structure of the hand was most open. The more fingers that were extended and separated provided more accurate recognition. The overall recognition accuracy was 77% for all gestures and all test subjects.
In future studies, we believe we can eliminate one of our algorithm’s weaknesses by introducing consideration for the orientation, or direction, of the hand in similarly structured gestures. Since gestures are typically performed away from the person a cradle to hold the Leap Motion camera might make it easier to recognize hand structure from a more forward vantage point. Recognition could be improved by refining algorithms for certain categories of gestures, such as adding a method for determining if fingers are crossed and amount of curvature for specific fingers. Updating our SDK would allow us to record parameters that have been added in newer versions, such as detecting whether or not a finger is extended. We would also be
37
rather than one that was recorded and set before we initiated the recognition algorithm. We hope to make information from this study available on Leap Motion’s open forum so that our findings might help software developers with future recognition projects, and advance the sign language recognition capability of the Leap Motion camera.
38 REFERENCES
1. “Deaf Culture,” Deaf Websites, http://www.deafwebsites.com
2. V. Cordova, “Finger placement correction for static gesture recognition in American Sign Language,” MST Thesis, Dept. of Engineering Technology, Western Carolina University, Cullowhee, NC, 2014.
3. D. M. Perlmutter, “What is Sign Language?” Linguistic Society of America, http://www.lsadc.org
4. “3 Forms of Sign Language: ASL vs. PSE vs. SEE,” https://signsoflifeasl.wordpress.com, February 27, 2013.
5. Y. N. Khan and S. A. Medhi, “Sign Language Recognition using Sensor Gloves,” Procedings of the 9th International Conference on Neural Information Processing ICONIP 20002, Lahore, 2002, pp. 2204-2206.
6. J. R. Pansare et al., “Real-Time Static Devnagri Sign Language Translation using Histogram,” International Journal of Advanced Research in Computer Engineering & Technology (IJARCET), Volume 2, Issue 4, April 2013
7. M. Kan, “Microsoft Uses Kinect to Interpret Sign Language from Deaf People,” PC World, http://www.pcworld.com, October 31, 2013.
8. A. Agarwal and M. K. Thakur, “Sign Language Recognition using Microsoft Kinect,” 2013 Sixth International Conference on Contemporary Computing (IC3), pp. 1181 – 185. 9. Leap Motion Controller, Leap Motion Inc., www.leapmotion.com.
10.J. P. Morford et al., “Seeing Signs: Language Experience and Handshape Perception,” Deaf Studies Digital Journal, Issue No. 2: Fall 2010.
39
11.J. Lapiak, “Handspeak: Sign Language Resource,” http://www.handspeak.com, 1996-2015.
12.W. Vicars, “American Sign Language,” http://lifeprint.com, 2012.
13.E. W. Weisstein, "Distance." From MathWorld--A Wolfram Web Resource.
http://mathworld.wolfram.com/Distance.html, 2015.
14.E. W. Weisstein, "Matrix Norm." From MathWorld--A Wolfram Web Resource.
http://mathworld.wolfram.com/MatrixNorm.html, 2015.
15.E. W. Weisstein, "Frobenius Norm." From MathWorld--A Wolfram Web Resource.
http://mathworld.wolfram.com/FrobeniusNorm.html, 2015.
16.E. Deza and M. M. Deza, “Encyclopedia of Distances,” Springer-Verlag Berlin Heidelberg, 2009.
17.J. Guna, “An Analysis of the Precision and Reliability of the Leap Motion Sensor and Its Suitability for Static and Dynamic Tracking,” Sensors 2014, 14, 3702-3720.
40
Appendix A: Test Subject Data
Tables A1 through A7 present the recognized gesture and the associated metric of similarity (as defined in section 3.3) for each test subject and for each scaling factor. The shaded cells identify the gesture recognized by the best fit method and the associated metric of similarity.
Table A1: Recognized Gestures from Test Subject #1
Gesture Metric of
Similarity Recorded Gesture SimilarityMetric of Recorded Gesture SimilarityMetric of Recorded Gesture
A 46.33 A 43.61 A 59.91 A B 38.13 B 38.31 B 49.05 B C 81.07 B 77.59 B 98.11 B D 99.17 Q 98.95 Q 103.14 Q E 103.28 S 103.49 S 104.64 S F 102.99 F 106.54 F 95.98 F G 74.82 X 76.94 X 71.52 X H 60.04 H 61.77 H 60.10 H I 125.94 I 122.60 I 138.00 I K 60.05 H 64.46 H 48.46 H L 65.39 L 61.18 L 87.25 L M 73.77 S 72.43 S 81.47 S N 118.73 S 117.76 S 124.04 S O 96.65 S 96.22 S 100.52 S R 62.44 H 65.42 H 57.20 H S 95.54 S 93.72 S 104.26 S T 88.26 S 86.63 S 96.49 S U 47.72 R 48.40 R 55.09 R V 58.91 V 56.31 V 76.76 V W 66.38 W 63.53 W 84.62 W X 96.73 Q 96.71 Q 100.07 Q Y 58.89 Y 53.74 Y 82.95 Y 1 70.07 1 66.09 1 72.25 X 3 98.88 3 92.34 3 127.32 3 4 41.99 4 41.21 4 58.01 4 5 56.85 5 58.14 5 68.89 5 7 78.92 7 73.73 7 102.38 7 8 124.18 E 123.15 8 126.08 O 10 79.59 10 75.64 10 88.21 A
41
Table A2: Recognized Gestures from Test Subject #2
Gesture Metric of Similarity Recorded Gesture SimilarityMetric of Recorded Gesture SimilarityMetric of Recorded Gesture
A 26.60 A 39.03 A 29.07 A B 73.74 B 83.29 4 42.47 B C 64.42 C 87.79 C 38.38 C D 56.30 D 63.79 D 47.45 1 E 81.11 S 85.78 S 81.11 S F 107.62 F 138.37 F 60.30 F G 61.03 D 55.06 D 77.38 X H 59.76 R 60.14 U 54.00 R I 80.06 I 101.46 I 51.46 I K 81.86 K 90.56 K 81.88 K L 70.63 L 94.12 L 50.46 L M 100.43 I 96.42 I 116.05 I N 81.11 N 89.52 O 74.84 N O 75.66 S 76.50 S 82.04 S R 114.64 R 125.78 U 97.02 R S 62.98 S 71.51 S 58.54 S T 65.14 O 80.14 O 49.41 O U 90.49 V 99.12 V 86.10 R V 73.30 V 82.70 V 80.68 V W 71.43 W 83.53 W 76.21 W X 70.79 X 78.24 X 72.19 X Y 79.93 Y 107.40 Y 41.29 Y 1 71.20 1 83.39 1 68.02 1 3 84.87 3 114.11 3 53.47 3 4 100.76 4 130.92 4 53.93 4 5 74.50 5 104.91 5 50.78 5 7 81.81 7 104.18 7 60.42 7 8 96.59 8 118.59 8 75.84 8 10 93.41 10 113.86 10 63.46 10
42
Table A3: Recognized Gestures from Test Subject #3
Gesture SimilarityMetric of Recorded Gesture SimilarityMetric of Recorded Gesture SimilarityMetric of Recorded Gesture
A 66.87 A 67.75 A 69.91 A B 103.07 4 104.58 4 88.43 B C 44.64 C 44.20 C 62.65 C D 96.88 D 97.71 D 96.48 1 E 31.72 E 28.33 E 57.51 E F 62.25 F 67.22 F 61.80 F G 47.82 G 51.46 G 44.08 G H 61.23 H 62.40 H 67.37 H I 101.73 I 104.02 I 99.71 I K 105.50 K 101.43 K 113.23 G L 46.46 L 47.82 L 62.61 L M 107.49 N 105.57 N 115.43 S N 94.39 T 92.72 T 98.86 S O 114.23 S 113.84 S 118.78 S R 107.85 H 108.72 H 110.49 H S 58.37 S 56.58 S 70.47 S T 77.30 T 74.59 T 91.15 S U 30.08 U 32.47 U 41.63 R V 36.65 V 40.86 V 47.81 V W 67.33 W 74.71 W 53.33 W X 86.33 X 83.55 X 102.19 X Y 60.11 Y 63.34 Y 64.54 Y 1 108.42 1 112.61 1 98.81 1 3 41.65 3 36.06 3 79.60 3 4 61.76 4 66.50 4 61.37 4 5 62.29 5 64.62 5 78.80 5 7 83.22 7 92.47 7 53.77 7 8 52.65 8 51.95 8 73.75 8 10 42.67 10 44.40 10 49.44 10
43
Table A4: Recognized Gestures from Test Subject #4
Gesture SimilarityMetric of Recorded Gesture SimilarityMetric of Recorded Gesture SimilarityMetric of Recorded Gesture
A 55.01 A 58.73 A 73.48 S B 107.15 4 112.28 4 27.01 B C 75.52 C 86.20 C 77.49 B D 79.64 D 87.27 D 90.32 X E 83.37 O 85.56 E 53.75 O F 215.88 F 234.48 F 91.15 F G 127.39 K 134.95 D 55.56 G H 139.08 R 146.72 U 105.66 H I 80.17 I 81.46 I 114.11 S K 79.62 V 85.68 V 65.73 H L 144.00 L 158.95 L 83.09 L M 113.74 N 117.73 N 110.53 S N 95.56 O 101.45 O 66.24 N O 84.14 O 90.94 O 79.30 O R 140.25 V 155.00 V 45.14 U S 83.01 S 85.88 S 95.46 S T 73.92 T 78.09 T 78.91 S U 197.75 V 212.92 V 100.40 U V 212.12 V 229.75 V 94.75 V W 88.19 W 102.91 W 75.92 W X 75.78 D 80.12 D 100.37 X Y 84.96 Y 98.43 Y 76.30 Y 1 93.77 1 105.14 1 72.06 1 3 126.24 3 123.01 3 124.02 3 4 141.89 4 158.21 4 64.59 4 5 121.24 5 128.97 5 92.59 5 7 138.66 7 151.80 7 96.82 7 8 99.94 8 106.56 8 133.02 8 10 41.23 10 49.88 10 71.13 10
44
Table A5: Recognized Gestures from Test Subject #5
Gesture SimilarityMetric of Recorded Gesture SimilarityMetric of Recorded Gesture SimilarityMetric of Recorded Gesture
A 53.60 A 71.87 A 49.75 A B 113.43 C 128.73 4 60.36 B C 53.69 C 84.71 C 52.45 C D 62.40 D 87.05 D 67.60 D E 41.57 E 62.85 E 64.58 E F 80.33 F 115.58 F 64.61 F G 111.48 1 123.80 1 67.96 G H 87.75 V 118.76 V 56.94 U I 88.42 I 106.21 I 86.86 I K 96.87 U 108.97 U 83.42 H L 76.29 L 114.75 L 46.56 L M 114.94 N 128.27 O 95.16 N N 104.76 H 105.53 H 126.73 H O 64.65 O 70.81 O 73.11 S R 134.71 7 144.03 7 109.34 H S 69.80 O 77.15 O 53.23 S T 82.57 T 96.33 G 61.39 T U 94.31 V 114.77 V 70.93 R V 92.34 V 134.61 V 24.02 V W 130.64 W 174.34 W 53.41 W X 63.46 X 89.76 X 45.06 X Y 91.29 Y 126.39 Y 58.19 Y 1 92.40 1 114.67 1 82.71 1 3 60.03 3 85.63 3 96.41 3 4 91.58 4 126.52 4 65.52 4 5 75.11 5 101.55 5 108.43 5 7 56.52 7 81.10 7 78.80 7 8 91.72 8 106.88 8 113.66 8 10 43.23 10 62.72 10 56.72 10
45
Table A6: Recognized Gestures from Test Subject #6
Gesture Metric of
Similarity Recorded Gesture SimilarityMetric of Recorded Gesture SimilarityMetric of Recorded Gesture
A 54.50 A 57.01 A 65.59 A B 76.11 4 70.83 B 56.18 B C 47.42 E 46.94 E 52.94 E D 71.37 D 76.61 D 86.24 X E 39.16 E 44.67 E 61.45 E F 71.86 F 79.78 F 101.29 F G 88.37 G 89.87 G 95.90 G H 57.78 H 63.08 H 78.02 H I 75.60 I 79.58 I 91.77 I K 88.03 K 88.91 K 78.82 H L 52.02 L 59.39 L 80.48 L M 79.01 S 80.31 S 85.36 S N 49.93 N 51.69 N 59.08 N O 64.28 O 65.20 S 67.72 S R 56.56 R 56.08 R 61.60 R S 48.19 S 52.97 S 65.55 S T 48.11 S 48.37 S 52.55 S U 50.70 R 51.49 R 60.13 R V 48.82 V 55.28 V 65.91 R W 52.75 W 58.98 W 78.48 W X 77.23 G 77.02 G 79.78 G Y 58.65 Y 63.67 Y 80.26 Y 1 83.72 X 84.70 X 90.10 X 3 64.85 3 71.46 3 92.53 3 4 53.16 4 56.05 4 70.17 4 5 57.06 5 63.94 5 87.33 5 7 49.79 7 55.41 7 73.77 7 8 91.45 8 98.05 8 116.68 8 10 52.21 10 53.84 10 62.05 10
46
Table A7: Recognized Gestures from Test Subject #7
Gesture SimilarityMetric of Recorded Gesture SimilarityMetric of Recorded Gesture SimilarityMetric of Recorded Gesture
A 54.50 A 57.01 A 65.59 A B 76.11 4 70.83 B 56.18 B C 47.42 E 46.94 E 52.94 E D 71.37 D 76.61 D 86.24 X E 39.16 E 44.67 E 61.45 E F 71.86 F 79.78 F 101.29 F G 88.37 G 89.87 G 95.90 G H 57.78 H 63.08 H 78.02 H I 75.60 I 79.58 I 91.77 I K 88.03 K 88.91 K 78.82 K L 52.02 L 59.39 L 80.48 L M 79.01 S 80.31 S 85.36 S N 49.93 N 51.69 N 59.08 N O 64.28 O 65.20 S 67.72 S R 56.56 R 56.08 R 61.60 R S 48.19 S 52.97 S 65.55 S T 48.11 S 48.37 S 52.55 S U 50.70 R 51.49 R 60.13 R V 48.82 V 55.28 V 65.91 R W 52.75 W 58.98 W 78.48 W X 77.23 G 77.02 G 79.78 G Y 58.65 Y 63.67 Y 80.26 Y 1 83.72 X 84.70 X 90.10 X 3 64.85 3 71.46 3 92.53 3 4 53.16 4 56.05 4 70.17 4 5 57.06 5 63.94 5 87.33 5 7 49.79 7 55.41 7 73.77 7 8 91.45 8 98.05 8 116.68 8 10 52.21 10 53.84 10 62.05 10
![Figure 2.1: Context in Sign Language [3]](https://thumb-us.123doks.com/thumbv2/123dok_us/1384232.2685440/10.918.228.664.109.518/figure-context-in-sign-language.webp)
![Figure 2.2: Hand Hierarchy [9]](https://thumb-us.123doks.com/thumbv2/123dok_us/1384232.2685440/14.918.249.673.114.543/figure-hand-hierarchy.webp)
![Figure 2.3: Leap Motion Controller Axes [9]](https://thumb-us.123doks.com/thumbv2/123dok_us/1384232.2685440/15.918.206.710.240.534/figure-leap-motion-controller-axes.webp)