Louisiana State University
LSU Digital Commons
LSU Master's Theses Graduate School
2013
Deflection based condition assessment for Rolling
Wheel Deflectometer at network level
Karthik Venkatesh Dasari
Louisiana State University and Agricultural and Mechanical College
Follow this and additional works at:https://digitalcommons.lsu.edu/gradschool_theses Part of theCivil and Environmental Engineering Commons
This Thesis is brought to you for free and open access by the Graduate School at LSU Digital Commons. It has been accepted for inclusion in LSU Master's Theses by an authorized graduate school editor of LSU Digital Commons. For more information, please [email protected].
Recommended Citation
Dasari, Karthik Venkatesh, "Deflection based condition assessment for Rolling Wheel Deflectometer at network level" (2013).LSU Master's Theses. 751.
DEFLECTION BASED CONDITION ASSESSMENT FOR ROLLING WHEEL
DEFLECTOMETER AT NETWORK LEVEL
A Thesis
Submitted to the Graduate Faculty of the Louisiana State University and Agricultural and Mechanical College
in partial fulfillment of the requirements for the degree of Master of Science in Civil Engineering
in
The Department of Civil and Environmental Engineering
by
Karthik V Dasari
B.Tech, JNTU Hyderabad, India, 2008 August 2013
ii
ACKNOWLEDGEMENTS
I would like to express my deep gratitude and sincere appreciation to my advisor, Dr. Mostafa Elseifi for his valuable guidance, encouragement, and commitments to complete this thesis. His continuous support throughout my master studies is greatly appreciated. I also wish to thank my academic committee advisors, Prof. Louay N. Mohammad and Dr. Hak-Chul Shin for their cooperation, guidance, and patience. I also wish to thank the Louisiana Transportation Research Center (LTRC) for providing me with state-of-the-art research facilities. Finally, I would like to thank my friends and fellow students Ahmed Abdel-Khalek, Rakesh Bandaru, Hao Ying, Saman Salari, and David Osborn.
iii
TABLE OF CONTENTS
ACKNOWLEDGEMENTS ... ii ABSTRACT ... v 1. INTRODUCTION ... 1 1.1 Research Objectives ... 2 1.2 Research Approach ... 2 1.2.1 Literature Review... 21.2.2 Analysis and Review of RWD and Core Data ... 2
1.2.3 Integration of Pavement Condition Index (PCI) values ... 3
1.2.4 Final Analysis and Development of the Assessment Tool ... 3
1.3 Scope of Study ... 3
2. LITERATURE REVIEW ... 4
2.1 Pavement Management System (PMS) ... 4
2.1.1 Network Level and Project Level PMS ... 5
2.1.2 LADOTD PMS ... 6
2.1.3 Pavement Distresses... 8
2.2 Pavement Conditions Evaluation ... 9
2.2.1 Non Destructive Testing ... 9
2.2.2 Falling Weight Deflectometer (FWD) ... 11
2.2.3 Rolling Wheel Deflectometer ... 12
2.2.4 Difference between RWD and FWD Devices ... 17
2.2.5 Ground Penetrating Radar - GPR ... 18
2.3 Use of Pavement Deflection in Pavement Management Systems at Network Level ... 18
2.3.1 Use of FWD for Structural Assessment ... 18
2.3.2 Use of FWD at the Network Level ... 20
2.3.3 Use of RWD for Structural Assessment ... 23
2.3.4 Use of RWD at the Network Level ... 23
3. EFFECTS OF PAVEMENT CONDITIONS ON EFFECTIVE STRUCTURAL NUMBER OF IN-SERVICE PAVEMENTS ... 25
3.1 Abstract ... 25
3.2 Introduction ... 25
3.3 Background ... 27
3.3.1 Structural Evaluation Using FWD ... 27
3.3.2 The Louisiana Pavement Management System ... 29
3.4 Field testing ... 30
3.4.1 FWD Testing and Thickness Measurements ... 30
3.5 Analysis and Results ... 31
3.5.1 Statistical Analysis ... 31
3.5.2 Structural Number (SN) versus Pavement Distresses ... 33
iv
4. DEVELOPMENT OF THE TRIANGULAR MODEL FOR PAVEMENT EVALUATION
USING THE ROLLING WHEEL DEFLECTOMETER ... 37
4.1 Development of the Triangular Model ... 37
4.2 Description and working of the Triangular Model ... 38
4.3 Applications of the Triangular Model ... 40
5. CONCLUSIONS ... 42
6. RECOMMENDATIONS... 43
REFERENCES ... 44
APPENDIX ... 46
v
ABSTRACT
The Rolling Wheel Deflectometer (RWD) is capable of measuring pavement deflection at high speeds without traffic interruption or compromising safety along tested road segments. To optimize the use of RWD at the network level, an assessment tool is needed to incorporate RWD data into current Pavement Management System (PMS) and to identify pavements in need of maintenance or rehabilitation. The objective of this study is to present the development of a screening tool, referred to as the pavement assessment triangular model, to predict pavement overall conditions based on RWD deflection, roughness measurements, and surface conditions as described by the Pavement Condition Index (PCI). Formulation of the proposed tool and its application were based on data collected during evaluation and testing of RWD in Louisiana. The relationship among SN, deflections and pavement distresses were also investigated to better understand the screening tool. Based on the analysis presented in this study, the proposed pavement assessment triangular model may be used at the network level to identify deficient pavement sections.
1
1.
INTRODUCTION
Flexible pavements have long been assessed by their structural capacity and by the surface conditions. The practice of determining the structural capacity of in-service pavements by the surface deflection response to a known load is widely recognized as the most effective method. The information of deflection testing at network level would be a great step forward for Pavement Management System (PMS) in identifying structurally-deficient pavements and project prioritization. Pavement surface deflections are currently measured by tools such as Falling weight Deflectometer (FWD), and Rolling Dynamic Deflectometer (RDD). However, very few states such as Idaho and Minnesota use the FWD at network level for project prioritization. The role and use of FWD has been largely limited to project level owing to the time it requires for mobilization and sampling. In addition, FWD does not justify the money spent and the safety threat it possesses to be successful at the network level.
The Rolling Wheel Deflectometer (RWD) developed by Applied Research Associates, Inc. under the sponsorship of FHWA is the latest technology in deflection testing. The RWD’s ability to measure deflections at high speeds without disruption to the traffic makes it an ideal tool to develop a structural capacity screening tool at the network level. While several studies have been conducted to quantify the RWD deflections for structural evaluation at network level, it still continues to be a matter of in-depth research.
With the intention of employing the RWD as a network level tool, the Louisiana Department of Transportation and Development (LADOTD) conducted a comprehensive testing program of the Rolling wheel Deflectometer (RWD) in District 5 of Louisiana. An asphalt road network of about 1,200 miles was tested based on the ARA standard testing protocol. The Louisiana Pavement Management System collects pavement distress data for roughness, cracking, rutting, patching, and faulting. The overall pavement condition is quantified into a composite index known as the Pavement Condition Index (PCI) on a scale from 0 to 100 based on the deduct points coming from all of the distress data.
A deflection matrix developed upon pavement condition and the thickness for the RWD measurements would be an effective tool for pavement management. Such a matrix developed would identify the pavement structural conditions and feasible treatment options. Identifying the
2
effect of performance indicators such as the International Roughness Index (IRI) and cracking on the RWD deflections would help understand the benefits of this emerging technology and would allow assessing the benefits of adding RWD to the current PMS in Louisiana. An effort was also made to incorporate RWD measurements into the existing PMS via Geographic Information System (GIS).
1.1 Research Objectives
The objective of this study is to present the development of a network level tool, referred to as the pavement assessment triangular model, to predict pavement overall conditions based on RWD deflection, roughness measurements, and surface conditions as described by the Pavement Condition Index (PCI). Formulation of the proposed methodology and its validation were based on data collected during evaluation and testing of RWD in Louisiana. RWD deflection measurements were incorporated into the existing Pavement management system (PMS) via Geographic Information System (GIS) for geographic and graphical representation of the structural condition of the pavements.
1.2 Research Approach
The aforementioned objectives were achieved through a work plan divided into the following tasks.
1.2.1 Literature Review
A comprehensive literature review was conducted to study the previous efforts made in using pavement deflections as a network level tool to identify the structural capacity of the pavements. Background studies made on the working of RWD and its employment at network level tool was carefully looked into. The procedure and success of the methods employed by different states in implementing FWD at network level were also reviewed.
1.2.2 Analysis and Review of RWD and Core Data
The temperature corrected average deflections were measured for every 0.1 mile of the control section. The network level deflection data across district 5 was then analyzed for pavement type and thickness. Core logs taken approximately every 5 miles helped determine the thickness of
3
the pavement along with the GPR reading. Finally, the control sections are the subdivided based on the uniformity of thickness.
1.2.3 Integration of Pavement Condition Index (PCI) values
The pavement condition index values were obtained from the Content manager of the Pavement Management Systems (PMS) of the LADOTD. The PCI values were then integrated with the respective control section and concerning logmiles.
1.2.4 Final Analysis and Development of the Assessment Tool
All the concerned sections were sorted into pavement families with respect to their pavement thickness. Similarly, pavement condition of the sections were sorted to Good, Fair, Poor. The triangular assessment model was then developed to utilize RWD-predicted structural capacity in coordination with IRI and PCI data to provide an overall evaluation of pavement conditions.
1.3 Scope of Study
The study provides an opportunity to determine the threshold values of the RWD deflections for pavements of varying thickness. Structural Number (SN) obtained from the FWD was used as a reference in determining the threshold values. In addition, pavement distresses such as fatigue, rut, longitudinal and transverse cracking along with IRI and PCI were used as variables to enhance the decision-making process. A graphical model was developed to determine the structural capacity based on RWD, IRI and PCI. The study also improved the incorporation of the RWD and structural data into PMS via GIS.
In this thesis, a paper-format was used in which each chapter is considered a standalone work with minimal references to other parts of the study. This format hypothesizes that a technical paper will result or has resulted from each chapter; therefore, each chapter possesses its own conclusions and references. An effort was, therefore, made to include in each chapter the necessary background, with special care to avoid redundancy. General background related to this study is presented in Chapter 2.
4
2.
LITERATURE REVIEW
2.1 Pavement Management System (PMS)
“Pavement management system is a systematic process that provides, analyses and summarizes pavement information for use in selecting and implementing cost effective pavement construction, rehabilitation, and maintenance programs” (ISTEA 1991). An effective PMS would minimize costs and maximize benefits and safety. The common features of a PMS are:
1. Database – Database is the inventory, which contains the control sections numbers, project locations, date of construction, and the type of pavement. All the pavement distress information such as PCI, IRI, rutting etc. and structural strength of the pavements are added to the corresponding control sections. Database also consists of the maintenance and rehabilitation strategies expected to be employed with respect to the distress information.
2. Analysis tools – Pavement’s future performance is analyzed for the remaining service life by the performance models of the corresponding pavement family. The maintenance and rehabilitation costs are accessed in the long-term to establish a life cycle cost analysis. Projects are prioritized based on the required needs and the available budget. A work plan is then assigned based on the aforementioned analysis.
3. Performance monitoring – the implemented work plan is updated to the inventory. The updated inventory not only monitors the progress of the control sections but also checks the credibility of the performance models.
The entire procedure is achieved through various surveys, reports, computing and graphical interfaces. Total Infrastructure Management System (dTIMS) software is used by the LADOTD to analyze the pavement condition data and to model the pavement rate of deterioration. The condition data are then computed to an index scale from 0 to 100, where 100 being the pavement with no distress. Indices for roughness, rutting, patching, alligator cracking, transverse cracking, longitudinal cracking, random cracking, transverse and longitudinal cracking in flexible pavements are calculated. Threshold values have been established by LADOTD for each distress index to trigger a certain type or types of maintenance or rehabilitation process. Distress data are reported in 1/10th mile segments (Khattak 2008). It should be noted that, for flexible pavements, the longitudinal and transverse cracking are added
5
together and called as random cracking. The index calculated from such system does not accurately represent the condition of the pavement. Since the cause of failure for both the cracking types is completely different from each other, such a system may lead to selecting inadequate treatment that is not based on the cause of failure. Prioritizing pavements solely on the basis of distress indices is not recommended considering the design life, rehabilitation, and rate of deterioration (Khattak 2009).
2.1.1 Network Level and Project Level PMS
Pavement management is essentially developed at two levels Network level and Project level. They are differed by the level of details, purpose of information and organization (AASHTO 2001). A network or system level approach is processing aggregate data to define an overall policy or decision models. Network level data consists of locations, inventory, traffic and pavement condition and would address deficiencies, maintenance strategies, lifecycle cost analysis and priorities. Network level strategies are complex and flexible in nature but are only as good as the accuracy and consistency of the inputs. Understanding the sensitivity, calibration and assumptions of network level models is essential to its success (NCHRP Synthesis 401, 2009).
Network-level data collection involves collection of large quantities of pavement condition data, which is often converted to individual condition indices or aggregated into composite condition indices (NCHRP Synthesis 401, 2009). Network level data is generally collected using automated machines for scanning and imaging at high speeds and/or windshield surveys. This process does not involve disruption of traffic and expertise. The information at network level is used to assess the overall condition of the network of roads. The network level data assists the decision makers in regards to the overall policies adopted. The policies include the maintenance and rehabilitation strategies for variable budgets for the entire network over a period of time.
Project level or section level data is detailed information about the materials, properties, usage and design. Project level data is generally used as assistance with the design of the most cost-effective treatments for the specific sections/facilities identified as needing attention. Uncertainties regarding the inputs are eliminated at this level.
6
At the project level, individual distress and its severity are identified and collected more specifically. Measurements taken at this level are significant as the specific information about the frictional and structural capacity is needed to determine specific maintenance and rehabilitation action for individual pavement projects. This level of information is essential in the design or preservation treatment selection decision trees. Technical expertise is required at this stage of data collection as it often includes walking surveys, core collection and distress identification. Structural capacity evaluation is performed at the project level to determine the current state and as input to decision making soft wares. Project level data collection is a slow process that involves high cost, traffic disruption and expert presence. According to NCHRP synthesis, approximately half of the agencies (49%) indicted that the data collected are being used to control pavement warranties, performance-based contracts, and or other types of public private partnerships.
2.1.2 LADOTD PMS
Louisiana has the 32nd largest highway network in the nation with over 60,000 center lane miles. (Khattak 2008).The PMS has categorized the highway system into four
1. Interstate Highway system (IHS) 2. National Highway system (NHS) 3. State Highway system (SHS) 4. Regional Highway system (RHS)
Locations of the pavements are referenced by three systems of Control sections Logmile (CSL), Route Mile Posts (RMP) and the Global Positioning system (GPS).
The control section Logmile (CSL) reference system sorts roads by the route number sequence and its direction within the state. The CSL are defined by the Annual Average Daily Traffic (AADT), pavement type, lane width, number of lanes, shoulder type, shoulder width and subsurface material. Each control section has one mile increments called as logmile. Distress data collected by the ARAN are referenced by the Global Positioning systems (GPS). All three of the reference systems are linked by LADOTD software which enables conversion from one another. (Khattak 2008)
7
The Louisiana department of Transportation and Development (LADOTD) surveys the entire pavement network once every two years. The LADOTD collects distress data of roughness, rutting, cracking, patching and faulting data with the help of the Automatic Road Analyzer (ARAN) system. The ARAN continuously acquires and reports high definition digital images every 1/10th of a mile based on CSL but is originally equipped with a GPS unit. Pavement condition data are collected in both directions Primary (South to north, west to east) and secondary (north to south, east to west). (Khattak 2008)
Total Infrastructure Management software (dTIMS) software is used by the LADOTD to analyze the pavement condition data into index models based on a scale from 0 to 100. Indices are calculated for all distress data of roughness, rutting, patching, alligator cracking, transverse cracking, longitudinal cracking and random cracking. Points are deducted for each index by the extent and the severity levels of low, medium and high. Also, threshold values are defined for each index which determines the maintenance and rehabilitation techniques to be employed. (Khattak 2008)
Pavement Condition Index
In Louisiana, pavement distress data every 1/10th of mile is analyzed to calculate an index called the Pavement Condition Index (PCI) on a scale from zero to 100. The PCI varies from 95 to 100, 85 to 94, 65 to 84, 50 to 64, and 49 or less for very good, good, fair, poor, and very poor roads, respectively. For flexible pavements, the PCI is calculated as follows:
P I MA { MI (R DM, A R, PT , R , R T) A (R DM, A R, PT , R , R T) – . STD (R DM, A R, PT , R , R T) (1) Where,
RNDM = random cracking index expressed in a scale from 0 to 100 with 100 representing the case with no random cracking,
ALCR = alligator cracking index expressed in a scale from 0 to 100 with 100 representing the case with no fatigue cracking,
8
PTCH = patch index expressed in a scale from 0 to 100 with 100 representing the case with no patch,
RUFF = roughness index expressed in a scale from 0 to 100 with 100 representing the case with a smooth pavement (IRI (in/mile) = (100 - RUFF) * 5 + 50,
RUT = rutting index expressed in a scale from 0 to 100 with 100 representing the case with no rutting, and
STD = standard deviation. 2.1.3 Pavement Distresses
Smoothness: Pavement smoothness is typically considered the pavement condition indicator that best reflects the public’s perception of the overall condition of a pavement section. It affects ride quality, operation cost in terms of fuel consumption, tire wear, vehicle durability and vehicle dynamics. Smoothness is computed by measuring the vertical deviations of the road surface along a longitudinal line of travel in the wheel path, which is known as the “profile.” The profile is typically determined using laser-based measuring systems. These profilers measure the pavement profile directly using lasers to record the distance from the vehicle to the pavement and accelerometers to record the vertical movement of the vehicle. The profile is used in a simulation model to compute the IRI. The IRI is a summary measurement of the profile elevation changes of a roadway that represent the accumulated vertical movement of a “standard” vehicle traveling on the measuring profile. ASTM E1926, omputing International Roughness Index from Longitudinal Profile Measurements is standard procedure to measure the IRI. Although the IRI is fast becoming the standard to directly measure ride quality, there is a lack of standardization among transportation agencies in collecting the data.
The main factors that affect variability of smoothness measurements include the type of profiler, Profile operation, Profile data interpretation and processing. Profilers commercially available use different technologies, sensors, and signal processing techniques.
Cracking: One of the major distresses that directly affect the serviceability and quality of flexible pavement structures is cracking (Elseifi et al. 2012). Cracking appears at the pavement surface as longitudinal cracks, transverse cracks, and a combination of both that extend over the width of
9
the pavement and creates hazardous conditions for the road users. Water infiltration through the cracks may subsequently cause weakening and deterioration of the base and/or subgrade. Cracking is also the main cause of many pavement distresses (e.g., stripping in hot-mix asphalt [HMA] layers, loss of subgrade support, etc.). The rehabilitation of pavement damage caused by cracking failure is usually costly. Therefore, it has been suggested that cracking, especially fatigue cracking, should be primarily addressed by adequate mixture and pavement design procedures as well as proper construction practices.
Rutting: Rutting is a distortion failure mechanism in flexible pavements that is associated with insufficient subgrade strength or poorly-constructed asphalt mixtures (Kim et al. 2013). A small amount of rutting is usually expected due to the densification of asphalt layers under traffic right after construction. However, large rutting is a risk to the driving public and is due unstable asphalt mixtures (low air voids) or sub-layers, Figure 1.
Figure 1. Rutting failure in flexible pavements.
2.2 Pavement Conditions Evaluation
2.2.1 Non Destructive Testing
Non-destructive testing (NDT) is widely used due to its obvious advantages of being non-destructive and being able to stimulate real stress conditions on in-service pavements. In addition to these advantages, NDT methods are low cost and less time consuming. Deflection-based measuring equipment, Ground penetrating radar, Infrared thermography are few of the non-destructive evaluation techniques. Non-non-destructive evaluation methods also include vibration, seismic and ultrasound techniques. Deflection-based equipment’s vary by the type of loading.
10
Static and slow moving loading are used in the Benkelman beam and the Lacroix deflectograph. Steady state vibration is used in the Dynaflect. Impulse load response devices are currently the most common structural evaluation tools. These devices include the Falling Weight Deflectometer (FWD).
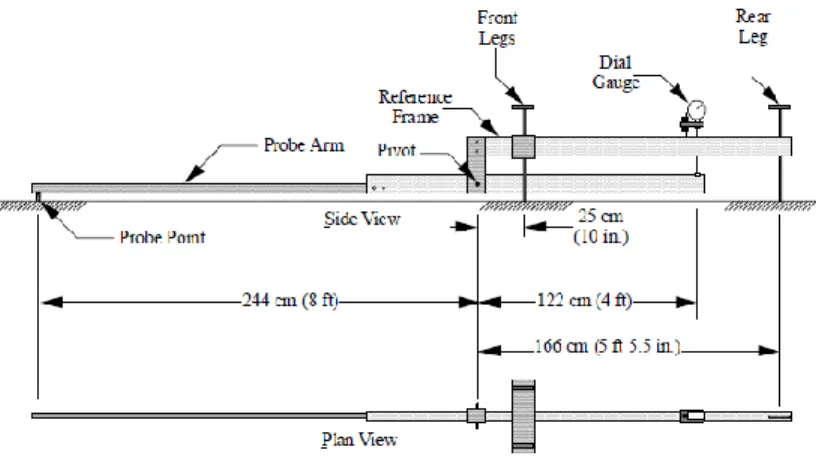
The Benkelman Beam: The Benkelman beam was introduced in the early 1950s during the Western Association of State Highway Organizations (WASHO) Road Test and consists of a support beam and a probe arm (Carneiro 1966). The device frame is provided by an arm that is 8 ft. long and that is extended to a probe point. The probe arm is equipped with a gauge at 4 ft. behind the pivot to measure the relative vertical distance between the pivot arm and the frame, Figure 2. During the testing procedure, the probe is placed between the dual tires of a loaded truck. The truck is placed such that one of the rear dual wheels is positioned on the point of measurement. The probe is placed between the two wheels to measure surface deflection, which equals to double the difference between the final and initial readings. In order to maintain a high level of accuracy for the collected data, it is preferable to limit the measurements to be within the deflected region of the pavement, which occurs within a radius of 8 ft. around the loading point. (Elseifi et al, 2012)
A major limitation of the Benkelman beam is the inability to determine the entire deflection basin and to avoid the front support interference with the deflection basin. Also, it was found that the Benkelman beam is unable to measure the deflection resulting from thick rigid
11
pavements. As a solution to this problem, two or more beams should be used to conduct the test. Simplicity and low cost are major advantages of this type of deflection testing with a daily production of 50,100 test points using a crew of three technicians (Elseifi et al, 2012).
2.2.2 Falling Weight Deflectometer (FWD)
The falling weight Deflectometer is a non-destructive testing device used to measure pavement deflections. FWD applies a stationary dynamic load which is similar in magnitude and duration to a single heavy wheel load, Figure 3. The load pulse generated by dropping a weight is transmitted to the pavement through a 300mm diameter circular load plate (LTTP Manual). A deflection basin is then obtained by the shape of the deformation of the pavement surface. The FWD creates a deflection basin using the deflection sensors (geophones) placed at radial offsets from the center of the load. The stiffness of the pavement layers are then obtained by various computational methods such as the backcalculation and Forward Calculation.
12
The data is also used to calculate the load transfer efficiency and quality control assurance (NCHRP, FWD). The FWD has two devices distance measurement instrument (DMI) and a temperature sensor for the effective measurement of distance and temperature respectively (LTTP Manual).
The geophone locations for a 9 sensor WD’s are mm, 2 3mm, 3 mm, 4 7mm, 610mm, 914mm, 1219mm, 1524mm and -305mm. The LTPP defines 4 target level loads (26.7 kN, 40.0 kN, 53.4 kN and 71.2 kN) with a ± 10% acceptable range. Test plans are configured by the pavement type according to the LTPP FWD Measurements Manual. The dynatest 8000 FWD can generate 26.7 kN(6 kips) to 71.2 kN(16 kips) loads. The data is obtained in the PDDX, a FWD standard file format, which can be further analyzed using software packages AASHTO DARwin, Dynatest Elmod, Evercalc etc. FWD data has also been used in applications such as data collection and analysis refinement, Project acceptance and evaluation, Pavement rehabilitation and overlay, Pavement management systems, load transfer efficiency, and void detection, non-resilient pavement layer behavior. Integration of FWD with Ground Penetrating Radar (GPR) is a commonly used technique at network level.
2.2.3 Rolling Wheel Deflectometer
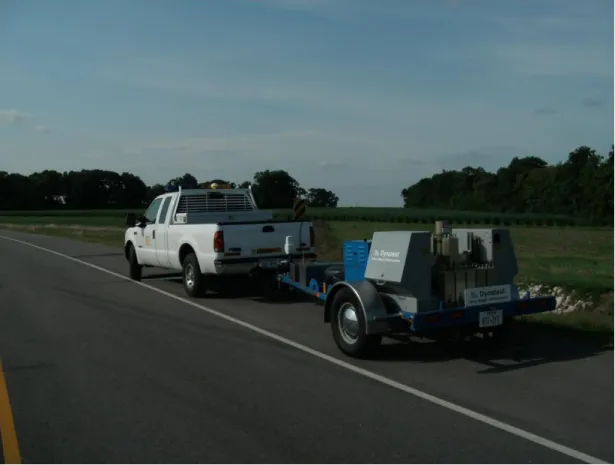
The Rolling wheel Deflectometer (RWD) is a pioneer device for cost-effective measurements of pavement deflection and surface properties. The most recent version of the RWD was developed by ARA in collaboration with FHWA Office of Asset Management. It consists of a 53-ft. long semitrailer applying a standard 18,000-lb. load on the pavement structure by means of a regular dual-tire assembly over the rear single axle (Steele et al. 2009). A general view of the 53-ft. custom designed RWD trailer is shown in Figure 4. The trailer is specifically designed to be long enough to separate the deflection basin, due to the 18-kip rear axle load from the effect of the front axle load. In addition, the trailer can accommodate the aluminum beam so that the laser range needed to tolerate any bouncing of the trailer during operation could be minimized.
The latest version of the RWD, which was introduced in 2003, can collect deflections at traffic speeds. Several modifications and upgrades were introduced to the RWD with respect to the laser sensors, data acquisition system, and software. The laser collection system was moved
13
Beam deflection system cooling and loading system Figure 4. General overview of the rolling wheel deflection system
between the tires, and a new procedure was introduced for laser calibration. The laser sensors are set to collect a reading at a fixed interval of 0.6 in. at all truck speeds. Prior to the field testing program described in this study, a more accurate and stable deflection measurement system customized for pavement applications was installed. The upgraded system has a 4-in. measurement deflection range and has an accuracy of ± 0.001 in. This study was the first testing program conducted with the new and improved laser deflection system. In the new system, four Selcom Model SLS 6000 laser triangulation sensors are mounted at approximately 3.6 ft. above
14
the roadway surface with a 4-in. measurement range. The laser sensors work simultaneously to determine pavement deflections under the wheel load, with one sensor placed between the dual tires to determine the maximum deflection (Figure 5). Two additional sensors are placed in front of the wheels to measure a secondary pavement deflection.
Figure 5. Laser sensors placed between the dual tires
Methodology of RWD: The measurement methodology is based on shifting deflection profile of the spatially coincident points from the laser measurements. As shown in Figure 6 Four lasers A, B, C and D placed 8ft apart are used to measure the deflections with the fourth laser D placed near the center of the dual tires. At a time t =0, lasers A, B and C measure the deflection profile for a specified point on the pavement. When the RWD travels 8ft, the time now t = t 1, the profile is now defined by measurements at lasers B, C and D.
The Deflection at a single point under the sensor D is then measured by
[( ) ( )] (2) Where,
= laser readings at A, B and C at time t=0,
15
Figure 6. Deflection by difference in profiles of loaded and unloaded state
Operation of RWD: The RWD is capable of applying a single axle load from 18,000 to 24,000 lbs. The trailer of RWD is manufactured with a heavy duty suspension to restrict the relative movement and vibration to the aluminum beam as low as possible. RWD is a relatively long trailer at 53 ft. compared to other deflection measuring devices. The long length of trailer allows for a long beam which would provide sufficiently spacing between lasers to minimize the bouncing from the front to rear of trailer. The aluminum support beam measuring 2 in x 8.5 in is custom built to provide the required rigidity. The laser D is 10.9 in forward from the center line of the rear axle. As previously mentioned, the four laser used are 16 kHZ LMI selcom spot lasers capable to collecting a sample every 0.48 in when operating at a speed of 55 mph, Figure 7. The lasers have a resolution of 18 microns and accuracy within 0.2 percentage. Data
–
–
-
16
acquisition and analysis is conducted with the help of a Pentium III desktop computer located inside the RWD trailer. The software onboard, developed by ARA, has powers for the lasers, generates output files, and stores the files on the computer hard drive. The laser readings are referenced longitudinally by monitoring the ABS tone counter that is part of the rear axle braking system. Pavement surface temperature is measured with the help of a Raytek infrared thermometer. Accelerometers are used to monitor aluminum beam movements.
Figure 7. lasers placed on the aluminum beam on RWD
In the tests conducted by ARA, it was determined that multiple RWD passes made on several days for the same section produced reasonable results. The RWD was able to detect changes in pavement stiffness due to temperature changes between different days and at different times on the same day. The RWD results compared well with deflections obtained from an accelerometer embedded in the AC layer at the time of testing. The RWD results compared less favorably with FWD deflections. However, the early version of RWD prototype was physically limited from being able to measure deflections directly at the axle centerline, between the dual tires. As a matter of precaution, it was reported that the RWD results are sensitive to driver habits such as maintaining uniform speed and minimizing sudden steering corrections, pavement texture, and roughness, unlike FWD-measured deflections.
17 2.2.4 Difference between RWD and FWD Devices
The following differences were noted between RWD and FWD testing devices:
RWD applies a vertical and horizontal component of transient load with frequency decreasing with depth while the FWD applies a vertical impulse load with constant frequency with depth.
RWD transmits load through the dual tire assembly in the truck while the FWD transmits load by the single circular plate.
In RWD, the maximum deflection is at a few inches behind the moving wheel as trailing deflection basin is wider than the forward basin. This is because the pavement would not rebound to its original position as quickly as it deflects downwards.
In FWD, the maximum deflection is beneath the load plate, as the load basin created is approximately symmetrical (Steele, Hall, Stubstad, Peekna, & Walker).
In RWD, the deflections vary with the load along with stiffness of the pavement. There is a variation of load to the irregularities on the pavement surface and due to varying roughness.
In FWD, the variations only occur from the stiffness of the pavement, as a fixed weight plate is dropped from the same height. (Steele, Hall, Stubstad, Peekna, & Walker)
18 2.2.5 Ground Penetrating Radar - GPR
GPR device operates by using electromagnetic waves to identify and locate interfaces between layers within the pavement, which in turn allows for determination of layer thicknesses, Figure 8. For GPR to distinguish layer separations, the pavement layers must have different dielectric properties. Additionally, higher frequency waves yield better resolution, whereas lower frequencies allow for further penetration into the pavement, resulting in upper layer profiles being more accurate than those of lower layers. Testing has shown that GPR provides accurate layer thicknesses if calibrated with just a few cores.
2.3 Use of Pavement Deflection in Pavement Management Systems at Network Level
2.3.1 Use of FWD for Structural Assessment
Structural Number (SN) is the most widely used way to assess the present structural capacity of the pavements. Various models have been developed over the years taking into account several factors such as traffic, type of pavements and reaming serviceability. The American Association Of State Highway And Transportatoin Officials (AASHTO) recommends the structural number as a function of layer thickness, layer coefficients, and drainage coefficients.
∑ (3)
Where,
= structural coefficient of layer i,
= thickness of layer i,
drainage coefficient of layer i.
The layer coefficient is a measure of the ability of the unit thickness of a given layer compared to the structural ability of the pavement. Drainage coefficient is the measure of the permeability of the layer. The effective strength of pavement layers is determined using the pavement deflections by a technique called backcalculation. The structural capacity is estimated by various models. ASSHTO has set out guidelines for calculation of structural number and effective modulus.
19
AASHTO Procedure for Structural Number: For in-service pavements, the structural number represents the remaining structural capacity to carry the design load. This definition is described using the AASHTO equation, which is:
SN eff = 0.45*D* (E p)1/3 (4)
Where,
SN eff = effective structural number,
D = total thickness of the pavement layers, and
E p = effective pavement modulus of all layers above the subgrade.
Equation 4 introduces a new variable known as Effective Pavement Modulus, which is calculated from the FWD deflections data as follows:
R {√ ( √ p R) √ ( ) p R } (5) Where,
Ep = effective modulus of all pavement layers above the subgrade (psi)
d0 = deflection measured at the center of the load plate (and adjusted to a standard temperature of 68°F) (in),
q= NDT load plate pressure (psi), a = NDT load plate radius (in),
D = total thickness of pavement layers above the subgrade (in), and MR = subgrade resilient modulus (psi).
The effective subgrade modulus is calculated from deflection away the load: R
( )
( r ) (6)
Where,
MR = back calculated subgrade resilient modulus (psi), P = applied load (psi), and
20
Romanoschi and Metcalf (1999) developed a relation between SN and the FWD deflections for pavements with granular foundation and stabilized foundation layers. The following model was suggested for calculation of the SN:
( ) (7)
A direct method and simple method of YONAPAVE was suggested by Hoffman (2003) for evaluating the structural needs of flexible pavements. YONAPAVE varies from the 1993 AASTHO guide for estimation of Structural Number and subgrade modulus. Equation (6) presents the direct method to calculate the effective SN from the characteristic length and the subgrade modulus of elasticity:
√ (8)
Where,
Characteristic length, in cm,
= subgrade modulus of elasticity, in MPa.
Hoffman used a HOGG deflection-based was used to calculate the area under the deflection basin. The characteristic length was obtained from YONAPAVE algorithms and area of the deflection basin. Algorithms also allowed correction to temperature and meeting of future traffic demands. Though this method provided an opportunity to quantify structural capacity at the network level, its implementation and success remains a matter of research.
2.3.2 Use of FWD at the Network Level
FWD has been used at the network level by very few states such as Indiana, Minnesota. In an effort to implement FWD along with GPR at network level, Indiana has tested out 5 interstate highway sites and a few other state roads (Noureldin 2003). Data was collected from the FWD, GPR, and coring for the Interstate highways along with few other state roadways and routes representative of pavement types and facility types in Indiana. The pavement characteristics of FWD center deflection, moduli of pavement layers, FWD estimated thickness (surface and total), GPR estimated thickness, surface and support layer coefficients, effective structural numbers, remaining service life and coring thickness were the response variables averaged each mile. The GPR reported at network level had instances of not picking up some pavement layers indicating
21
a chance for error. The findings from the paper indicate it is a worthwhile program to employ network level FWD and GPR testing as a baseline on the structural capacities of the in-service pavements. It was concluded that the wealth of information thorough the network level testing is sufficient to use for pavement design, maintenance and management purposes. The research recommended FWD data on 2,200 lane miles annually with three tests per mile for network level evaluation. The study predicted that a 5-year cycle is adequate to cover the entire network. Collection of GPR data along with the pavement management system data such as IRI, pavement condition rating (PCR), rut depth, pavement quality index (PQR) and skid resistance was also recommended. The study also warns the elimination of coring citing inaccurate estimation of layers underneath the HMA.
In Kansas, Hossain et al (Hossain 1999) made an effort to determine the sample percentage mileage at the network level for the FWD. FWD deflection data was collected on full-depth (FDBIT) and partial-depth (PDBIT) asphalt pavements in District 04 of Kansas Department of Transportation (KDOT). Ten tests per mile were performed on the outer wheel path by the Dynatest 8000 FWD. Data were also collected on similar condition pavements every year from 1993 to 1996 as part of the etwork Optimization system’s ( OS) long-term rehabilitation program. Pavements were defined as in same condition state by roughness, rutting, transverse cracking, fatigue cracking and/or block cracking. Response variables included temperature corrected first sensor deflection; back-calculated subgrade resilient modulus (Mr) and effective pavement modulus (Ep). The standard AASHTO procedure was employed in calculation of resilient modulus and effective modulus of the pavement. The decrease in structural number was then predicted using the variables of age, cumulative ESAL since the last rehabilitation and thickness of the pavement by statistical analysis by the forward selection method, backward elimination method and stepwise methods. The following models were determined to predict the decrease in SN:
For FDBIT pavements, ( ) (9)
22
The models indicated that a 1 inch overlay on thick asphalt pavements would not have any contribution to the structural number for 20 years and further would only contribute 0.28 to the 20th year of pavement life. Conclusions resulting from the study showed that FWD tests conducted on a three-year interval yield similar statistical responses. A prediction with coverage of 20% mileage with 3 tests per mile is adequate for network level testing.
The Structural Condition Index (SCI) was developed for the Texas Department of transportation (TxDOT) as a tool to identify structurally deficient pavements. In an effort made to implement the concept successfully at the network level, a study was made by Zhang ( Zhang 2003). to determine the minimum FWD testing frequency. SCI is the ratio between the effective and the required structural number (SN). SCI values equal or greater than one indicate structural sufficiency while SCI values less than one indicate structural deficiency for future traffic loadings. Effective structural number was calculated in accordance to a methodology proposed by Rhode. The Rhode methodology concluded that the surface deflection measured at an offset of 1.5 times the pavement thickness entirely belongs to the subgrade of the pavement. The Structural Index of a Pavement (SIP) was defined as the difference in deflection between the peak deflection and a deflection at an offset of 1.5 times the total thickness of the pavement.
SIP = D0 – D1.5 Hp (11)
Where,
SIP = structural index of the pavement,
D0 = peak deflection measured at a standard 9000 lb FWD load,
D1.5 Hp = surface deflection measured at offset of 1.5 times Hp under a standard 9000lb FWD load, and
Hp = total pavement thickness in inches.
The structural number of the pavement was then calculated by the following relationship:
SN = k1 x SIPk2 x Hpk3 (12)
Where,
SN = pavement structural number (in).
SIP = structural index of pavement (microns). Hp = total pavement thickness (mm).
23 k1, k2, k3 = regression of coefficients.
It was concluded that a risk-based method can be employed in determining the sample size to the implementation of the SCI at the network level. The bootstrap method can be used to determine the mean of the standard deviations and to setup a confidence interval. Results indicated a minimum frequency of 3 tests per mile at the network level. A recommendation of 2 tests per half mile was made to improve the reliable FWD data analysis at network level.
2.3.3 Use of RWD for Structural Assessment
In a study named “Estimation of remaining service of flexible pavements from surface deflections”, (Gedafe 2008), Gedafe presented a model for the remaining service life (RSL) based on thickness, transverse cracking, fatigue cracking, rut depth, annual daily traffic, center deflections and SN. Results showed a sigmoidal relationship between RSL and center deflection. Conclusions were reached that RWD deflections could be used to determine the RSL along with the FWD.
2.3.4 Use of RWD at the Network Level
In a study, network level structural evaluation using the Rolling wheel Deflectometer, Gedafe (2008) looked at the possibilities for network level implementation in Kansas. 207 miles of non-interstate road network were tested in Northeast Kansas in July 2006. A comparison was made to the FWD data collected previously on the same roads. Results from the study show that the deflections and the structural numbers from the RWD and the FWD are statistically similar. The study determined a frequency cycle of 4 years without change in structural capacity for the network level assessment.
Vavrik (2008) made an attempt to implement a rolling wheel deflectometer based pavement management system to improve the budgeting, planning and pavement preservation. A detailed plan was edged out to the limited budget available for the Champaign County in Illinois. The PMS implementation approach consisted of network definition, condition assessment, pavement deterioration model development, treatment matrix development, treatment unit costs and identification of the current and enhanced funding levels. The process is furthered by selection and implementation of PMS software for varied budget plans.
24
The condition data of IRI and PCI was used along with the RWD deflection to determine a matrix table, which suggested a possible treatment program for a given deflection and PCI. However, no information was provided on the threshold values adopted for the RWD deflections in the matrix table. Along with condition and traffic data, possible budget scenarios and the costs of the feasible treatments was entered into PMS simulation software. The conclusions and results showed an effective use of RWD deflections at the network level. However, there remains a distant need to understand the threshold limits for the RWD deflection and the condition data. There was also no methodology suggested to measure the reliability on the RWD data.
The Virginia Department of Transportation (VDOT) made an investigation of RWD as a network level pavement structural evaluation tool. Sections of the I-64 and I-81 were tested for both RWD and FWD. According to the research report, the deflections from the RWD were statistically different when repeated on certain sites and were repeatable for some structural conditions. The results also stated that the RWD and FWD are not well correlated to make RWD a suitable tool for network level pre-screen to FWD. Researchers indicated that there is an influence by the surface mixture type on 0.1 mile deflection variations of the RWD. (Diefenderfer 2010).
25
3.
EFFECTS OF PAVEMENT CONDITIONS ON EFFECTIVE
STRUCTURAL NUMBER OF IN-SERVICE PAVEMENTS
13.1 Abstract
Pavement structural number (SN), which is an important property used in the design of new and rehabilitated pavement systems, may be calculated based on Falling Weight Deflectometer (FWD) deflections. The objective of this study is to investigate the relationship between pavement distresses as performance indicators, pavement condition indices, and the effective structural number of in-service pavements calculated from FWD testing. 50 pavement sections were tested in Louisiana using FWD to assess their structural capacity. Pavement performance was assessed in terms of cracking, rutting, and roughness as well as the Pavement Condition Index (PCI) as an overall performance indicator. Based on this analysis, the coefficient of variation (COV) in SN calculations in the 50 pavement sections was very high and ranged from 7 to 70% with an average COV of 28%. Results of the statistical analysis showed that the most influential factors were alligator cracking, AC thickness, and base thickness. In addition, the least influential factor was random cracking. For most of the sections, SN showed good correlation with the performance indices. Further, the structural number of pavements in good condition was statistically greater than pavements in fair and poor conditions. However and for most of the cases, there was no clear cut between pavements in fair and poor conditions for the most of the performance indicators. This may indicate that an abrupt drop in structural capacity does not occur for pavements in their mid-service life until conditions reach a poor condition.
3.2 Introduction
Non-destructive deflection testing is one of the most reliable methods to assess the structural conditions of in-service pavements (Shahin 2005). The Falling Weight Deflectometer (FWD) is widely recognized as an effective tool for pavement structural evaluation. In the FWD test, a stationary dynamic load is applied to the pavement surface and deflections are measured via specially designed deflection sensors with a high level of accuracy. The applied load produces an
1
Dasari, K., Salari, S., Osborn, D., Elseifi, M.A. and Gaspard, K. (2013). Effects of Pavement Conditions on Effective Structural Number of In-Service Pavements , Proceedings of the ASCE T&DI Congress 2013, T&DI Airfield and Highway Pavement Conference, Los Angeles.
26
impact load with duration of 25-30 msec, which corresponds to a wheel velocity of 80 km/hr in the upper layers. Surface deflections are measured and recorded by seven (or more) geophones at various distances from the loading point (Ullidtz 1987).
A number of deflection basin parameters (e.g., radius of curvature, spreadability, deflection ratio, etc.), which are functions of deflection values at one or more sensors, are used to check the structural integrity of in-service pavements. A more sophisticated analysis may also be performed by backcalculating the layer moduli based on the multi-layer elastic theory given the thickness and Poisson’s ratio of each layer (Elseifi, et al. 2011). A recent survey reported that 90% of state highway agencies that collect FWD data conduct a backcalculation procedure to estimate pavement layer moduli (NCHRP Synthesis 2008).
Pavement Structural Number (SN) is a concept that was introduced in the AASHTO Design Guide to describe the ability of a pavement to withstand traffic and environmental loading throughout its service life (AASHTO 1993). In the rehabilitation of existing pavements, the 1993 AASHTO Design Guide provides a method to estimate the effective SN based on FWD deflections. This approach relates the effective SN to the pavement total thickness, the effective modulus of all pavement layers above the subgrade, and the subgrade resilient modulus. Deflections from the FWD test method are also used to estimate the effective pavement modulus and the subgrade resilient modulus. The Federal Highway Administration (FHWA) laid guidelines for using pavement deflections at network level analysis. Performance models were introduced for roughness, rutting and fatigue based on structural performance (Stubstad, et al. 2012).
It is generally recognized that the pavement effective SN provides an accurate representation of the conditions of in-service pavements in terms of cracking, roughness, and rutting as well as the thicknesses of the pavement layers. In general, a high SN would be measured for pavements with greater layer thicknesses and/or with little or low severity surface distresses. However, the relationship between SN and the performance measures of in-service pavements has not been reported in the literature. The objective of this study is to investigate the relationship between pavement distresses as performance indicators (i.e., cracking, roughness, and rutting), pavement condition indices, and the effective structural number of in-service
27
pavements calculated from FWD testing. To achieve this objective, 50 pavement sections were tested in Louisiana using FWD to assess their structural capacity. Pavement performance was assessed in terms of cracking, rutting, and roughness as well as the Pavement Condition Index (PCI) as an overall performance indicator.
3.3 Background
3.3.1 Structural Evaluation Using FWD
FWD applies a stationary dynamic load, which is similar in magnitude and duration to a single heavy wheel load. The load pulse generated by dropping a weight is transmitted to the pavement through a 300 mm diameter circular load plate (Gedafa, et al. 2008). The deflected surface profile, commonly known as deflection basin, is used in various applications including assessing the structural capacity of pavements for design, rehabilitation, and pavement management (NCHRP Synthesis 2008). The AASHTO 1993 design uses the effective structural number to provide a quantification of the remaining structural capacity of the pavement and its ability to carry future traffic loading. It is calculated based on the following equation (AASHTO 1993):
SN effD (E p)1/3 (1)
where,
SN eff = effective structural number,
D = total thickness of the pavement layers, and
E p = effective pavement modulus of all layers above the subgrade.
To estimate the effective pavement modulus based on FWD deflection testing, the following relationship is used (AASHTO 1993):
R {√ ( √ p R) -√ ( ) p R } (2) where,
28
d0 = deflection measured at the center of the load plate adjusted to a standard temperature of 68°F (in),
q= FWD load plate pressure (psi), a = FWD load plate radius (in),
D = total thickness of pavement layers above the subgrade (in), and MR = subgrade resilient modulus (psi).
The subgrade resilient modulus is related to the deflection away from the center of the load based on the following relationship (AASHTO 1993):
( )
( r ) (3)
where,
MR = backcalculated subgrade resilient modulus (psi); P = applied load (psi); and
dr = deflection at a distance r (in) from the load (in).
Evaluation of the AASHTO equation reported that it is lacking accuracy due to the fact that Equations (1) to (3) are based on Burmister’s two layer theory, which assumes infinite linearly elastic subgrade and lays over stiff layers or bedrock (Rohde 1994). To this end, other methods have been suggested in the literature to calculate the effective structural number (SNeff) from FWD deflection data (Romanoschi and Metcalf 1999) (Rohde 1994). For instance, it may be estimated by considering the concept of Structural Index of Pavement (SIP) based on the following relationship (Rohde 1994):
(4)
where,
SIP = structural index of pavement (SIP = d0 – d1.5Hp), d0 = center deflection,
d1.5Hp = deflection measured at an offset of 1.5 times Hp, Hp = total pavement thickness (mm), and
29 3.3.2 The Louisiana Pavement Management System
The Louisiana Department of Transportation and Development (LADOTD) Pavement Management System (PMS) maintains an extensive database that contains pavement distresses and performance data for each state highway. Pavement performance data are available in the LADOTD pavement management system for the period ranging from 1995 to 2009. The PMS data are based on pavement condition measurements that are collected once every two years using the Automatic Road Analyzer (ARAN®) system that provides a continuous assessment of the road network. Conditions of the pavement are assessed using cracking, rutting, roughness, and patching. In addition, video crack surveys are collected once every two years and are available for each state highway in Louisiana. Collected data are reported every 1/10th of a mile and are analyzed to calculate the Pavement Condition Index (PCI) on a scale from zero to 100. The PCI varies from 95 to 100, 85 to 94, 65 to 84, 50 to 64, and 49 or less for very good, good, fair, poor, and very poor roads, respectively. A number of threshold values are also used to trigger a specific course of maintenance and rehabilitation (M&R) actions (Khattak, et al. 2008). For flexible pavements, the PCI is calculated as follows:
P I MA { MI (R DM, A R, PT , R , R T) A (R DM, A R, PT , R , R T) – . STD (R DM, A R, PT , R , R T) (5) where,
RNDM = random cracking index expressed in a scale from 0 to 100 with 100 representing the case with no random cracking,
ALCR = alligator cracking index expressed in a scale from 0 to 100 with 100 representing the case with no fatigue cracking,
PTCH = patch index expressed in a scale from 0 to 100 with 100 representing the case with no patch,
RUFF = roughness index expressed in a scale from 0 to 100 with 100 representing the case with a smooth pavement (IRI (in/mile) = (100 - RUFF) * 5 + 50,
RUT = rutting index expressed in a scale from 0 to 100 with 100 representing the case with no rutting, and
30
3.4 Field testing
3.4.1 FWD Testing and Thickness Measurements
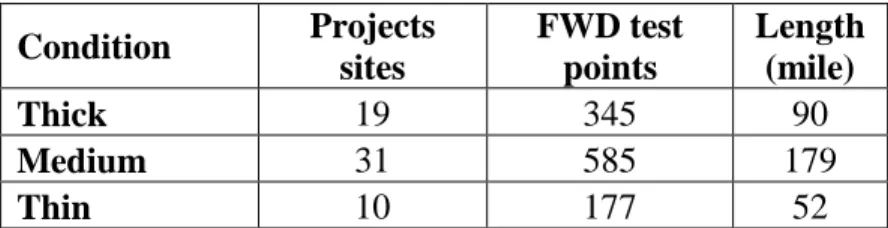
Fifty in-service pavement sections with a total length of approximately 320 miles and located in District 5 of Louisiana were tested, see Table 1. Nondestructive FWD deflection testing was conducted to measure the structural capacity of the pavement layers and subgrade. Deflection testing was performed in accordance with ASTM D 4694, “Standard Test Method for Deflections with a Falling Weight-Type Impulse oad Device” and D 469 , “Standard uide for General Deflection Measurements.” The FWD device was configured to have 9-sensor-array with sensors spaced at 0, 203, 305, 457, 610, 914, 1219, 1524, and 1828 mm from the load plate. FWD testing was conducted at an interval of 0.1 mile in the right wheel path. Three load levels of 40, 53, and 66 kN were used in the FWD deflection-testing program. Pavement temperature was recorded in conjunction with each test. Testing was conducted in December 2009. Surface deflections were corrected for variation in pavement temperature by shifting the measurements to a standard temperature of 20°C using the BELLS and the AASHTO 1993 methods. Layer thicknesses were obtained from extracted cores. For the purpose of the analysis, pavement sections were categorized based on layer thicknesses into thin, medium, and thick pavements (Table 1):
Thin pavements – less than 3 in. of AC
Medium pavements – 3 to 6 in. of AC
Thick pavements – more than 6 in. of AC
Table 1. Descriptions of the Pavement Sections
Condition Projects sites FWD test points Length (mile) Thick 19 345 90 Medium 31 585 179 Thin 10 177 52
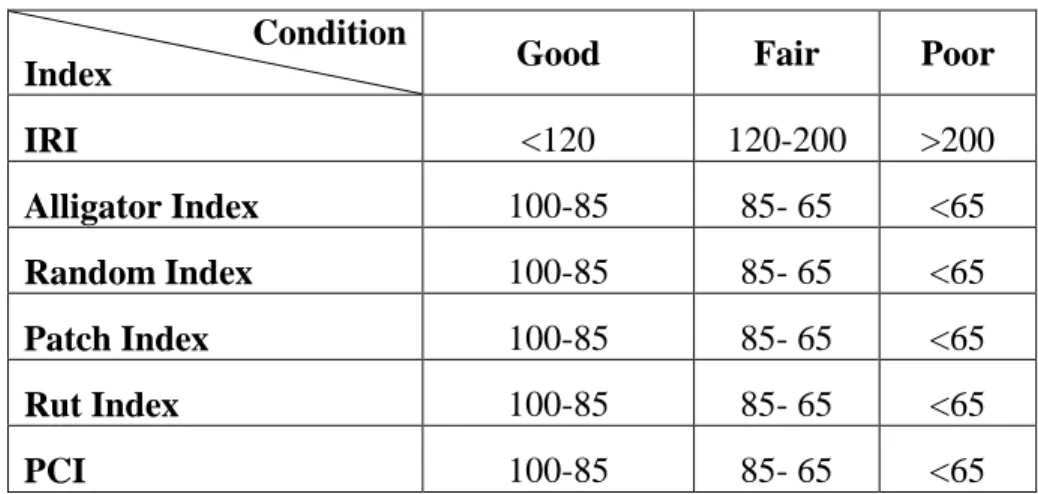
Pavement sections were also categorized based on pavement conditions into Good, Fair, and Poor. The thresholds used to categorize the different pavement sections are presented in Table 2.
31
Table 2. Thresholds for Performance Indices
Condition
Index Good Fair Poor
IRI <120 120-200 >200 Alligator Index 100-85 85- 65 <65 Random Index 100-85 85- 65 <65 Patch Index 100-85 85- 65 <65 Rut Index 100-85 85- 65 <65 PCI 100-85 85- 65 <65
3.5 Analysis and Results
3.5.1 Statistical Analysis
The effective structural number was calculated for each pavement section using FWD deflection data measured at a load level of 40 kN based on the AASHTO procedure according to Equations (1) to (3). Conditions of the pavement sections were extracted from the Louisiana PMS for the survey conducted in 2009. Performance data included cracking, rutting, roughness, and patching.
Table 3. Statistical Analysis of Results
Variable F value P-value Significance
AC Thickness 122.51 < 0.0001 Significant
Base Thickness 422.80 < 0.0001 Significant
Alligator Cracking 22.45 < 0.0001 Significant
IRI 4.25 0.0395 Significant
Patch 6.54 0.0107 Significant
Rut 7.35 0.0068 Significant
32
Statistical analysis was conducted to identify the most influential variables on the calculated structural number. An Analysis of Variance (ANOVA) was performed at 95% confidence level to determine whether the SN values were statistically equivalent for the different populations. The results of the statistical analysis are presented in Table 3. As shown in Table 3, results of the statistical analysis showed that the thicknesses and performance indices were significantly influencing the effective structural number of a pavement section.
Results of the ANOVA showed that the most influential factors were alligator cracking, AC thickness, and base thickness. In addition, the least influential factor was random cracking. In general, results of the statistical analysis presented in Table 3 were expected since alligator cracking is the main structural failure mechanism in flexible pavements and was found significant. In addition, SN is directly proportional to the thicknesses of the pavement layers (Equation 1) and is therefore, strongly influenced by AC and base thicknesses. It was also expected that IRI would influence the calculated SN since it is an indicator of pavement performance at the surface.
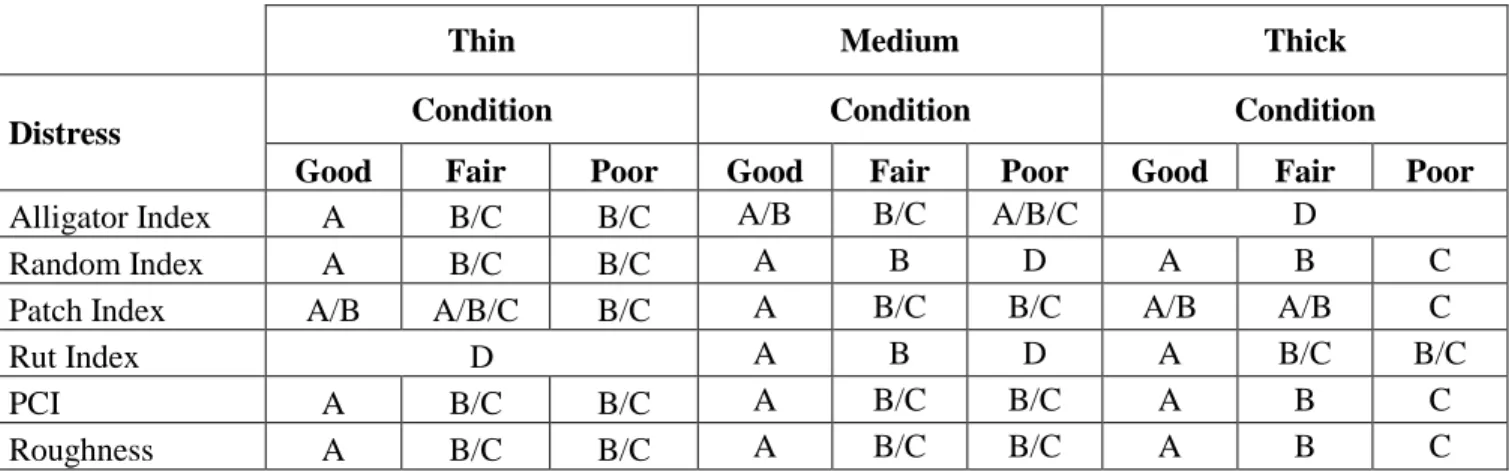
Table 4. Statistical Comparisons of Structural Number for Different Pavement Conditions
Thin Medium Thick
Distress Condition Condition Condition
Good Fair Poor Good Fair Poor Good Fair Poor
Alligator Index A B/C B/C A/B B/C A/B/C D
Random Index A B/C B/C A B D A B C Patch Index A/B A/B/C B/C A B/C B/C A/B A/B C
Rut Index D A B D A B/C B/C
PCI A B/C B/C A B/C B/C A B C Roughness A B/C B/C A B/C B/C A B C
A multiple comparison procedure with a significance level of 5% was performed for the means. The results of the statistical grouping were reported with the letters A, B, C, and so forth. The letter A was assigned to the best performer followed by the other letters in appropriate order. A double (or more) letter designation, such as A/B, indicates that the difference in the means is not clear-cut, and that the results could fall in either category. A letter D indicates that the difference in the means was not significant. Results are presented in Table 4 and are categorized
33
based on pavement thicknesses into thin, medium, and thick pavements. As shown in Table 4, the structural number of pavements in good condition was statistically greater than pavements in fair and poor conditions. However and for most of the cases, there was no clear cut between pavements in fair and poor conditions for the most of the performance indicators. This may indicate that an abrupt drop in structural capacity does not occur for pavements in their mid-service life until conditions reach a poor condition.
3.5.2 Structural Number (SN) versus Pavement Distresses
The individual relationships of pavement distresses such as IRI, alligator cracking, and random cracking on in-service pavement structural number were investigated. Figure 9 presents a comparison of the average structural numbers for the categorized pavement sections and its
Figure 9. Structural Number (SN) versus International Roughness Index (IRI)
variation with pavement roughness. As shown in the figure 9, there is a downward trend between pavement roughness expressed in IRI and SN. It is also observed that while a clear weakening in SN is noticed between good and fair conditions, the change in SN between fair and poor is much smaller. In addition, differences between thick and medium pavements were not significant.
0 0.5 1 1.5 2 2.5 3 3.5 4
GOOD FAIR POOR
S N_C AL THICK MEDIUM THIN
34
Figure 10 illustrates the relationship between PCI and the effective SN. As shown in this figure, the improvement in pavement conditions as described by the PCI caused an increase in the pavement structural number.
Figure 10. Structural Number (SN) versus Pavement Condition Index (PCI)
Figure 11 (a and b) illustrates the relationship between Random Cracking Index, Alligator Cracking Index, and the effective SN. As shown in this figure, there was a clear relationship between cracking indices (alligator and random) and the calculated pavement structural number. However, differences between thick and medium pavements were not significant.
3.6 Summary and Conclusions
The objective of this study was to investigate the relationship between pavement distresses as performance indicators, pavement condition indices, and the effective structural number of in-service pavements calculated from FWD testing. To achieve this objective, 50 pavement sections were tested in Louisiana using FWD to assess their structural capacity. Based on the results of this analysis, the following conclusions may be drawn:
0 0.5 1 1.5 2 2.5 3 3.5
GOOD FAIR POOR
SN -C al THICK MEDIUM THIN
35
The COV in SN calculations in the 50 pavement sections was very high and ranged from 14 to 63% with an average COV of 35%. This high variability may influence overlay design calculations that are usually based on the average effective SN for a pavement section.
(a)
(b)
Figure 11. Structural Number (SN) versus (a) Random Crack Index and (b) Alligator Cracking Index 0 0.5 1 1.5 2 2.5 3 3.5
GOOD FAIR POOR
SN_cal THICK MEDIUM THIN 0 0.5 1 1.5 2 2.5 3 3.5
GOOD MEDIUM POOR
SN_Cal
THICK MEDIUM THIN
36
Results of the statistical analysis conducted in this study showed that the most influential factors were alligator cracking, AC thickness, and base thickness. In addition, the least influential factor was random cracking.
For most of the sections, SN showed good correlation with the performance indices. Further, the structural number of pavements in good condition was statistically greater than pavements in fair and poor conditions. However and for most of the cases, there was no clear cut between pavements in fair and poor conditions for the most of the performance indicators. This may indicate that an abrupt drop in structural capacity does not occur for pavements in their mid-service life until conditions reach a poor condition.