BIOMETRIC DATA ANALYSIS OF STUDENT ATTENDANCE SYSTEM AT CSIBER
Department of Computer
ARTICLE INFO ABSTRACT
In the current digital era, biometric authentication is proving to be the most reliable foolproof method for authenticating a user based on his/her finger print impressions. The scope of biometric authentication is not limited to only an employee attendance but can be successfully utilized in all cases where some form of recording of attendance is desirable and s
required to be taken, such as student class attendance. The raw data generated by a typical biometric machine consists of enormous hidden information. But before any meaningful information can be derived from it, it is necessary
cooked data can then be loaded in any back end database management system for querying desired information. Further, the data generated by a biometric machine grows exponentially and is dif to maintain. In this paper, authors have made an attempt to carry out these tasks using MS Access and VB. The multi
MS-Access in data tier, where MS
cleaned identifying outliers, if any and data and time are transformed into formats as required by MS Access using in
implemented in
Biometric data generated is estimated and the model is tested for the data generated by class attendance system at CSIBER. The output of the model is the large number of infor
pertaining to the information hidden in raw data. Few sample reports are explored.
Copyright © 2016 Dr. Naik and Patil. This is an open access article distributed under the Creative Commons Att distribution, and reproduction in any medium, provided the original work is properly cited.
INTRODUCTION
Biometrics refers to the science of employing human measurements to authenticate a person. Biometric technology offers the promise of an easy and a secure method for making highly accurate verifications of individuals. Not only does this technology make our lives easier by eliminating the need to carry badges and other identification tokens, but also it prevents the use of forged tickets, badges, or passports. . By using biometrics, it is possible to confirm or establish an individual’s identity based on “who she is,” rather than by “what she possesses” or “what she remembers”. A biometric scan can provide security access to protected areas, serve as a day pass, punch an employee in at the start of the work day, or allow an executive access to his laptop com
technologies capitalize upon unique, permanent, and scanable human characteristics.
*Corresponding author: Dr. Naik, P. G.
Department of Computer Studies, CSIBER, Kolhapur (MS), India.
ISSN: 0975-833X
Vol.
Article History:
Received 22nd November, 2015
Received in revised form 05th December, 2015
Accepted 12th January, 2016
Published online 27th February,2016
Key words: Biometric Authentication, Data Cleaning, Data Transformation, Multi-tier Architecture, Pivot Table.
Citation:Dr. Naik, P.G. and Patil, M.B. 2016. “
Research, 8, (02), 26751-26762.
RESEARCH ARTICLE
BIOMETRIC DATA ANALYSIS OF STUDENT ATTENDANCE SYSTEM AT CSIBER
*
Dr. Naik, P. G. and Patil, M. B.
Department of Computer Studies, CSIBER, Kolhapur (MS), India
ABSTRACT
In the current digital era, biometric authentication is proving to be the most reliable foolproof method authenticating a user based on his/her finger print impressions. The scope of biometric authentication is not limited to only an employee attendance but can be successfully utilized in all cases where some form of recording of attendance is desirable and s
required to be taken, such as student class attendance. The raw data generated by a typical biometric machine consists of enormous hidden information. But before any meaningful information can be derived from it, it is necessary to perform extensive data cleaning and data transformation. Such a cooked data can then be loaded in any back end database management system for querying desired information. Further, the data generated by a biometric machine grows exponentially and is dif to maintain. In this paper, authors have made an attempt to carry out these tasks using MS Access and VB. The multi-layer architecture adopted hosts VB in presentation tier and MS
Access in data tier, where MS-Excel provides data to MS-Access in a desired format. Data is cleaned identifying outliers, if any and data and time are transformed into formats as required by MS Access using in-built functions of MS-Excel. The preliminary prototype model is designed and implemented in MS-Excel which is later converted into multi-tiered application using VB Biometric data generated is estimated and the model is tested for the data generated by class attendance system at CSIBER. The output of the model is the large number of infor
pertaining to the information hidden in raw data. Few sample reports are explored.
is an open access article distributed under the Creative Commons Attribution License, which distribution, and reproduction in any medium, provided the original work is properly cited.
Biometrics refers to the science of employing human measurements to authenticate a person. Biometric technology offers the promise of an easy and a secure method for making highly accurate verifications of individuals. Not only does this r lives easier by eliminating the need to carry badges and other identification tokens, but also it prevents the use of forged tickets, badges, or passports. . By using biometrics, it is possible to confirm or establish an ho she is,” rather than by “what she possesses” or “what she remembers”. A biometric scan can provide security access to protected areas, serve as a day pass, punch an employee in at the start of the work day, or allow an executive access to his laptop computer. Biometric technologies capitalize upon unique, permanent, and scanable
Department of Computer Studies, CSIBER, Kolhapur (MS), India.
A unique characteristic is one accessible only t
person and that no other person shares it. This characteristic should also remain the same over time, and be reliably collectable using a sensor. As much as possible, biometric technologies focus on these types of human traits.
All biometric devices take a number of physical measurements from an individual which are digitally processed
representation of the individual’s traits are saved into a template. Templates are then stored in a database associated with the device or in a smartcard given to the individual. This is referred to as an enrollment. When the individual attempts to identify himself by scanning a finger, hand, or eye, a biometric device compares the new scan to all available templates, in a process referred to as Identification, in order to find a match, or compares the new scan to a known template for the individual, in a process referred to as Verification. To be verified, a person must first claim an identity using a login name, smart card, or token. As the individual continues to use the technology, the template continually is refined, perfected, and adjusted for slight changes in the employee’s characteristics.
International Journal of Current Research Vol. 8, Issue, 02, pp.26751-26762, February, 2016
INTERNATIONAL
Biometric Data Analysis of Student Attendance System at CSIBER
BIOMETRIC DATA ANALYSIS OF STUDENT ATTENDANCE SYSTEM AT CSIBER
Studies, CSIBER, Kolhapur (MS), India
In the current digital era, biometric authentication is proving to be the most reliable foolproof method authenticating a user based on his/her finger print impressions. The scope of biometric authentication is not limited to only an employee attendance but can be successfully utilized in all cases where some form of recording of attendance is desirable and some disciplinary action is required to be taken, such as student class attendance. The raw data generated by a typical biometric machine consists of enormous hidden information. But before any meaningful information can be to perform extensive data cleaning and data transformation. Such a cooked data can then be loaded in any back end database management system for querying desired information. Further, the data generated by a biometric machine grows exponentially and is difficult to maintain. In this paper, authors have made an attempt to carry out these tasks using Excel,
MS-layer architecture adopted hosts VB in presentation tier and MS-Excel and Access in a desired format. Data is cleaned identifying outliers, if any and data and time are transformed into formats as required by
MS-Excel. The preliminary prototype model is designed and tiered application using VB-Access. Biometric data generated is estimated and the model is tested for the data generated by class attendance system at CSIBER. The output of the model is the large number of informative reports pertaining to the information hidden in raw data. Few sample reports are explored.
ribution License, which permits unrestricted use,
A unique characteristic is one accessible only to the concerned person and that no other person shares it. This characteristic should also remain the same over time, and be reliably collectable using a sensor. As much as possible, biometric technologies focus on these types of human traits.
ric devices take a number of physical measurements from an individual which are digitally processed before these representation of the individual’s traits are saved into a template. Templates are then stored in a database associated smartcard given to the individual. This is referred to as an enrollment. When the individual attempts to identify himself by scanning a finger, hand, or eye, a biometric device compares the new scan to all available templates, in a Identification, in order to find a match, or compares the new scan to a known template for the individual, in a process referred to as Verification. To be verified, a person must first claim an identity using a login name, smart card, or vidual continues to use the technology, the template continually is refined, perfected, and adjusted for slight changes in the employee’s characteristics.
INTERNATIONAL JOURNAL OF CURRENT RESEARCH
Different biometric technologies measure diverse aspects of the human anatomy. Finger readers measure the space between the forks of the ridges in a fingerprint. Hand readers can measure the orientation of veins in the hand, or the shape, length, and width of the fingers. Eye readers measure the veins in the retina or the texture of the iris. Some biometric measurements can be taken in even more innovative ways. For example, the shape, acceleration, and speed of a person’s signature can be used for biometric identification. Owing to its ability to recognize unique physiological characteristics, biometric technology can successfully be employed in employee time management system. Such biometric based attendance and time management systems are becoming increasingly popular and are gaining tremendous importance in market place due to the unique benefits offered by them. Since biometric terminals scan person’s unique features they ensure that the employees cannot clock in for one another thereby eliminating the possibilities of time theft. Fingerprint recognition system is one of the most prevalent biometric technologies. By placing the finger on the scanner, the time clock terminal reads the fingerprint and allows the person to clock in or out.
Biometrics has become extremely handy in helping institutions feel secure and eliminating employee check in delays and mal practices as it relies on unique physical characteristics varying between individuals. They rule out the possibilities of time fraud where one employee punches for another. . Biometric systems eliminate the need for easily-lost or stolen badges, or other identifying object. The wide variety of easy to use terminals provides a smart solution for the attendance management system in any organization. One of the most appealing and newest type of biometric technology deals with identification of unique pattern generated by the veins in a person’s hand. Since such patterns are intricate and extremely complex, it is nearly impossible for one person to impersonate as another person. As such this technology offers very low false acceptance and false rejections rates which makes it an ideal candidate in the place where very high security is desirable.
Literature Review
In literature there are large numbers of papers which deal with algorithms employed for accurate measurement of human traits
(Peng Shi et al., 2007; Stephan huckemann et al., 2008; Haiyun
et al., 2009; Yi (Alice) Wang, and Jiankun Hu, 2011;
JianjiangFeng, and Anil K.Jain, 2011). All of them focus on
comparison of algorithms and successive refinement of existing algorithms to render them more accurate to the best of author’s knowledge very few papers deal with analysis of data generated by biometric machine. In this section authors summarize their findings on the survey conducted for various finger print algorithms currently widely accepted. In their paper, the authors (Peng Shi et al., 2007) have proposed a novel fingerprint matching algorithm based on minutiae sets combined with the global statistical features. Minutia is one of the most widely adopted local features in fingerprint matching. The authors claim that the proposed algorithm has the advantage of both global and local features in fingerprint matching which can improve the accuracy of similarity measure without consuming additional time and memory.
Experimental results on FVC2004 databases reveal that these improvements can make a better matching performance on public domain databases. Virginia Espinosa-Duro et al.
(Virginia Espinosa-Duro, 2003) have designed high resolution
fingerprint identification system based on minutiae extraction. Their paper presents a fingerprint thinning algorithm based on image processing operations for improving the minutiae map involved. After obtaining the image of the user's fingerprint from a biometric systempre-processing algorithm is applied. This algorithm enables feature extraction to obtain the location and type of all minutiae i.e., the discontinuities in the ridges and valleys of the fingerprint.
Fingerprint verification methods and technologies are summarized by L. O’Gorman (O’Gorman, 1998) which addresses issues related to terminology, relative merits of different fingerprint technologies, recognition rate and systems design considerations, and the relative advantages and disadvantages of fingerprints versus other biometrics. The authors of paper (Anil et al., 2004) give a brief overview of the field of biometrics and summarize some of its strengths, limitations, advantages, disadvantages, and related privacy concerns. A compact representation of a fingerprint image is minutiae-based template and for a long time it has been assumed that it did not contain enough information to enable the reconstruction of the original fingerprint. The authors of paper (Cappelli et al., 2007; Cappelli et al., 2006) have proposed a novel approach to reconstruct fingerprint images from standard templates. Nine different fingerprint recognition algorithms were employed to study the efficacy of the proposed reconstruction system. Their experimental results reveal that the reconstructed images are very realistic and in most of the cases compare very well to the finger print images.
In their paper Wan et al. (Hong et al., 1998) have presented a fast fingerprint enhancement algorithm for proving the robustness of automatic fingerprint identification/verification system for adaptively improving the clarity of ridge and valley structures of input fingerprint images based on the estimated local ridge orientation and frequency. The authors have evaluated the performance of the algorithm the goodness index of the extracted minutiae and the accuracy of an online fingerprint verification system.
Authors of paper (Ross et al., 2007) challenge this notion and show that three levels of information about the parent fingerprint can be derived from the minutiae template alone which refer to orientation field information, class or type information and friction ridge structure. These traits are enough to reconstructed ridge structure closely resembling to the parent fingerprint.
Theoretical Framework
Biometric Data Generation
Let C1, C2, . . . .Cirepresent different courses where each course
has strength of students represented by,
S1, S2, . . . .Si ,respectively.
Let n1, n2, . . . .ni represent No. of lectures per day in each
course.
The total no. of students is given by,
Σ CiSi
The total no. of records generated per day is given by,
Σ niCiSi
Hence the total no. of records generated per month is given by
R = 30 Σ niCiSi
Case Study
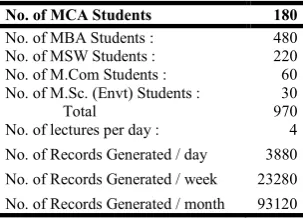
[image:3.595.358.510.181.290.2]CSIBER is an autonomous institute in Southern Western Maharashtra which currently runs five courses, MBA, MCA, MSW, M.Com and M.Sc. (Health and Safety). The course information along with the student strength of each course, average number of lectures engaged per day and the size of the periodic data generated is depicted in Table 1.
Table 1. PG Courses at CSIBER
No. of MCA Students 180
No. of MBA Students : 480 No. of MSW Students : 220 No. of M.Com Students : 60 No. of M.Sc. (Envt) Students : 30
Total 970
No. of lectures per day : 4 No. of Records Generated / day 3880 No. of Records Generated / week 23280 No. of Records Generated / month 93120
Each lecture hall is embedded with a biometric machine for monitoring daily attendance of a student. The model of the biometric machine is E9 attendance machine with the following specifications.
500 user capacity
1000 transaction capacity
Visual Display
[image:3.595.50.557.405.730.2] Black color
Admin Accesses Support
Pen drive support
LAN cable support
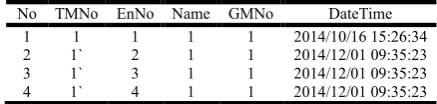
Table 2 depicts the structure of sample raw data generated by a biometric machine.
[image:4.595.54.538.62.572.2]The size of the data generated by a biometric machine over a period of time and the trend of data is depicted in Figure 1.
Table 2. Structure of Sample Biometric Data
No TMNo EnNo Name GMNo DateTime 1 1 1 1 1 2014/10/16 15:26:34 2 1` 2 1 1 2014/12/01 09:35:23 3 1` 3 1 1 2014/12/01 09:35:23 4 1` 4 1 1 2014/12/01 09:35:23
Decomposition of Biometric Data
For efficient processing of data, huge data generated by a biometric machine is successively decomposed into different levels corresponding to year, semester and faculty, respectively, as shown in Figure 2.
[image:4.595.315.491.373.552.2]Figure 2. Decomposition of Biometric Data
Figure 3. Prototyping Model in MS Excel
[image:4.595.322.541.630.682.2]ETL Process (Extraction, Transformation and Loading) Data Cleaning and Transformation in MS-Excel
The raw data generated by a typical biometric machine is presented in Table 2. Such a raw data contains hidden information pertaining to
Course lecture slot times
Assignment of various faculties to lecture slots
Faculty-wise delay in engaging lectures
Student-wise delay in attending lectures
Student-wise attendance.
Substituted lectures
Unengaged lectures
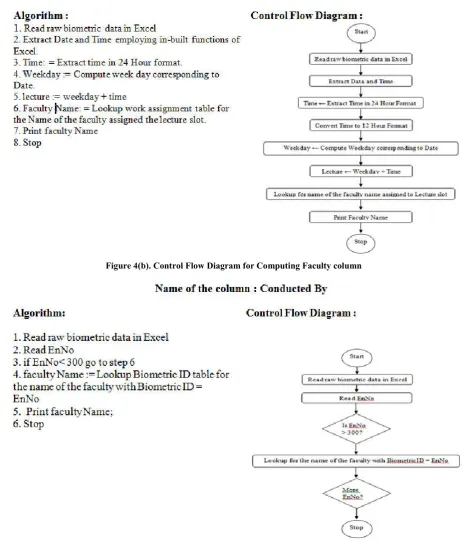
Such a data needs cleaning and transformation before any meaningful information can be derived from it. To render this possible, authors have adopted MS-Excel due to its richness in Figure 4(b). Control Flow Diagram for Computing Faculty column
[image:5.595.63.531.78.621.2] [image:5.595.256.513.78.333.2]in-built data manipulation functions. Initially, the model is implemented in MS-Excel. The three prime functionalities borrowed from Excel are:
Lookup table using V Lookup () function.
Pivot table chart and Pivot Table Wizard.
Data Filtering
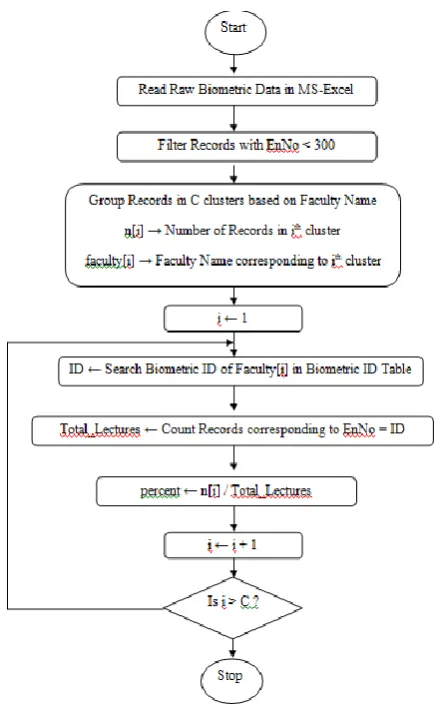
The model implemented in MS-Excel is depicted in Figure 3, along with the algorithms and control flow diagrams for computing new columns are shown in Figure 4(a)- 4(c). Different formulae created during the model implementation being depicted in Figure 5.
The columns of relevance are:
EnNo→ Enrollment of the student or faculty member, where EnNo > 300 for faculty.
DateTime → Data and Time corresponding to punching the machine.
Control Flow Diagram and Algorithm for Computing New Columns
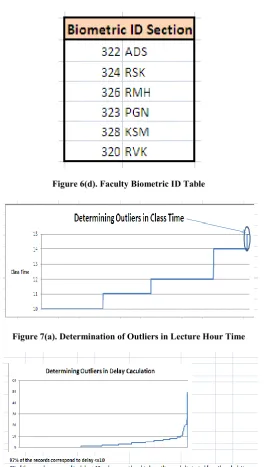
The various lookup tables employed in evaluation of the Excel formulae are listed in Figure 6(a) - 6(d).
Figure 6(a). Work Allotment Lookup Table
The outliers are detected and eliminated from the final calculations which would otherwise affect the final result substantially. The detection of outliers in lecture slots and delay computation are shown in Figures 7(a) and 7(b), respectively.
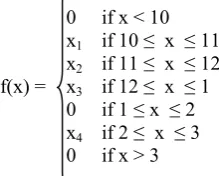
The data is represented by a Step function given by
0 if x < 10
x1 if 10 ≤ x ≤ 11
x2 if 11 ≤ x ≤ 12
f(x) = x3 if 12 ≤ x ≤ 1
0 if 1 ≤ x ≤ 2 x4 if 2 ≤ x ≤ 3
0 if x > 3
Width of the step shows cumulative number of lectures conducted in that particular slot.
Figure 6(b). Lecture Slot Lookup Table
[image:6.595.342.452.74.162.2]Figure 6(c). Week Day Lookup Table Figure 5. Excel Formulae Employed in computation
Cell Address Formula Description
G3 =INT(F3) For extracting Date part of DateTime field
H3 =WEEKDAY(G3) For calculating WeekDay which varies from 1 to 7, 1 for Sunday and 7 for Saturday.
I3 =F3-G3 For computing Time component where F3 refers to a DateTime field J3 =I3+TIME(0,5,0) To adjust 5 minutes clock lag time.
K3 =IF(HOUR(J3)>12,HOUR(J3)-12,HOUR(J3)) Converting time from 24 Hour format to 12 Hour format. L3 =IF(MINUTE(I3)>50,0,MINUTE(I3)) To compute delay, adjusting early minutes
M3 =VLOOKUP(H3,$AA$5:$AB$11,2,FALSE) To Compute text week day corresponding to numeric week day by looking up into a table stored at address AA5:AB11
N3 =IF(ISNA(VLOOKUP(C1364,$AD$4:$AE$9,2,FALSE))," ",VLOOKUP(C1364,$AD$4:$AE$9,2,FALSE))
To retrieve faculty name by looking up into the table storing biometric id along with faculty name at address
AD4:AE9.
O3 =K3&M3 Concatenation of time and day. P3 =IF(ISNA(VLOOKUP(O3,$X$4:$Y$27,2,FALSE)),"",VLOOK
UP(O3,$X$4:$Y$27,2,FALSE))
To retrieve the name of the faculty assigned a lecture in that time slot.
Q3 =IF(ISNA(VLOOKUP(C3,$AD$4:$RAD$49,2,FALSE)),"",VL OOKUP(C3,$AD$4:$RAD$49,2,FALSE))
[image:6.595.41.550.220.398.2] [image:6.595.89.240.555.689.2] [image:6.595.362.507.585.741.2]Figure 6(d). Faculty Biometric ID Table
Figure 7(a). Determination of Outliers in Lecture Hour Time
Figure 7(b). Determination of Outliers in Delay Calculation
97 % of the records are concentrated in 0-10 belt which are considered in our calculation. The corresponding records are represented in Figure 8 and depicted in Table 3.
[image:7.595.34.299.54.522.2]Figure 8. No. of Records Qualifying Data Cleaning Process
Table 3. No. of Records in 0-10 Belt
Time No. of Lectures 10 409 11 321 12 416 2 224 Total 1370 Outliers 13
The prototype model given above is implemented in VB with MS-Access as backend. The multi-tier application architecture employed is shown in Figure 9 and the structure of database
[image:7.595.384.483.87.160.2]with different relations between the tables is shown in Figure 10.
Figure 9. Multi-Tier Application Architecture
Figure 10. Structure of the Database
Control Flow Diagrams
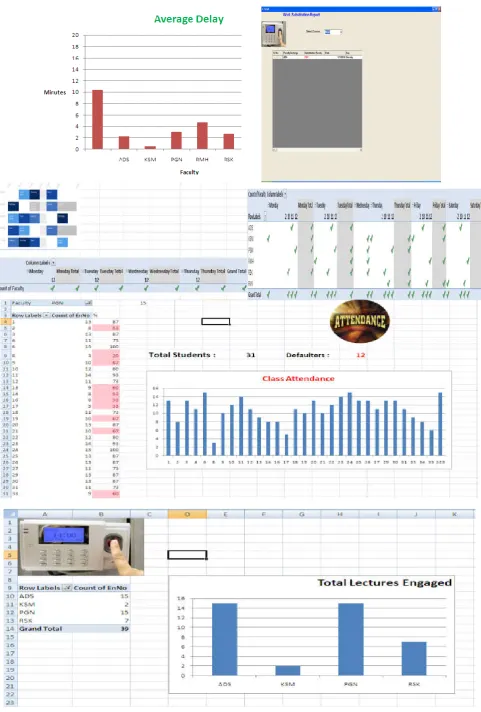
The control flow diagrams for locating substitute lectures, no. of lectures engaged by various faculty members, faculty-wise average delay and student-wise class attendance are shown in Figures 11 (a)-11(d), respectively.
[image:7.595.332.534.238.375.2] [image:7.595.310.560.404.542.2]Figure 11(a). Control Flow Diagram for Locating Substitute Lectures
Figure 11(b). Control Flow Diagram for Determining No. of Lectures Engaged by Faculty Members
Figure 11(c). Control Flow Diagram for Computation of Faculty-wise Average Delay
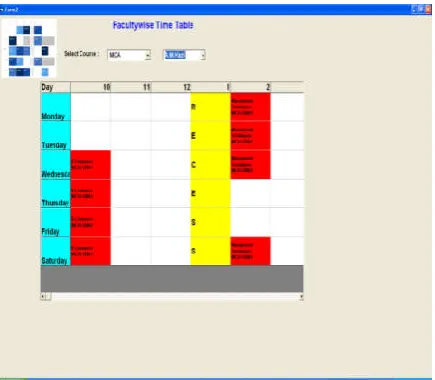
[image:8.595.37.554.46.721.2] [image:8.595.40.560.50.352.2] [image:8.595.326.545.370.727.2] [image:8.595.40.286.372.696.2]Figure 12(c). Faculty-wise Time Table Generation
Conclusion and Scope for Future Work
Biometric systems generate huge data periodically which contain the real snapshot of the ongoing tasks. Analysis of such data, therefore reveals true picture of ongoing activities. However, before any information can be derived from such a vast data, the data needs to be cleaned and prepared suitable for query operations.
In the current work, the authors have designed and implemented a model for deriving a useful information from a raw data generated by a typical biometric machine. The data is cleaned by identifying outliers, if any and initial prototyping model is implemented in MS-Excel which is later converted into multi-tiered application employing VB and Access. The model is applied for analyzing the student attendance data analysis at CSIBER.
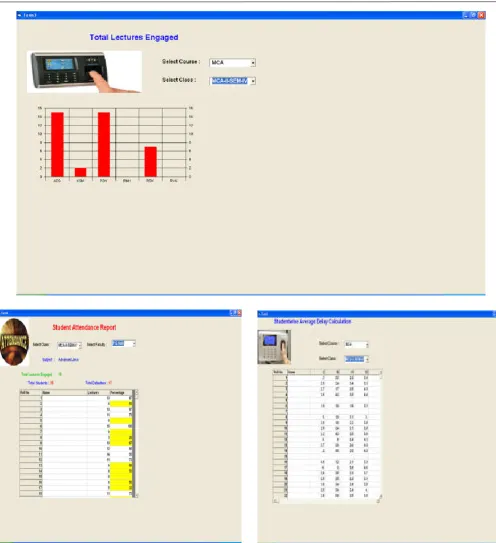
Figure 12(a). Biometric Data Analysis Tool in VB
[image:9.595.169.436.57.163.2] [image:9.595.87.514.186.506.2] [image:9.595.56.274.551.741.2][image:10.595.60.542.52.765.2]
Some sample reports pertaining to daily student attendance, no of lectures engaged by various faculties, faculty-wise and student-wise delay reports, work substitution reports, unengaged lectures reports are generated. Our future work focuses on correlating the real student attendance data so obtained with the student academic perform data to study the type of relationship between two. Further, association rule mining on the two sets of data would dictate and reveal such hidden relationships.
REFERENCES
Anil K. Jain, Arun Ross and Salil Prabhakar, 2004. “An introduction to biometric recognition,” Circuits and Systems for Video Technology, IEEE Transactions on Volume 14, Issue 1, Jan. 2004, pp 4 – 20.
Anil K.Jain, and jianjiangfeng, 2011. “Latent Fingerprint Matching”, IEEE Transactions, Vol.33, pp. 88-100, Jan.2011.
[image:11.595.50.547.47.591.2]
Cappelli, R., Lumini, A., Maio, D. and Maltoni, D. 2007. Fingerprint Image Reconstruction from Standard Templates, IEEE Transactions, Vol. 29, pp.1489-1503. Cappelli, R., Maio, D., Maltoni, D., Wayman, J., L. and Jain,
A. K. 2006. Performance evaluation of fingerprint verification systems, IEEE Trans. Pattern Anal., 28(1), pp. 3-18.
HaiyunXu, Raymond N.J. Veldhuis, Asker M. Bazen, Tom, A.M. Kevenaar, Ton A.H.M. Akkermans, and BerkGokberk, 2009. “Fingerprint Verification Using Spectral Minutiae Representations”, IEEE Transactions,
Vol.4, pp.397-409, Sep.2009.
Hong, L., Wan, Y., and Jain, A. 1998. Fingerprint Image Enhancement algorithm and performance evaluation,
Computer Journal of IEEE transactions pattern annulus
machine intelligent, 20(8), pp. 777-789.
Jianjiang Feng, and Anil K. Jain, 2011. “Fingerprint Reconstruction: From Minutiae to Phase”, IEEE
Transactions, Vol. 33, No. 2, pp, 209-223, Feb.2011.
O’Gorman, L. 1998. “Overview of fingerprint verification technologies,”Elsevier Information Security Technical Report, Vol. 3, No. 1, 1998.
Peng Shi, JieTian, Qi Su, and Xin Yang, 2007. “A Novel Fingerprint Matching Algorithm Based on Minutiae and Global Statistical Features”, IEEE Conference, 2007. Peng Shi, JieTian, Qi Su, and Xin Yang, 2007. “A Novel
Fingerprint Matching Algorithm Based onMinutiae and Global Statistical Features”, IEEE Conference, 2007. Ross, A., Shah, J. and Jain, A.K. 2007. “From Template to
Images Reconstructing Fingerprints from Minutiae Points”,
IEEE Transactions, Vol.29, pp.544-560, Apr.2007.
Stephan huckemann, Thonmas Hotz, and Axel Munk, 2008. “Global Models for the Orientation Field of Fingerprints: An Approach Based on Quadratic Differentials”, IEEE
Transactions, Sep.2008.
Virginia Espinosa-Duro, 2003. “Fingerprints Thinning Algorithm,” IEEE Aerospace and Electronic Systems
Magazine Systems Magazine, Volume18, Issue 9, 2003.
Yi (Alice) Wang, and Jiankun Hu, 2011. “Global Ridge Orientation modelling for Partial Fingerprint Identification,” IEEE Transactions, Vol. 33, Pg.72-87, Jan. 2011.