1449
http://dx.doi.org/10.3168/jds.2015-10156
© 2016, THE AUTHORS. Published by FASS and Elsevier Inc. on behalf of the American Dairy Science Association®.
ABSTRACT
Bovine paratuberculosis is a disease characterized by chronic granulomatous enteritis causing protein-losing enteropathy. Adverse effects on animal productivity are key drivers in the attempt to control paratuberculosis at the farm level. Economic models require an accurate estimation of the production effects associated with paratuberculosis. The aim of this study was to conduct a systematic review and meta-analysis to investigate the effect of paratuberculosis on milk production. A to-tal of 20 effect estimates from 15 studies were included in the final meta-analysis. Substantial between-study heterogeneity was observed. Subgroup analysis by case definition and study design was carried out to inves-tigate heterogeneity. The majority of between-study variation was attributed to studies that defined cases on serology. Calculation of a pooled effect estimate was only appropriate for studies that defined cases by or-ganism detection. A reduction in milk yield, corrected for lactation number and herd of origin of 1.87 kg/d, equivalent to 5.9% of yield, was associated with fecal culture or PCR positivity in individual cows.
Key words: paratuberculosis, Johne’s disease, meta-analysis, milk yield
INTRODUCTION
Bovine paratuberculosis is a disease characterized by chronic granulomatous enteritis, which manifests clinically as a protein-losing enteropathy causing diar-rhea, hypoproteinemia, emaciation, and, eventually, death (Sweeney et al., 2012). Adverse effects on animal productivity and losses due to continued spread of
in-fection are key drivers in the attempt to control the disease at the farm level. Some research exists to sug-gest that the etiologic pathogen Mycobacterium avium ssp. paratuberculosis (MAP) may pose a zoonotic risk, and a potential association with Crohn’s disease exists in humans (Chiodini et al., 2012). Consequently, many major dairy-producing countries have introduced con-trol programs aimed at reducing spread between and within herds (Geraghty et al., 2014).
Farm-level losses associated with the effect of para-tuberculosis on production are often cited as important drivers in the need to control the disease on dairy farms. Several studies have been published on the eco-nomic effect of paratuberculosis at the farm level, with estimates generally in the range of $20 to $50 per cow in infected herds (Ott et al., 1999; Chi et al., 2002; Stott et al., 2005).
Economic models commonly use production loss esti-mates from a chosen observational study to investigate the effect of infection on milk production. However, a substantial number of these studies available in the lit-erature report varying effect estimates. Whereas many studies have found a significant association between animals testing positive for MAP and reductions in milk production, others have reported a nonsignificant reduction or, in some cases, an increase in production associated with diagnostic test positivity (Garcia and Shalloo, 2015).
Narrative reviews of the effect of paratuberculosis on milk production are widely available in the literature; however, these are subjective in nature and therefore prone to reviewer bias (Blettner et al., 1999). System-atic review and meta-analysis represents a quantita-tive approach to combining information from multiple research studies. In addition, meta-analysis represents a useful approach to investigating sources of hetero-geneity between observational studies. The objective of our study was to conduct a systematic review and meta-analysis of the effect of paratuberculosis
diagnos-The effect of paratuberculosis on milk yield—A
systematic review and meta-analysis
Conor G. McAloon,*1 Paul Whyte,* Simon J. More,* Martin J. Green,† Luke O’Grady,* AnaBelen Garcia,‡
and Michael L. Doherty*
*Section of Herd Health and Animal Husbandry, School of Veterinary Medicine, University College Dublin, Belfield, Dublin 4, Ireland †School of Veterinary Medicine and Science, University of Nottingham, Sutton Bonington, LE12 5RD, United Kingdom
‡Animal and Grassland Research and Innovation Centre, Teagasc Moorepark, Fermoy, Co. Cork, Ireland
Received July 22, 2015. Accepted October 23, 2015.
1 Corresponding author: [email protected]
tic test positivity on milk yield to investigate between-study heterogeneity and, where appropriate, calculate a pooled effect estimate of the effect of diagnostic test positivity on milk yield.
MATERIALS AND METHODS
The study was conducted in compliance with con-sensus guidelines for the meta-analysis of observational studies in epidemiology (MOOSE; Stroup et al., 2000). In this case the question was, “What is the effect of paratuberculosis infection on milk yield in dairy cattle?” Review questions were often further defined in terms of the population, intervention, comparator, outcome, and study design (EFSA, 2010). In this case, the population of interest was dairy cattle, the intervention was infec-tion as determined by ELISA positivity or detecinfec-tion of the organism (MAP) in feces by culture or PCR; the comparator was diagnostic test negative animals; the outcome of interest was the deviation in milk yield; and the required study design for inclusion in the analysis was cross sectional or longitudinal.
Literature Search
The primary author (C. McAloon) searched the elec-tronic databases PubMed (http://www.ncbi.nlm.nih. gov/pubmed) and CABDirect (http://www.cabdirect. org/) in January 2015 using the search terms “bovine OR cattle OR cows” and “paratuberculosis OR Johne’s” and “yield OR production OR effect” and “milk.” The search was conducted on all available years, on all types of articles (both peer-reviewed and nonreviewed), and was not limited to abstracts or titles. In addition, the reference lists from these papers were hand searched to identify additional relevant studies. These were subse-quently added to the master list (n = 76).
Eligibility Screening: First Phase
The first phase of the eligibility screening was con-ducted by the first author based on the information presented in each abstract. The following inclusion criteria were used: (1) studies reported in English, (2) seeking to quantify the level of milk production devia-tion in test-positive animals, and (3) conducted at the level of the individual animal (rather than the herd). All eligible papers (n = 44) were then retained for phase 2 screening.
Eligibility Screening: Second Phase
Phase 2 screening was also conducted by the first author. Each full paper was reviewed with particular attention to the materials and methods. Authors were
contacted for papers that were unavailable for access, but if the required study detail was not included in the published article we made no attempt to contact the author regarding missing data. Studies were considered eligible at this level if they addressed the following criteria: (1) compared milk yield between diagnostic test-positive and diagnostic test-negative dairy cows; (2) used original data that has been not used in a subsequent study; (3) reported an effect estimate and a corresponding uncertainty term; and (4) attempted to address key confounders in the statistical analysis, including herd or farm and parity.
Data Extraction
Following the compilation of the final list of studies (n = 33), data were extracted according to Supplementary Table S1 (http://dx.doi.org/10.3168/jds.2015-10156). Deviation in milk yield was extracted as kilograms of milk per cow per day. Study outcomes reported as 305-d milk yield were converted to a daily figure by dividing by 305. Fat and protein yields were extracted as grams per day. In the case of milk constituents being reported as a percentage, absolute yield was calculated by multiplying by the daily milk yield. Outcomes that were reported by lactation were extracted individually. When different case definitions were used in the same publication, each case definition was extracted as a separate study. Data were not read from figures.
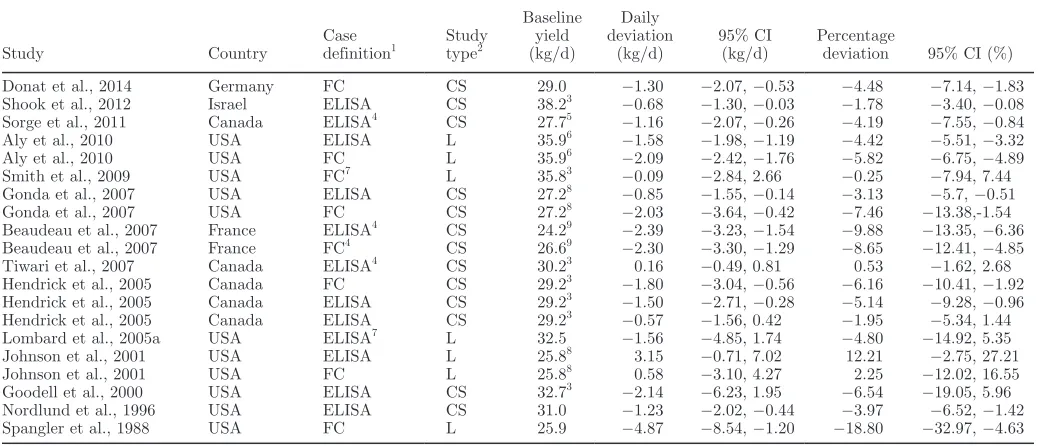
To estimate the deviation of milk yield as a percent-age of expected production, milk yield of the negative subgroup was extracted as a baseline. When these data were not presented in a study, the overall yield of the entire study population was extracted from the de-scriptive statistics. When neither of these sources were reported in the study, the intercept of the multivariate model was adjusted to lactation 3 and used. Finally, in the absence of any of the above information reported in the study, the average yields per cow over the time period coinciding with the sampling frame outlined was obtained for the relevant geographical region. These data were sourced from the National Animal Health Monitoring System (J. E. Lombard, Fort Collins, Colo-rado, personal communication) or the National Agri-cultural Statistics Service (USDA, 2015).
Pooling Subgroups
Subgroups of case definitions and lactation number were combined when no overall effect was provided. A combined effect estimate was calculated by a weighted mean of the subgroup estimates and a standard error for this combined effect was calculated from the square root of the average variances of the subgroups.
Statistical Analysis
Studies were further screened before meta-analysis with the intention of including comparable outcomes in the analysis. Studies that quantified milk yield over the lifetime of the animal were not included. Where possible, case definitions that combined diagnostic tests were not included; for example, the case definition “ELISA positivity or fecal culture” was not included. Case studies were also not included in the meta-analysis given the small number of these studies.
Random effects models were constructed to investi-gate the deviation in milk yield as an absolute value and as a percentage of overall yield. Models were also constructed to investigate the effect on milk fat and protein. In a random effects meta-analysis, the underly-ing effect of infection on milk production is allowed to vary for each study. The model was constructed using the metan command in STATA (Harris et al., 2008) and the Higgins statistic (I2) was used to assess between-study heterogeneity (Higgins and Thompson, 2002). This value ranges from 0 to 100% and represents the percentage of the variation in the point estimate that can be attributed to study heterogeneity rather than chance (Higgins et al., 2003). The following guidelines have been suggested for interpretation of the Higgins statistic: unimportant (0–40%), moderate (30–60%), substantial (50–90%), and considerable (75–100%; Deeks et al., 2008). When substantial heterogeneity was present, data sets were subgrouped to investigate possible sources of heterogeneity. Publication bias was investigated using funnel plots and tested using Egger’s test (Egger et al., 1997). Finally, a sensitivity analysis was conducted by varying some of the decisions made around study selection criteria and repeating the analy-ses.
RESULTS
Study Selection: Phase 1
The initial search in PubMed and CABdirect result-ed in 375 and 140 returnresult-ed articles, respectively. After reading the titles of the returned papers and combin-ing results from both search engines, 60 eligible papers
were identified. The reference lists of these papers were hand searched and a further 16 papers were added to the main list. Of the 76 eligible articles during phase 1 screening, 9 papers were excluded as review articles, 4 were excluded as herd-level studies, 10 were excluded as economic studies that used production data from another study, and a further 3 studies were excluded as not having been published in English. Six articles were also excluded, as it appeared they were not relevant to the particular research question (i.e., they did not aim to quantify the level of milk loss).
Study Selection: Phase 2
During the second phase of eligibility screening, 4 studies were excluded because the data had been published in a subsequent study (Kudahl et al., 2003; Lombard et al., 2005b; Sorge et al., 2007; VanLeeuwen et al., 2002). Fifteen studies were excluded because the required level of detail was not reported regarding the estimate and error term (Whitlock et al., 1985; Wilson et al., 1993; Chaffer et al., 2002; Hoogendam et al., 2009; Sibley et al., 2012), the outcome was not com-parable (DeLisle and Milestone, 1989; Nielsen et al., 2009), they did not (or did not appear to) account for herd as a possible confounder (Collins, 1991; Sweeney et al., 1994; Raizman et al., 2007, 2009; Pantoja et al., 2010), parity or age did not appear to be accounted for in the analysis (Rad et al., 2010), or the comparisons were between different lactations within the same ani-mal (Benedictus et al., 1986, 1987). Two studies were unavailable (Dinsmore, 1986; Pavlík et al., 1994).
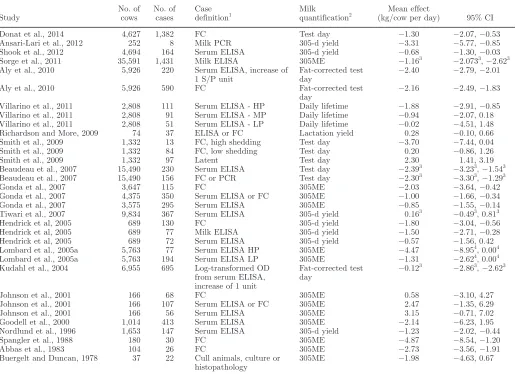
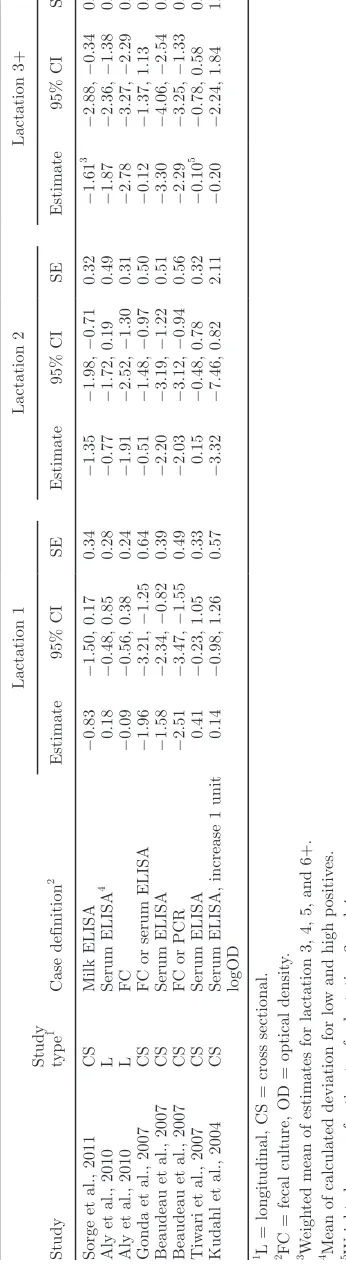
The final list following phase 2 screening consisted of 33 studies from 20 publications (Table 1). Two were from conference proceedings and 31 were from peer-re-viewed journals. Year of publication ranged from 1978 to 2014 and numbers of cases ranged from 8 to 1,382. Point estimates of production differences associated with paratuberculosis test positivity ranged from −4.87 to 3.15 kg/cow per day. Overall, 6 studies demonstrated a positive association between test-positivity and milk yield and 22 demonstrated a negative effect. Five stud-ies reported the outcome by lactation number rather than the overall effect (Table 2).
Simi-lar tables were constructed from studies investigating milk fat yield (Supplementary Table S2; http://dx.doi. org/10.3168/jds.2015-10156) and milk protein yield (Supplementary Table S3; http://dx.doi.org/10.3168/ jds.2015-10156).
Meta-Analysis
Longitudinal and cross-sectional studies that used either milk or serum ELISA or fecal culture or PCR were pooled for analysis (Table 3). Twelve random ef-fects meta-analyses models were constructed to investi-gate the effect of paratuberculosis on milk production, model outcomes are summarized in Table 4. Analysis of all case definitions and study designs together (Supple-mentary Figures S1 and S2; http://dx.doi.org/10.3168/
jds.2015-10156) resulted in a point estimate of −1.30 (95% CI = −1.72, −0.89) kg/cow per day estimated at −4.30% (95% CI = −5.61%, −2.99%) of overall yield. This figure represents the average milk yield deviation per day in test-positive dairy cows in the lactation in which the animal tests positive as compared with test-negative herdmates. However, substantial study heterogeneity was observed in this analysis (I2 = 73.0 and 72.6%, respectively).
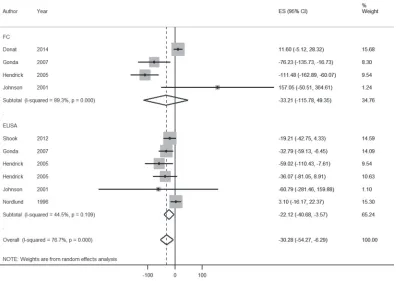
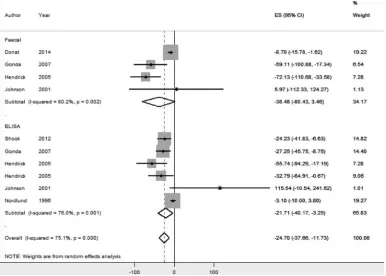
[image:4.612.37.554.90.464.2]Subgroup analysis by case definition (Figure 1) re-vealed that estimates from fecal detection case defini-tions resulted in greater reducdefini-tions in milk production (−1.87 kg) than those produced from ELISA case defi-nitions (−1.03 kg), although both case defidefi-nitions re-sulted in a statistically significant decrease in daily milk production. This translated to an estimated deviation
Table 1. Data extracted from studies investigating the effect of paratuberculosis on milk production
Study
No. of cows
No. of cases
Case
definition1 Milk quantification2 (kg/cow per day)Mean effect 95% CI
Donat et al., 2014 4,627 1,382 FC Test day −1.30 −2.07, −0.53
Ansari-Lari et al., 2012 252 8 Milk PCR 305-d yield −3.31 −5.77, −0.85
Shook et al., 2012 4,694 164 Serum ELISA 305-d yield −0.68 −1.30, −0.03
Sorge et al., 2011 35,591 1,431 Milk ELISA 305ME −1.163 −2.0733, −2.623
Aly et al., 2010 5,926 220 Serum ELISA, increase of
1 S/P unit
Fat-corrected test day
−2.40 −2.79, −2.01
Aly et al., 2010 5,926 590 FC Fat-corrected test
day
−2.16 −2.49, −1.83
Villarino et al., 2011 2,808 111 Serum ELISA - HP Daily lifetime −1.88 −2.91, −0.85
Villarino et al., 2011 2,808 91 Serum ELISA - MP Daily lifetime −0.94 −2.07, 0.18
Villarino et al., 2011 2,808 51 Serum ELISA - LP Daily lifetime −0.02 −4.51, 1.48
Richardson and More, 2009 74 37 ELISA or FC Lactation yield 0.28 −0.10, 0.66
Smith et al., 2009 1,332 13 FC, high shedding Test day −3.70 −7.44, 0.04
Smith et al., 2009 1,332 84 FC, low shedding Test day 0.20 −0.86, 1.26
Smith et al., 2009 1,332 97 Latent Test day 2.30 1.41, 3.19
Beaudeau et al., 2007 15,490 230 Serum ELISA Test day −2.393 −3.233, −1.543
Beaudeau et al., 2007 15,490 156 FC or PCR Test day −2.303 −3.303, −1.293
Gonda et al., 2007 3,647 115 FC 305ME −2.03 −3.64, −0.42
Gonda et al., 2007 4,375 350 Serum ELISA or FC 305ME −1.00 −1.66, −0.34
Gonda et al., 2007 3,575 295 Serum ELISA 305ME −0.85 −1.55, −0.14
Tiwari et al., 2007 9,834 367 Serum ELISA 305-d yield 0.163 −0.493, 0.813
Hendrick et al, 2005 689 130 FC 305-d yield −1.80 −3.04, −0.56
Hendrick et al, 2005 689 77 Milk ELISA 305-d yield −1.50 −2.71, −0.28
Hendrick et al, 2005 689 72 Serum ELISA 305-d yield −0.57 −1.56, 0.42
Lombard et al., 2005a 5,763 77 Serum ELISA HP 305ME −4.47 −8.954, 0.004
Lombard et al., 2005a 5,763 194 Serum ELISA LP 305ME −1.31 −2.624, 0.004
Kudahl et al., 2004 6,955 695 Log-transformed OD
from serum ELISA, increase of 1 unit
Fat-corrected test day
−0.123 −2.863, −2.623
Johnson et al., 2001 166 68 FC 305ME 0.58 −3.10, 4.27
Johnson et al., 2001 166 107 Serum ELISA or FC 305ME 2.47 −1.35, 6.29
Johnson et al., 2001 166 56 Serum ELISA 305ME 3.15 −0.71, 7.02
Goodell et al., 2000 1,014 413 Serum ELISA 305ME −2.14 −6.23, 1.95
Nordlund et al., 1996 1,653 147 Serum ELISA 305-d yield −1.23 −2.02, −0.44
Spangler et al., 1988 180 30 FC 305ME −4.87 −8.54, −1.20
Abbas et al., 1983 104 26 FC 305ME −2.73 −3.56, −1.91
Buergelt and Duncan, 1978 37 22 Cull animals, culture or
histopathology
305ME −1.98 −4.63, 0.67
1FC = fecal culture, S/P = sample/positive, LP = low positive, MP = medium positive, HP = high positive, OD = optical density. 2
305ME = 305-d mature-equivalent yield.
3Weighted mean of outcomes reported by lactation number. 4
in milk yield of −5.90 and −3.46% for fecal culture and ELISA, respectively (Supplementary Figure S3; http:// dx.doi.org/10.3168/jds.2015-10156). Furthermore, the majority of the between-study heterogeneity was ob-served in the ELISA subgroup (I2 = 71.2%). The level of between-study heterogeneity observed in the fecal subgroup was classified as unimportant (I2 = 28.9%).
Subgroup analysis by study design (Supplementary Figures S4 and S5; http://dx.doi.org/10.3168/jds.2015-10156) suggested that a small proportion of the het-erogeneity could be explained by type of study. The point effect estimate for longitudinal studies was more negative than that for cross-sectional studies However, in both cases the degree of between-study heterogeneity within the subgroups was still too high to support a pooled effect estimate.
Analysis by lactation number (Figure 2 and Sup-plementary Figure S10; http://dx.doi.org/10.3168/ jds.2015-10156) showed a trend toward larger nega-tive estimates with increasing lactation number; how-ever, considerable heterogeneity within subgroups (I2 = 80.6–90.3%) did not justify an overall pooled estimate by lactation number. Due to the smaller number of studies that reported by lactation (n = 5), it was not possible to further subgroup studies according to case definition or study type.
Meta-analysis was then conducted for each case defi-nition with study design as subgroups. Analysis by fe-cal culture (Supplementary Figures S6 and S7; http:// dx.doi.org/10.3168/jds.2015-10156) revealed that no heterogeneity was observed in cross-sectional studies, whereas moderate heterogeneity was observed in lon-gitudinal studies. Point estimates were similar between subgroups, with wider confidence intervals observed in pooling of longitudinal studies. Subgroup analysis of serological-positive animals by study type revealed substantial heterogeneity was still present within sub-groups (Supplementary Figures S8 and S9; http:// dx.doi.org/10.3168/jds.2015-10156).
[image:5.612.103.276.92.727.2]Analysis of the effect of disease on milk fat yield (Figure 3), revealed considerable between-study hetero-geneity (I2 = 76.7%), and a pooled estimate could only be justified for the ELISA subgroup, where infection was associated with a decline in milk fat yield of 22.1 g/d, equivalent to a 1.97% decline in overall fat yield (Supplementary Figure S11; http://dx.doi.org/10.3168/ jds.2015-10156). Analysis of the effect of paratubercu-losis on protein yield (Figure 4 and Supplementary Figure S12; http://dx.doi.org/10.3168/jds.2015-10156) demonstrated considerable between-study heterogene-ity (I2 = 75.1%) and a pooled estimate could not be justified.
The funnel plot for all study designs and case defi-nition were relatively symmetrical, suggesting little
T
able 2
. Data extracted from st
udies in
v
estigating the effect of parat
ub
erculosis on milk pro
duction b
y lactation n
um b er St udy St udy ty p e 1 Case definition 2 Lactation 1 Lactation 2 Lactation 3+ Estimate 95% CI SE Estimate 95% CI SE Estimate 95% CI SE
Sorge et al., 2011
CS Milk ELISA −0.83 −1.50, 0.17 0.34 −1.35 −1.98, −0.71 0.32 −1.61 3 −2.88, −0.34 0.65
Aly et al., 2010
L Serum ELISA 4 0.18 −0.48, 0.85 0.28 −0.77 −1.72, 0.19 0.49 −1.87 −2.36, −1.38 0.25
Aly et al., 2010
L F C −0.09 −0.56, 0.38 0.24 −1.91 −2.52, −1.30 0.31 −2.78 −3.27, −2.29 0.25
Gonda et al., 2007
CS
F
C or serum ELISA
−1.96 −3.21, −1.25 0.64 −0.51 −1.48, −0.97 0.50 −0.12 −1.37, 1.13 0.64
Beaudeau et al., 2007
CS Serum ELISA −1.58 −2.34, −0.82 0.39 −2.20 −3.19, −1.22 0.51 −3.30 −4.06, −2.54 0.39
Beaudeau et al., 2007
CS
F
C or PCR
−2.51 −3.47, −1.55 0.49 −2.03 −3.12, −0.94 0.56 −2.29 −3.25, −1.33 0.49 Tiw
ari et al., 2007
CS Serum ELISA 0.41 −0.23, 1.05 0.33 0.15 −0.48, 0.78 0.32 −0.10 5 −0.78, 0.58 0.34
Kudahl et al., 2004
CS
Serum ELISA, increase 1 unit logOD
0.14 −0.98, 1.26 0.57 −3.32 −7.46, 0.82 2.11 −0.20 −2.24, 1.84 1.04
1 L = longit
udinal, CS = cross sectional.
2F
C = fecal cult
ure, OD = optical densit
y.
3 W
eigh
ted mean of estimates for lactation 3, 4, 5, and 6+.
4Mean of calculated deviation for lo
w and high p
ositiv
es.
5 W
eigh
publication bias (Figure 5), and Egger’s test revealed no significant bias (P = 0.334). In addition, the fun-nel plot also revealed 2 distinct clusters of SE between 0.25 to 0.75 and 1.5 to 2.0. Further analysis revealed that study SE was significantly associated with year of publication and study design. Longitudinal studies and those published earlier produced estimates with a larger SE, whereas cross-sectional and more recent studies produced smaller SE.
[image:6.612.35.554.90.313.2]Finally, a sensitivity analysis was undertaken. Deci-sions made around the selection criteria were tested by dropping particular studies and repeating the analysis. When studies reporting an improvement in milk yield were removed, small changes in the overall point esti-mates were observed, −1.91 and −1.26 kg for fecal cul-ture and ELISA, respectively. However, between-study heterogeneity dropped substantially for the ELISA subgroup (44.6%), indicating that the Johnson et al.
Table 3. Final constructed table on effect estimates for association between paratuberculosis and daily milk yield
Study Country
Case definition1
Study type2
Baseline yield (kg/d)
Daily deviation
(kg/d)
95% CI (kg/d)
Percentage
deviation 95% CI (%)
Donat et al., 2014 Germany FC CS 29.0 −1.30 −2.07, −0.53 −4.48 −7.14, −1.83
Shook et al., 2012 Israel ELISA CS 38.23 −0.68 −1.30, −0.03 −1.78 −3.40, −0.08
Sorge et al., 2011 Canada ELISA4 CS 27.75 −1.16 −2.07, −0.26 −4.19 −7.55, −0.84
Aly et al., 2010 USA ELISA L 35.96 −1.58 −1.98, −1.19 −4.42 −5.51, −3.32
Aly et al., 2010 USA FC L 35.96 −2.09 −2.42, −1.76 −5.82 −6.75, −4.89
Smith et al., 2009 USA FC7 L 35.83 −0.09 −2.84, 2.66 −0.25 −7.94, 7.44
Gonda et al., 2007 USA ELISA CS 27.28 −0.85 −1.55, −0.14 −3.13 −5.7, −0.51
Gonda et al., 2007 USA FC CS 27.28 −2.03 −3.64, −0.42 −7.46 −13.38,-1.54
Beaudeau et al., 2007 France ELISA4 CS 24.29 −2.39 −3.23, −1.54 −9.88 −13.35, −6.36
Beaudeau et al., 2007 France FC4 CS 26.69 −2.30 −3.30, −1.29 −8.65 −12.41, −4.85
Tiwari et al., 2007 Canada ELISA4 CS 30.23 0.16 −0.49, 0.81 0.53 −1.62, 2.68
Hendrick et al., 2005 Canada FC CS 29.23 −1.80 −3.04, −0.56 −6.16 −10.41, −1.92
Hendrick et al., 2005 Canada ELISA CS 29.23 −1.50 −2.71, −0.28 −5.14 −9.28, −0.96
Hendrick et al., 2005 Canada ELISA CS 29.23 −0.57 −1.56, 0.42 −1.95 −5.34, 1.44
Lombard et al., 2005a USA ELISA7 L 32.5 −1.56 −4.85, 1.74 −4.80 −14.92, 5.35
Johnson et al., 2001 USA ELISA L 25.88 3.15 −0.71, 7.02 12.21 −2.75, 27.21
Johnson et al., 2001 USA FC L 25.88 0.58 −3.10, 4.27 2.25 −12.02, 16.55
Goodell et al., 2000 USA ELISA CS 32.73 −2.14 −6.23, 1.95 −6.54 −19.05, 5.96
Nordlund et al., 1996 USA ELISA CS 31.0 −1.23 −2.02, −0.44 −3.97 −6.52, −1.42
Spangler et al., 1988 USA FC L 25.9 −4.87 −8.54, −1.20 −18.80 −32.97, −4.63
1
FC = fecal culture.
2L = longitudinal, CS = cross sectional. 3
Overall average of study population (from descriptive statistics).
4Weighted average of reported effect by lactation. 5
Calculated from reported percentage deviation.
6Model intercept. 7
Weighted average of reported effect by test result magnitude.
8Average milk production in geographical region for duration of sampling period. 9
Reported average yield for noninfected adult (lactation ≥ 3) cow.
Table 4. Summary of meta-analyses investigating the effect of paratuberculosis on milk yield
Model Subgroup
Effect size
(kg/d) 95% CI
Between-study heterogeneity
(I2)
Effect size (% of overall
yield) 95% CI
Between-study heterogeneity
(I2)
Overall −1.30 −1.72, −0.89 73.0% −4.30 −5.61, −2.99 72.6%
Case Definition Fecal culture −1.87 −2.34, −1.40 28.9% −5.90 −7.50, −4.29 29.6%
ELISA −1.03 −1.53, −0.54 71.2% −3.46 −5.09, −1.83 72.2%
Study Design Cross sectional −1.23 −1.69, −0.78 66.6% −4.36 −6.05, −2.68 72.5%
Longitudinal −1.58 −2.31, −0.84 62.8% −4.64 −6.67, −2.61 60.2%
Lactation Number 1 −0.34 −1.08, 0.40 81.3% −1.38 −4.18, 1.42 82.5%
2 −1.11 −2.08, −0.15 80.6% −3.72 −6.89, −0.54 81.6%
3+ −1.50 −2.71, −0.29 90.3% −4.76 −8.78, −0.75 91.6%
Fecal Culture Cross sectional −1.74 −2.26, −1.22 0.0% −6.17 −8.18, −4.17 11.9%
Longitudinal −1.68 −3.38, 0.03 51.9% −4.97 −10.69, 0.75 53.5%
ELISA Cross sectional −1.01 −1.53, −0.48 68.7% −3.51 −5.43, −1.59 73.3%
[image:6.612.36.552.571.723.2](2001) study was responsible for a significant propor-tion of the heterogeneity observed in the original analy-sis. When data based on an assumed P-value (0.05) were excluded, only the ELISA subgroup was affected. The effect on the point estimate was minimal (−1.02 kg) and an increase in between-study variation was observed (I2 = 73.8%)
DISCUSSION
The aim of our study was to investigate the effect of paratuberculosis on milk yield. Using either ELISA positivity or fecal detection as the case definition re-sulted in a statistically significant reduction in milk yield associated with paratuberculosis, albeit with varying levels of between-study heterogeneity.
Pooling of study data could be justified for studies using fecal detection methods given the acceptable level of between-study variation. In this instance the calculated combined effect was −1.87 kg/cow per day
or −576.45 kg/cow per 305 d of lactation, estimated at −5.90% of milk yield. This figure represents the de-viation in milk yield in the lactation corresponding to when the animal tests positive for paratuberculosis and is corrected for the lactation number or age of the cow and the herd of origin of the animal.
[image:7.612.120.514.74.415.2]Interestingly, point estimates from studies utilizing fecal culture as the case definition tended to find a de-viation in milk yield that was greater than that found by studies utilizing ELISA as the diagnostic test. One possible explanation for this is that the specificity of fecal culture is assumed to be close to 100%, whereas ELISA specificity is generally reported to be somewhat less than fecal culture (Nielsen and Toft, 2008). Positive predictive values of test-positive animals vary strongly according to prevalence (Brenner and Gefeller, 1997); therefore, in low animal-level seroprevalence condi-tions, such as paratuberculosis, a greater proportion of false positive serological results may be expected. It is likely that the ELISA case definition may have falsely
identified a proportion of animals as infected, possibly resulting in under-estimation of the effect of infection. Estimates of the pooled serology studies are included for discussion; however, the substantial between-study heterogeneity would suggest that pooling of these esti-mates was not justified. The characteristics of diagnos-tic tests are assumed to vary within and among animal populations (Greiner and Gardner, 2000). This varia-tion may be greater in serological testing than in fecal culture, possibly resulting in greater variation between populations and, therefore, between studies.
It is possible that a culling bias may have affected the validity of the effect estimates reported in the studies analyzed here. In this case, a culling bias would mani-fest as an underestimation of the detrimental effect of paratuberculosis on milk production. Low-producing animals within the test-positive population would likely
be disproportionally culled from the herd, resulting in an inflated estimate of milk yield in the test-positive population.
[image:8.612.87.499.78.434.2]Several other factors are likely to affect any effect estimate. Smith et al. (2009) found that latently in-fected animals and low-fecal shedding cows produced more milk than uninfected herdmates, with a decline in milk production only observed in high-shedding ani-mals. Similarly, Nielsen et al. (2009) investigated the time to the occurrence of a milk drop in animals with different antibody profiles and discovered that cows that became test positive may produce more milk than negative herdmates 200 to 400 d before testing posi-tive. Therefore, stage of infection is likely an important effect modifier at the individual animal level. Stage-specific definitions of infected, infectious, and affected are often used with regard to paratuberculosis (Nielsen
and Toft, 2008). However, analysis at this level was not possible given the case definitions used in the studies available. The case definition instead was diagnostic test positivity either by serological or organism-detec-tion methods. This case definiorganism-detec-tion excludes the infected or latent subgroup, and is primarily an estimation of infections, although it is likely that a small number of affected animals would also be included in the analysis.
The majority of models in this analysis concluded that paratuberculosis was associated with a statisti-cally significant decline in milk production. However, the magnitude of the deviation represents a relatively modest decline in milk yield at the individual animal level. Herd-level production losses, and therefore the fi-nancial cost of the disease to the farmer, will ultimately depend on the within-herd prevalence. As discussed, these reductions are likely to be most representative of the subclinically infected infectious population of cows in the herd, and it is expected that production losses for animals displaying clinical signs will be much greater. Therefore, the financial cost to the farmer will also depend heavily on the relative proportions of latent, infectious, and affected animals within the herd. Interestingly, Donat et al. (2014) investigated
the effect of within-herd prevalence on the magnitude of the deviation in individual animal milk yield and found a greater decline associated with test positivity in herds where a greater within-herd prevalence was recorded. This observation is relatively recent and has not been reported in a sufficient number of studies to allow formal comparison. However, a possible explana-tion for this finding is that the relative proporexplana-tion of infectious and affected animals, as diagnosed through fecal culture or ELISA, is likely to vary according to within-herd prevalence. Diagnostic test sensitivity is known to increase with disease progression; therefore, the population of diagnostic test-positive animals in a herd with a high prevalence is likely to contain a greater proportion of animals in the advanced stages of the disease as compared with a herd with a low within-herd prevalence. This may be reflected as a greater reduction in milk yield in the test-positive population.
[image:9.612.122.520.75.356.2]Analysis of milk constituents was hindered by the relatively low number of studies that reported on this outcome. However, a pooled estimate could be calculat-ed for the association between diagnostic test positivity on milk fat production. In this case, the decline in milk fat yield was around 22.1 g/cow per day or 6.75 kg/cow
Figure 4. A forest plot of the effect size (ES) and 95% confidence intervals (CI) for studies investigating the association between paratuber-culosis diagnostic test positivity and deviation in milk protein yield (g/cow per day) in individual cows compared with test-negative herdmates. The studies have been subgrouped according case definition. Point estimates and CI for each study are presented on each line. Relative weighting of each study is represented by the gray box surrounding the point estimate. Combined effect estimates (◊) are presented at the bottom of each subgroup. Studies are listed by first author’s last name and year only.
[image:10.612.105.488.428.695.2]per 305 d of lactation, equivalent to a 2% reduction in milk fat production. Again, this finding suggests a modest effect of paratuberculosis on milk production at the individual animal level. A pooled estimate could not be calculated for protein yield given the large between-study heterogeneity observed in these studies.
CONCLUSIONS
This systematic review and meta-analysis demon-strated that, although paratuberculosis was associated with a statistically significant decline in milk produc-tion, the magnitude of the decline was relatively mod-est. A pooled effect estimate was only indicated for studies that used fecal organism detection as the case definition. In this instance, a decline in milk production associated with diagnostic test positivity of 1.87 kg/ cow per day (95% CI = 2.34, 1.40) was found; this was calculated to be equivalent to 5.9% of overall produc-tion.
ACKNOWLEDGMENTS
This study was carried out as part of the ICONMAP multidisciplinary research program, funded by the Irish Department of Agriculture, Food and the Marine.
REFERENCES
Abbas, B., H. Riemann, and D. Hird. 1983. Diagnosis of Johne's dis-ease (paratuberculosis) in northern California cattle and a note on its economic significance. Calif. Vet. 8:20–24.
Aly, S. S., R. Anderson, J. Adaska, J. Jiang, and I. Gardner. 2010. Association between Mycobacterium avium subspecies paratuber-culosis infection and milk production in two California dairies. J. Dairy Sci. 93:1030–1040.
Ansari-Lari, M., M. Haghkhah, and F. Mahmoodi. 2012. Association of Mycobacterium avium subspecies paratuberculosis infection with milk production and calving interval in Iranian Holsteins. Trop. Anim. Health Prod. 44:1111–1116.
Beaudeau, F., M. Belliard, A. Joly, and H. Seegers. 2007. Reduction in milk yield associated with Mycobacterium avium subspecies para-tuberculosis (Map) infection in dairy cows. Vet. Res. 38:625–634. Benedictus, G., A. A. Dijkhuizen, and J. Stelwagen. 1986. The
eco-nomic losses due to paratuberculosis in cattle. Pages 288–291 in Fourteenth World Congress on Diseases of Cattle Dublin, Ireland. Irish Cattle Veterinary Association, Ireland.
Benedictus, G., A. A. Dijkhuizen, and J. Stelwagen. 1987. Economic losses due to paratuberculosis in dairy cattle. Vet. Rec. 121:142– 146.
Blettner, M., W. Sauerbrei, B. Schlehofer, T. Scheuchenpflug, and C. Friedenreich. 1999. Traditional reviews, meta-analyses and pooled analyses in epidemiology. Int. J. Epidemiol. 28:1–9.
Brenner, H., and O. Gefeller. 1997. Variation of sensitivity, specific-ity, likelihood ratios and predictive values with disease prevalence. Stat. Med. 16:981–991.
Buergelt, C. D., and J. Duncan. 1978. Age and milk production data of cattle culled from a dairy herd with paratuberculosis. J. Am. Vet. Med. Assoc. 173:478–480.
Chaffer, M., K. Grinberg, E. Ezra, and D. Elad. 2002. The effect of sub-clinical Johne’s disease on milk production, fertility and milk
quality in Israel. Pages 351–352 in Proc. 7th Int. Colloq. Paratu-berculosis, Bilbao, Spain. International Association for Paratuber-culosis, Bilbao, Spain.
Chi, J., J. A. VanLeeuwen, A. Weersink, and G. P. Keefe. 2002. Direct production losses and treatment costs from bovine viral diarrhoea virus, bovine leukosis virus, Mycobacterium avium subspecies para-tuberculosis, and Neospora caninum. Prev. Vet. Med. 55:137–153. Chiodini, R. J., W. M. Chamberlin, J. Sarosiek, and R. W.
McCal-lum. 2012. Crohn's disease and the mycobacterioses: A quarter century later. Causation or simple association? Crit. Rev. Micro-biol. 38:52–93.
Collins, M. T. N. K. 1991. Milk Production levels in cows ELISA posi-tive for serum antibodies to M. paratuberculosis Page 23 in Proc. 3rd Int. Colloq. Paratuberculosis. Orlando, FL. International As-sociation for Paratuberculosis, Orlando, FL.
Deeks, J. J., Higgins, J. and Altman, D. G. 2008. Analysing data and undertaking meta-analyses. Pages 243–296 in Cochrane Handbook for Systematic Reviews of Interventions: Cochrane Book Series. John Wiley & Sons Ltd, Chichester, UK.
DeLisle, G. W. d., and B. A. Milestone. 1989. The economic impact of Johne's disease in New Zealand. Pages 41–45 in Johne’s Disease: Current Trends in Research, Diagnosis and Management. A. R. Milner and P. R. Wood, ed. CSIRO, Melbourne, Australia. Dinsmore, R. P. 1986. Effects of paratuberculosis in a research dairy
herd. Page 20 in Proc. 3rd Northeast Region Meeting on Paratu-berculosis, Ithaca, NY. International Association for Paratubercu-losis, Ithaca, NY.
Donat, K., A. Soschinka, G. Erhardt, and H. R. Brandt. 2014. Paratu-berculosis: Decrease in milk production of German Holstein dairy cows shedding Mycobacterium avium ssp. paratuberculosis depends on within-herd prevalence. Animal 8:852–858.
EFSA. 2010. Application of systematic review methodology to food and feed safety assessments to support decision making. EFSA J. 8:1637.
Egger, M., G. D. Smith, M. Schneider, and C. Minder. 1997. Bias in meta-analysis detected by a simple, graphical test. BMJ 315:629– 634.
Garcia, A. B., and L. Shalloo. 2015. Invited review: The economic impact and control of paratuberculosis in cattle. J. Dairy Sci. 98:5019–5039.
Geraghty, T., D. A. Graham, P. Mullowney, and S. J. More. 2014. A review of bovine Johne's disease control activities in 6 endemically infected countries. Prev. Vet. Med. 116:1–11.
Gonda, M. G., Y. Chang, G. Shook, M. Collins, and B. Kirkpatrick. 2007. Effect of Mycobacterium paratuberculosis infection on pro-duction, repropro-duction, and health traits in US Holsteins. Prev. Vet. Med. 80:103–119.
Goodell, G., H. Hirst, F. Garry, and P. Dinsmore. 2000. Comparison of cull rates and milk production of clinically normal dairy cows grouped by ELISA Mycobacterium avium paratuberculosis serum antibody results. Abstract ID 579 in Proc. Int. Symposium Vet. Epidemiol. Econ., Breckenridge, CO. International Society for Vet-erinary Epidemiology and Economics, Colorado State Univ., Ft. Collins.
Greiner, M., and I. A. Gardner. 2000. Epidemiologic issues in the validation of veterinary diagnostic tests. Prev. Vet. Med. 45:3–22. Harris, R., M. Bradburn, J. Deeks, R. Harbord, D. Altman, and J.
Sterne. 2008. Metan: Fixed-and random-effects meta-analysis. Stata J. 8:3–28.
Hendrick, S. H., T. F. Duffield, D. F. Kelton, K. E. Leslie, K. D. Lis-semore, and M. Archambault. 2005. Evaluation of enzyme-linked immunosorbent assays performed on milk and serum samples for detection of paratuberculosis in lactating dairy cows. J. Am. Vet. Med. Assoc. 226:424–428.
Higgins, J., and S. Green. 2011. Cochrane Handbook for Systematic Reviews of Interventions Version 5.1. The Cochrane Collaboration. Accessed Jun. 1, 2015. http://www.cochrane-handbook.org. Higgins, J. P., and S. G. Thompson. 2002. Quantifying heterogeneity
in a meta-analysis. Stat. Med. 21:1539–1558.
Hoogendam, K., E. Richardson, and J. F. Mee. 2009. Paratuberculosis sero-status and milk production, SCC and calving interval in Irish dairy herds. Ir. Vet. J. 62:265–271.
Johnson, Y. J., J. Kaneene, J. Gardiner, J. Lloyd, D. Sprecher, and P. Coe. 2001. The effect of subclinical Mycobacterium paratuberculo-sis infection on milk production in Michigan dairy cows. J. Dairy Sci. 84:2188–2194.
Kudahl, A., S. S. Nielsen, and J. T. Sørensen. 2003. Effects of paratu-berculosis on productivity in Danish dairy cows. Acta Vet. Scand. 44:P96.
Kudahl, A., S. S. Nielsen, and J. T. Sørensen. 2004. Relationship between antibodies against Mycobacterium avium ssp. paratuber-culosis in milk and shape of lactation curves. Prev. Vet. Med. 62:119–134.
Lombard, J. E., F. B. Garry, B. J. McCluskey, and B. A. Wagner. 2005a. Risk of removal and effects on milk production associated with paratuberculosis status in dairy cows. J. Am. Vet. Med. As-soc. 227:1975–1981.
Lombard, J. E., B. A. Wagner, B. J. McCluskey, and F. B. Garry. 2005b. Production effects of Mycobacterium avium subspecies paratuberculosis infection based on diagnostic test results. Page 189 in Proc. 38th Am. Assoc. Bovine Pract. Conf., Salt Lake City, UT. American Association of Bovine Practitioners. Stillwater, OK. Nielsen, S. S., M. A. Krogh, and C. Enevoldsen. 2009. Time to the
occurrence of a decline in milk production in cows with various paratuberculosis antibody profiles. J. Dairy Sci. 92:149–155. Nielsen, S. S., and N. Toft. 2008. Ante mortem diagnosis of
paratuber-culosis: A review of accuracies of ELISA, interferon-γ assay and faecal culture techniques. Vet. Microbiol. 129:217–235.
Nordlund, K. V., W. Goodger, J. Pelletier, and M. Collins. 1996. Asso-ciations between subclinical paratuberculosis and milk production, milk components, and somatic cell counts in dairy herds. J. Am. Vet. Med. Assoc. 208:1872–1876.
Ott, S. L., S. J. Wells, and B. A. Wagner. 1999. Herd-level economic losses associated with Johne's disease on US dairy operations. Prev. Vet. Med. 40:179–192.
Pantoja, J., B. Vallejo, and J. Acosta. 2010. Bovine paratuberculosis in Puerto Rican dairy herds and its association with selected per-formance parameters. J. Agric. Univ. P R. 94:247–254.
Pavlík, I., M. Pavlas, and L. Bejþková. 1994. Incidence, economic im-portance and diagnosis of paratuberculosis. Veterinarni Medicina 39:451–496.
Rad, A. H. F., M. R. Bassami, and A. Mirzapoor. 2010. Prevalence of MAP in a large dairy herd and its effect on reproductive and production indices. J. Anim. Vet. Adv. 9:149–154.
Raizman, E. A., J. Fetrow, S. J. Wells, S. M. Godden, M. J. Oakes, and G. Vazquez. 2007. The association between Mycobacterium avium ssp. paratuberculosis fecal shedding or clinical Johne's disease and lactation performance on two Minnesota, USA dairy farms. Prev. Vet. Med. 78:179–195.
Raizman, E. A., J. P. Fetrow, and S. J. Wells. 2009. Loss of income from cows shedding Mycobacterium avium subspecies paratubercu-losis prior to calving compared with cows not shedding the organ-ism on two Minnesota dairy farms. J. Dairy Sci. 92:4929–4936. Richardson, E., and S. J. More. 2009. Direct and indirect effects of
Johne's disease on farm and animal productivity in an Irish dairy herd. Ir. Vet. J. 62:526.
Shook, G. E., M. Chaffer, X. L. Wu, and E. Ezra. 2012. Genetic pa-rameters for paratuberculosis infection and effect of infection on production traits in Israeli Holsteins. Anim. Genet. 43:56–64. Sibley, R. J., P. G. Orpin, and H. L. Pearse. 2012. Fertility, udder
health and milk production in cows that have high milk
antibod-ies to paratuberculosis. Pages 194–195 in Proc. 11th Int. Colloq. Paratuberculosis, Sydney, Australia. International Association for Paratuberculosis, Sydney, Australia.
Smith, R. L., Y. Grohn, A. Pradhan, R. Whitlock, J. Van Kessel, J. Smith, D. Wolfgang, and Y. Schukken. 2009. A longitudinal study on the impact of Johne's disease status on milk production in indi-vidual cows. J. Dairy Sci. 92:2653–2661.
Sorge, U., D. Kelton, J. Jansen, A. Godkin, and R. Cantin. 2007. Asso-ciation between paratuberculosis milk ELISA test result and milk production and breed in dairy cows. Page 228 in Proc. 40th Am. Assoc. Bovine Pract. Conf. Vancouver, British Colombia, Canada. Sorge, U. S., K. Lissemore, A. Godkin, S. Hendrick, S. Wells, and D.
Kelton. 2011. Associations between paratuberculosis milk ELISA result, milk production, and breed in Canadian dairy cows. J. Dairy Sci. 94:754–761.
Spangler, E., S. Bech Nielsen, and L. E. Heider. 1988. A study of sub-clinical paratuberculosis in three central Ohio dairy herds. Acta Vet. Scand. Suppl. 84:148–150.
Stott, A. W., G. M. Jones, R. W. Humphry, and G. J. Gunn. 2005. Financial incentive to control paratuberculosis (Johne's disease) on dairy farms in the United Kingdom. Vet. Rec. 156:825–831. Stroup, D. F., J. A. Berlin, S. C. Morton, I. Olkin, G. D. Williamson,
D. Rennie, D. Moher, B. J. Becker, T. A. Sipe, and S. B. Thacker. 2000. Meta-analysis of observational studies in epidemiology: A proposal for reporting. JAMA 283:2008–2012.
Sweeney, R., L. Hutchinson, R. Whitlock, D. Galligan, and P. Spencer. 1994. Effect of Mycobacterium paratuberculosis infection on milk production in dairy cattle. Pages 133–139 in Proc. 4th Int. Colloq. Paratuberculosis, Cambridge, UK. International Association for Paratuberculosis, Cambridge, UK.
Sweeney, R. W., M. T. Collins, A. P. Koets, S. M. McGuirk, and A. J. Roussel. 2012. Paratuberculosis (Johne's disease) in cattle and other susceptible species. J. Vet. Intern. Med. 26:1239–1250. Tiwari, A., J. A. VanLeeuwen, I. R. Dohoo, G. P. Keefe, J. Haddad,
R. Tremblay, H. Scott, and T. Whiting. 2007. Production effects of pathogens causing bovine leukosis, bovine viral diarrhea, para-tuberculosis, and neosporosis. J. Dairy Sci. 90:659–669.
USDA. 2015. National Statistics for Milk. USDA-National Agricultural Statistics Service. Accessed Oct. 1, 2015. http://www.nass. usda.gov/Statistics_by_Sub ject/result.php?4B229587-F308-34B9-8E3F-A02380B426BD§or=ANIMALS%20%26%20 PRODUCTS&group=DAIRY&comm=MILK.
VanLeeuwen, J. A., G. P. Keefe, and A. Tiwari. 2002. Seroprevalence and productivity effects of infection with bovine leukemia virus, Mycobacterium avium subspecies paratuberculosis, and Neospora caninum in maritime Canadian dairy cattle. Bovine Pract. 36:86– 91.
Villarino, M. A., H. Scott, and E. Jordan. 2011. Influence of parity at time of detection of serologic antibodies to subspecies on reduction in daily and lifetime milk production in Holstein cows. J. Anim. Sci. 89:267–276.
Whitlock, R. H., L. J. Hutchinson, R. S. Merkal, L. T. Glickman, C. Rossiter, S. Harmon, P. Spencer, J. Fetrow, J. Bruce, C. E. Ben-son, and J. Dick. 1985. Prevalence and economic considerations of Johne's disease in Northeastern US. Pages 484–490 in 89th Annual Meeting US Anim. Health Assoc. Milwaukee, WI.