warwick.ac.uk/lib-publications
Manuscript version: Author’s Accepted Manuscript
The version presented in WRAP is the author’s accepted manuscript and may differ from the published version or Version of Record.
Persistent WRAP URL:
http://wrap.warwick.ac.uk/109060
How to cite:
Please refer to published version for the most recent bibliographic citation information. If a published version is known of, the repository item page linked to above, will contain details on accessing it.
Copyright and reuse:
The Warwick Research Archive Portal (WRAP) makes this work by researchers of the University of Warwick available open access under the following conditions.
© 2018 Elsevier. Licensed under the Creative Commons
Attribution-NonCommercial-NoDerivatives 4.0 International http://creativecommons.org/licenses/by-nc-nd/4.0/.
Publisher’s statement:
Please refer to the repository item page, publisher’s statement section, for further information.
Effect of weld parameters on porosity formation in electron beam welded Zircaloy-4 joints: X-ray tomography study
Bharath Bandi, Soumitra Kumar Dinda, Jyotirmaya Kar, Gour Gopal Roy, Prakash Srirangam
PII: S0042-207X(18)31259-4
DOI: 10.1016/j.vacuum.2018.09.060 Reference: VAC 8273
To appear in: Vacuum
Received Date: 17 July 2018 Revised Date: 28 September 2018 Accepted Date: 29 September 2018
Please cite this article as: Bandi B, Dinda SK, Kar J, Roy GG, Srirangam P, Effect of weld parameters on porosity formation in electron beam welded Zircaloy-4 joints: X-ray tomography study, Vacuum
(2018), doi: https://doi.org/10.1016/j.vacuum.2018.09.060.
M
AN
US
CR
IP
T
AC
CE
PT
ED
1
Effect of weld parameters on porosity formation in Electron Beam Welded
Zircaloy-4 Joints: X-ray tomography study
Bharath Bandi1, Soumitra Kumar Dinda1, JyotirmayaKar1, Gour Gopal Roy1, Prakash Srirangam2.
1
Department of Metallurgical and Materials Engineering, Indian Institute of Technology-Kharagpur, India.
2Warwick Manufacturing Group (WMG), University of Warwick, Coventry, CV4 7AL, UK
*Corresponding author email: [email protected]
Abstract:
Zircaloy-4 to Zircaloy-4 (Zr-4) similar butt joints were prepared using Electron Beam
Welding (EBW) technique under different weld conditions such as with beam oscillation,
without beam oscillation and at different welding speeds. Three-dimensional (3D)
visualization of porosity in weld joints was carried out using X-ray computed tomography
(XCT) technique. Quantification of porosity such as the average size, number and shape of
the pores were evaluated and compared among weld joints produced under different
conditions. XCT results show that the porosity of the welds increased substantially with the
increase in the weld speed. More interestingly, the results also show that there is a significant
decrease in porosity of the joint produced with beam oscillation condition. An increase in
weld speed from 700 mm/min to 1000 mm/min resulted in a significant increase in pore
density (from 16 to 313 per mm3) and it was observed that the average size of the macro
pores increased from 96.4 µm to 121.5 µm. The joints prepared with beam oscillation
produced least number of pores with minimum percentage of macro pores and maximum
percentage of spherical pores in it. Raman spectroscopy results confirmed the presence of
hydrogen gas in pores of all the weld joints.
Keywords: Zircaloy-4, Electron beam welding (EBW), Beam Oscillation, X-ray computed
M
AN
US
CR
IP
T
AC
CE
PT
ED
2
1. Introduction
Zircaloy-4 (Zr-4) is widely used as a structural material for containing radioactive fuel pellets
in nuclear industries due to its low thermal neutron absorption cross section, excellent
corrosion resistance, irradiation stability, and mechanical properties [1]. Owing to its
excellent corrosion resistance, Zr-4 is also used as dissolver assemblies, heat exchangers etc
in fast breeder reactor reprocessing plants [2]. In nuclear reactors Zr-4 is used to make
components like fuel claddings, pressure tubes, and spacer grid assembly materials [3,4,5].
Zr-4 cladding with fuel pellets have to be sealed at both ends by welding end of the tubes to
end caps and these weld joints should be strong enough to contain the fuel pellets during
operating conditions [6]. The main requirements for the weld joints in the spacer grid
assembly is to have minimum weld bead size to resist wear to nuclear fuel rods, and have
maximum penetration of weld to meet the required mechanical strength such that it can
effectively provide vertical and horizontal support to the fuel rods [7,8,9]. In all above
applications, the strength and durability of Zr-4 to Zr-4 welds are very crucial for safe and
smooth functioning of nuclear industries. More importantly, to produce a weld joint with a
narrow weld bead size at a particular amount of weld penetration, a welding technique with
high power density must be employed. In comparison to other conventional fusion arc
welding processes, electron beam welding (EBW) is an effective welding technique as it
offers advantages such as high power density, high depth to width ratio, high penetration,
low heat input, small heat affected zone (HAZ) etc. [10,11,12].
The complex heating and cooling cycles associated with welding process often lead to
formation of weld defects such as porosity, worm holes, cracks, incomplete fusion etc.
[13,14,15,16]. Despite high vacuum conditions (in the level of 10-5 mbar), chances of
M
AN
US
CR
IP
T
AC
CE
PT
ED
3
the mechanical properties of EB-welded Zr-4 sheets and observed porosity in the weld joints
[19]. Moreover, this porosity formation greatly affects the mechanical and corrosion
properties of weld joints. For instance Mishra et al. studied the effect of end plug weld defect
on the operation of nuclear reactor and observed that the weld defect lead to extensive fuel
reconstructing, fuel oxidation, cladding oxidation and hydride blister formation [20].
Similarly, Tao et al. found that the crack initiation during the tensile tests of laser spot welded
Zr-4 spacer grid assembly started at gas pores in the weld region[21]. Hence, it is apparent
from the literature that the formation of weld defects in Zr-4 joints is one of the major
problems in nuclear industries. For this reason a proper understanding with detailed
quantification of weld defects with respect to various weld parameters is crucial. In the past,
various researchers have used X-ray computed tomography (XCT) technique to understand
these weld defects. Nomoto et al. studied the porosity formation in various laser-welded
samples using XCT technique and found that the tensile properties were greatly deteriorated
by porosity in the welds [22]. Using XCT technique, Kar et al. recently concluded that the
application of beam oscillation reduced the porosity content in EB-welded
copper-304stainless steel joints [23]. Similar decrease in porosity content with the application of
beam oscillation is seen by Dinda et al. in the EB welded steel – Fe Al alloy [17]. In this
study along with the effect of beam oscillation, effect of weld speed on porosity formation in
EB welded Zr-4 joints is studied. This is necessary because the increase in weld speed
generally leads to finer microstructure and consequently better mechanical properties because
of faster cooling rates. However, the mechanical properties of the joints are also dependent on
porosity formation which can be influenced by weld parameters like weld speed and beam
oscillation.
From the past research work, it is evident that the porosity formation in the Zr-4 weld joints
M
AN
US
CR
IP
T
AC
CE
PT
ED
4
formation not only to optimize weld parameters, but also to improve the mechanical
properties and structural integrity of the materials. In this publication, we used X-ray
tomography study for the first time for 3D visualisation and quantification of porosity in EB
welded Zr-4 joints under different weld conditions.
2. Experimental Procedure
2.1 Materials
Zircaloy-4 plates of 4 mm thickness were procured from Nuclear Fuel Complex (NFC),
Hyderabad, India. As received sheets were analysed by X-ray spectroscopy for chemical
analysis. Table 1 represents the chemical composition of Zr-4 plates. As received sheets
were cut into plates of dimensions 100 mm x 50 mm x 4 mm and then polished with 320-grit
emery paper. Prior to welding, plates were cleaned with acetone and placed into the welding
fixtures along the longitudinal direction in a butt joint position.
Table 1: Chemical composition (by weight percentage)
Elements Sn Cr Ni Fe Nb Zr
Weight % 1.4 0.1 <0.005 0.23 0.1 98.17
2.2 Electron Beam Welding
Joining of Zircaloy-4 plates was carried out using 80 kV-12kW Electron Beam Welding
machine at Indian Institute of Technology (IIT) Kharagpur, India. The power input of the
electron beam was optimised to obtain full penetration on the Zr-4 plate. After obtaining
complete penetration at a lowest possible power input, joints were prepared at four different
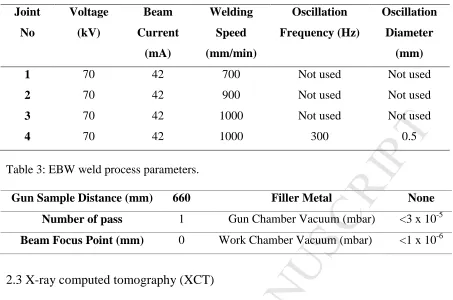
parameters. Table 2 represents the weld parameters used in this study. To study the effect of
beam oscillation, the oscillating beam was used for weld speed 1000 mm/min. Table 3
represents the weld variables used in this study.
M
AN
US
CR
IP
T
AC
CE
PT
ED
5 Joint No Voltage (kV) Beam Current (mA) Welding Speed (mm/min) Oscillation Frequency (Hz) Oscillation Diameter (mm)1 70 42 700 Not used Not used
2 70 42 900 Not used Not used
3 70 42 1000 Not used Not used
[image:7.595.66.519.68.368.2]4 70 42 1000 300 0.5
Table 3: EBW weld process parameters.
Gun Sample Distance (mm) 660 Filler Metal None Number of pass 1 Gun Chamber Vacuum (mbar) <3 x 10⁻⁵
Beam Focus Point (mm) 0 Work Chamber Vacuum (mbar) <1 x 10⁻⁶
2.3 X-ray computed tomography (XCT)
X-ray computed tomography (XCT) studies were performed using a phoenix nanotom
computed tomography (GE-Phoenix® model: V/TOME/XS) with 180 kV high-power
Nano-focus tube with the sub-micron range in voxel size. This enabled 3D visualisation of the
welds and quantification of porosity in the joints.
The weld samples were cut into 10 mm x 4 mm x 4 mm dimensions such that the cut pieces
have fusion zone (FZ), HAZ and base metal in the XCT scan region in them. These cuts are
taken from the centre of the weld samples such that the inhomogeneity in the weld beam
which occurs at the ends of the welding samples will be avoided. A schematic representation
of weld sample with the cut position of the XCT sample is shown in Figure 1. Samples were
polished and cleaned with acetone. This sample was placed on a rotating platform between
X-ray source and the detector and when X-rays pass though this sample a distinct grey scale
radiograph is produced on the detector screen. The sample was placed in such a way that the
weld was in the centre of the field of view of X- ray machine. The source and detector were
M
AN
US
CR
IP
T
AC
CE
PT
ED
6
objective the combined resolution resulted to be 1.6µm. Numerous radiographic projections
were taken throughout the 3600 of the sample and back projected to reconstruct the virtual 3D
volume of it. This volume consists of an array of pixels called voxels with an associated grey
value between 0 and 65535 proportional to the relative attenuation/absorption of the x-rays
by the material. Table 4 shows the parameters used in the XCT scans.
Figure 1: Schematic representation of weld sample and the corresponding position of XCT
sample.
Table 4: XCT process parameters used in this study.
Parameters Values
Voltage (kV) 150
Current (µA) 60
Timing (ms) 500
Filter (Cu-mm) 0.5
Number of Projections 1800
FOD (mm) FDD (mm)
39.5
M
AN
US
CR
IP
T
AC
CE
PT
ED
7
2.4 Raman Spectroscopy:
Raman spectroscopy technique was used to identify the entrapped gases in the heat-affected
zones (HAZ) and fusion zones of all the four joints. The significant advancement of laser and
photon detector technology in recent times made Raman spectroscopy a prominent technique
in analysing gases present in the materials [24]. For this analysis, joints were cut into
rectangular pieces of dimensions of 4 x 4 x 2 mm3 from welded samples, polished by fine
emery paper and cleaned with acetone. Raman spectroscopy machine details and process
parameters used as listed in Table 5 below.
Table 5: Raman Spectroscopy machine details and process parameters.
Excitation Source Argon-krypton mixed ion gas laser (wavelength 514 nm)
Spectrometer Model T64000, Argon-krypton Laser)
Detector Thermoelectric cooled front illuminated 1024 256 CCD.
Collection optics Optical Microscope Model BX41
Focal Length (mm) 620
Frequency (cm-1) 100
Step size (nm) 0.0007
Grating (grooves/mm) 1800
3. Results and Discussion
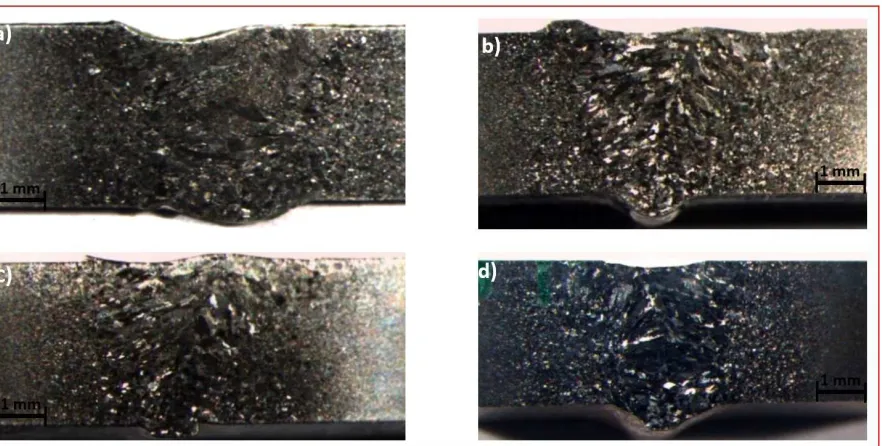
The macrographs of the etched samples of all the joints is shown in Figure 2. It is observed
that the length of fusion zone, heat affected zone and undercut decreased with increase in the
weld speed of the joints. This is due to the fact that, as the welding speed decreases the
electron beam stays on the specimen for a longer time. So, this increases the heat input into
the specimen, which in turn increases the fusion zone and heat affected zone. Also at a given
welding speed the oscillation beam condition will always have lesser heat input per unit
M
AN
US
CR
IP
T
AC
CE
PT
ED
8
oscillation beam condition the electron beam travels more distance per unit time. Because of
this the fusion zone, heat affected zone and undercut for oscillation samples was found to be
[image:10.595.81.522.165.388.2]less than the non- oscillation samples.
Figure 2: Macrographs of the weld samples: a) Joint 1, b) Joint 2, c) Joint 3, and d) Joint 4.
The optical micrographs shown in Figure 3 reveal the presence of porosity in the FZ’s of all
the joints. These images also suggests that the number of pores in the FZ increased with
increase in weld speed and decreased with the application of beam oscillation. However, this
inference cannot be taken as true for the whole joint, as these images only represent a tiny
portion of the complete joints and can be easily misrepresented just by selecting different
portions in the same joint. Moreover, the size and shape quantifications of the pores cannot
be done in a systematic and reliable way using these 2D images. Figure 3 e) also shows the
presence of porosity in the base metal, although it was very rarely found in insignificant
M
AN
US
CR
IP
T
AC
CE
PT
ED
9
Figure 3: Optical micrographs showing pores in a). Joint 1 (FZ), b). Joint 2 (FZ), c) Joint 3
(FZ), d). Joint 4 (FZ), and e) Base metal.
Figure 4 shows the 3D reconstructed porosity distribution in Zr-4 joints for different weld
conditions. Due to the obvious density difference between the matrix (Zircaloy-4) and pores,
[image:11.595.70.526.51.620.2]M
AN
US
CR
IP
T
AC
CE
PT
ED
10
matrix. In case of without beam oscillation, porosity was found to increase with increase in
weld speed as represented in figure 4 (a) to 4(c). Higher the weld speed, higher the cooling
rate which results in entrapment of gases in the matrix. However, it is evident from Figure 4
(d) that the application of beam oscillation resulted in less porosity as compared to without
beam oscillation. The main reason for this significant decrease in porosity with beam
oscillation is due to the improved churning action in the molten pool, and also due to the
repeated melting of the same spot in the weld track. It should be noted that even though there
is some porosity visible in the base metal of some joints, it has been carefully removed from
M
AN
US
CR
IP
T
AC
CE
PT
ED
[image:13.595.70.546.64.356.2]11
Figure 4: 3D Reconstructed welds with matrix and porosity: (a) Joint 1, (b) Joint 2, (c) Joint
3, and (d) Joint 4 (with oscillation).
XCT data is further analysed and the quantified data of porosity in joints for all weld
conditions is shown in Table 6. The average pore size of Joint 1, Joint 2, Joint 3 and joint 4
was found to be 24.9 µ m, 21.7 µm, 17.3 µm 15.8 µm respectively. This represents that the
application of beam oscillation (joint 4) resulted in small size of pores compared to without
beam oscillations. As there is a clear difference between the number of pores produced by the
joints and their respective size distributions, comparison between their overall average sizes
might not give the complete information. So, the average pore sizes for macro and micro
pores were calculated and compared. The average pore size of the macro pores (dia > 75 µm)
among all the joints is highest in the joint produced at highest welding speed (1000 mm/min).
However, with the application of oscillation beam and maintaining the same welding speed,
the average pore size of the macro pores has decreased to 79.6 µm which is found to be the
M
AN
US
CR
IP
T
AC
CE
PT
ED
12
8.5 µm and 8.3 µm in Joint 1, Joint 2, and Joint 3 respectively. But, the minimum pore
diameter in Joint 4 (beam oscillation) is decreased to 6.7 µm. The maximum pore diameter is
found to be 137.4 µm and 112.6 µm for Joint 1 and Joint 2 respectively. The maximum pore
diameter in the case of highest welding speed has increased to 184.7 µm, while it decreased
to 87.7 µm in the case of oscillation for Joint 4. The total number of pores has significantly
increased as the welding speed increased from Joint 1 to Joint 3. The total number of pores
found in Joint 1, Joint 2, and Joint 3 are 295, 779, and 4471 respectively. On the other hand,
with beam oscillation condition, in Joint 4 the total number of pores decreased to 161, lowest
among all joints. It is also seen that the number of macro pores with diameter greater than 75
µm is least in the oscillation condition of Joint 4 (3 pores), and highest in the Joint 3 (10
pores). Volume of the maximum pore diameter was highest in Joint 3 and lowest in Joint 4
(beam oscillation) i.e., 1.87 x 106µm3 and 2.23 x 105µm3 respectively. From the quantified
data in Table 6 below, it was evident that the pore density has increased with welding speed
from 16 pores /mm3 in Joint 1 to 46 pores/mm3 in Joint 2 to 313 pores/mm3 in Joint 3.
However, with the application of beam oscillation in Joint 4 the pore density decreased to 10
pores/mm3. All the quantified data clearly points out that high welding speed increases the
average size and number of pores in the joints. This is due to the fact that there would be very
less time for the gas to escape from the surface but enough time to coalescence to form bigger
pores. It is also evident that the application of beam oscillation effectively reduced the
porosity in the joint 4. This is because the beam oscillation homogenises the weld tract and
multiple melting of same spot allows easy escape of gas. Beam oscillation can be perceived
as the formation and dissolving of tiny weld pools along the oscillation path with significant
overlapping between those tiny pools [25]. In such process a particular location in the weld
track undergoes multiple melting that allows dissolved gases to escape. Therefore, chances
M
AN
US
CR
IP
T
AC
CE
PT
ED
13Table 6: Quantitative comparison of porosity for all the four welding conditions.
Joint No Min. Dia. (µm) Max. Dia. (µm) Avg. Dia. (µm) No. of Pores Average Sphericity Pores/ mm3 No’s having >75 µm Avg. Dia. (µm) >75 µm
Joint 1 9.7 137.4 24.9 295 0.78 16 8.0 96.4
Joint 2 8.5 112.6 21.7 779 0.72 46 7.0 95.9
Joint 3 8.3 184.7 17.3 4471 0.75 313 10.0 121.5
Joint 4 6.7 87.7 15.8 161 0.75 10 3.0 79.6
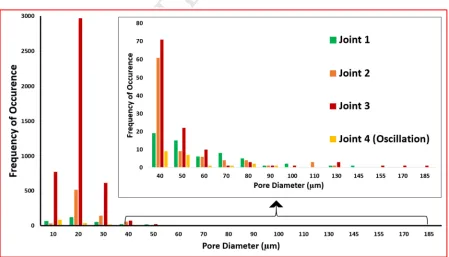
Figure 5 shows the influence of welding speed and beam oscillation on the size and the
frequency of pores of all the joints. The percentage of micro pores is found to be more in
Joint 3 (high welding speed) and Joint 4 (beam oscillation) both for different reasons. In the
case of high speed, the nucleated pores have minimum time to coalescence before the metal
around it gets solidified. This resulted in the high percentage of micro pores. In case of beam
oscillation an improved churning action lead to a better fluidity in the weld pool making the
[image:15.595.74.523.486.743.2]M
AN
US
CR
IP
T
AC
CE
PT
ED
14
Figure 5: Effect of weld parameters on the size and the frequency of pores.
To have a better understanding of the effect of welding speed and beam oscillation, the
largest individual pore in each weld joint is analysed at very high resolution. Largest
individual pore morphology of each joint is shown in Figure 6. It can be seen in Figure 6 that
the largest individual pore in all the Joints (with and without beam oscillation) are having a
smooth spherical morphology. The morphology of the largest pore in the Joint 3 (without
beam oscillation, 1000 mm/min) prepared at high welding speed, as shown in Figure 6 (c),
has a spherical morphology and highest volume than all the other pores of all the joints. It
must also be noted that the Joint 3 has the largest number of micro pores than all the other
joints as shown in Figure 4. For better understanding of pores morphology in all joints,
sphericity of pores was evaluated using the sphericity formula as shown in Eq. 1.
= ………. Eq. 1
Where Ψ is the sphericity, and as Ψ tends to be 1, the pore becomes more spherical in shape.
Ap and Vp are the surface area and the volume of the pores respectively. The calculated
M
AN
US
CR
IP
T
AC
CE
PT
ED
15
Figure 6: Largest individual pore morphology of (a) Joint 1 (137.4 µm), (b) Joint 2 (112.6
[image:17.595.63.529.68.646.2]M
AN
US
CR
IP
T
AC
CE
PT
ED
16
Sphericity calculation for all the pores in all weld joints was calculated and plotted as shown
in Figure 7. The average sphericity of all the micro pores in Joint 1, Joint 2, Joint 3 (highest
welding speed), and Joint 4 (oscillation beam) is 0.73, 0.78, 0.75 and 0.79 respectively. It was
found that more than 95% of all the micro pores in all the joints with diameter less than 60
µm were having a sphericity value greater 0.6. It was further observed that macro pores with
diameter greater than 60 µm have varying sphericity. The percentage of macro pores in Joint
1, Joint 2, Joint 3, and Joint 4 having sphericity greater than 0.6 is 76%, 69%, 8.3%, and 75%
respectively. From this observation it is clear that the sphericity of macro pores is very much
dependent on the weld parameters and the results also imply that the sphericity of macro
pores decrease with welding speed and increases with the application of beam oscillation.
Among all the pores in all the joints, pores in joint 3 (highest speed) were found to have
lowest sphericity values (as low as 0.38). The percentage of pores with sphericity near to
unity is maximum in Joint 4 (with oscillation beam) and minimum in Joint 3 (with highest
welding speed). From all the above results, it is evident that irrespective of their size, pore
sphericity decreases (especially macro pores) with welding speed and increases with the
introduction of beam oscillation. There are three major factors which influence the formation
of porosity in the EB-welded joints i.e., keyhole instability, gas entrapment in the weld, and
solidification shrinkage in the weld pool. The peculiar mechanism of keyhole instability and
its dynamic nature leading to porosity in welds was well discussed by Eriksson et al [26].
Although EBW process is done in high vacuum, gas entrapped in the surfaces of the weld
samples can also lead to porosity formation [27]. It is also concluded in literature that the
spherical pores with smooth surface morphology (high sphericity) can be formed due to
nucleation and growth of gases during solidification in the EBW process [28]. So, the
spherical pores formed in the weld joints might be due to the dissolved gases in the weld pool
M
AN
US
CR
IP
T
AC
CE
PT
ED
17
solidification shrinkage and keyhole instability in the weld joints. The solidification
shrinkage and keyhole instability induced by the fast welding speed and the high cooling rate
has increased the percentage of irregular pores in joint 3. Whereas in Joint 4, the beam
oscillation not only stabilized the keyhole formation and molten metal flow but also
decreased the gas entrapment in the fusion zone. The repeated melting of the same spot
during circular beam oscillation allowed most of the gases to escape from the weld pool. As a
result of these three factors, very less number of pores are formed and the formed pores have
high sphericity in the joint prepared with beam oscillation.
Figure 7: Sphericity variation with respect to the pore diameters of all the joints.
Figure 8 shows the intensity vs Raman shift for all the four joints. For all the four joints, the
peak was observed at around 3050 cm-1 in the Raman shift representing hydrogen [24]. This
can be attributed to the dissolved H2 in the sample getting trapped due to the high cooling
rates in EBW process. It must be noted that the absence of O2 and N2 in the pores is because
M
AN
US
CR
IP
T
AC
CE
PT
ED
[image:20.595.74.526.67.365.2]18
Figure 8: Raman spectroscopy analysis showing H2 gas in all the joints.
From this work it is understood that size, shape and number of pores formed in the
EB-welded Zircaloy-4 joints are very much dependent on the weld parameters. Also, it is evident
that the presence of hydrogen gas is the main reason for porosity formation in EBW
Zircaloy-4 joints.
4. Conclusions:
•Butt-welding of Zircaloy-4 sheets were successfully carried out using EBW process at four
different welding conditions such as without beam oscillation at three different welding
speeds and one with beam oscillation at highest speed.
•3-D porosity images of all the EB-welded joints were successfully captured using X-ray
computed tomography (XCT) techniques, analysed and compared among all joints.
•Higher weld speed (1000 mm/min) without beam oscillation resulted in highest percentage
of macro pores in weld joints. This is because the higher speed will induce higher cooling
rate which consequently decreases the time required for solidification, thereby entrapping
M
AN
US
CR
IP
T
AC
CE
PT
ED
19
•Joints prepared with the application of beam oscillation significantly reduced the number of
pores which are also small in size compared to all other joints. The repeated melting and
solidification coupled by enhanced churning action enabled the gas to escape easily from the
weld joint.
•Sphericity calculation shows that the sphericity of pores increases with the decrease of their
respective sizes thereby indicating small size gas pores.
•Raman spectroscopy confirmed the presence of Hydrogen gas in the pores of all the joints.
•It was clear from this study that the application of beam oscillation results in quality weld
products by decreasing the porosity formation.
5. Acknowledgements
The authors are greatly thankful to the Nuclear Fuel Complex, Hyderabad for supplying
Zircaloy-4 sheets. The authors also thank to Board of Research for Nuclear Science (BRNS)
for financial assistance to carry out the work. The authors also acknowledge Bhabha Atomic
Research Centre (BARC) for donating the EBW machine to IIT Kharagpur, India.
6. References
[1]. M. Ahmad, J.. Akhter, M.. Shaikh, M. Akhtar, M. Iqbal, M.. Chaudhry, Hardness and
microstructural studies of electron beam welded joints of Zircaloy-4 and stainless steel, J.
Nucl. Mater. 301 (2002) 118–121. doi:10.1016/S0022-3115(01)00757-7.
[2]. A. Ravi Shankar, V.R. Raju, M. Narayana Rao, U. Kamachi Mudali, H.S. Khatak, B. Raj,
Corrosion of Zircaloy-4 and its welds in nitric acid medium, Corros. Sci. 49 (2007) 3527–
3538. doi:10.1016/j.corsci.2007.03.029.
[3]. J.B. Bai, C. Prioul, S. Lansiart, D. François, Brittle fracture induced by hydrides in
M
AN
US
CR
IP
T
AC
CE
PT
ED
20
[4]. K. Bhanumurthy, J. Krishnan, G.B. Kale, S. Banerjee, Transition joints between
Zircaloy-2 and stainless steel by diffusion bonding, J. Nucl. Mater. 217 (1994) 67–74.
doi:10.1016/0022-3115(94)90305-0.
[5]. P.D. Wilson (Ed.), The Nuclear Fuel Cycle: From Ore to Wastes, Oxford University
Press, Oxford (1996).
[6]. N.A.P. Kiran Kumar, J.A. Szpunar, Z. He, Microstructural studies and crystallographic
orientation of different zones and δ-hydrides in resistance welded Zircaloy-4 sheets, J. Nucl.
Mater. 414 (2011) 341–351. doi:10.1016/j.jnucmat.2011.03.027.
[7]. K. Song, Laser Welding Unit for Intersection Line Welding of Spacer Grid Inner Straps
and its Application, J. Laser Micro/Nanoengineering. 4 (2009) 11–17.
doi:10.2961/jlmn.2009.01.0003.
[8]. K. Song, Determination of the Optimum Welding Parameters for a Laser Welded Spacer
Grid Assembly for PWRs, J. Laser Micro/Nanoengineering. 2 (2007) 95–99.
doi:10.2961/jlmn.2007.01.0017.
[9]. K.N. Song, S.B. Lee, M.B. Lee, M.K. Shin, J.J. Lee, New Spacer Grid to Enhance
Mechanical/Structural Performance, J. Nucl. Sci. Technol. 47 (2010) 295–303.
doi:10.1080/18811248.2010.9711957.
[10].M.S. Wȩglowski, S. Błacha, A. Phillips, Electron beam welding - Techniques and trends
- Review, Vacuum. 130 (2016) 72–92. doi:10.1016/j.vacuum.2016.05.004.
[11]. K. Devendranath Ramkumar, R. Sridhar, S. Periwal, S. Oza, V. Saxena, P. Hidad, N.
M
AN
US
CR
IP
T
AC
CE
PT
ED
21
Inconel 625 and UNS 32205, Mater. Des. 68 (2015) 158–166.
doi:10.1016/j.matdes.2014.12.032.
[12]. S.K. Dinda, M. Basiruddin Sk, G.G. Roy, P. Srirangam, Microstructure and mechanical
properties of electron beam welded dissimilar steel to Fe–Al alloy joints, Mater. Sci. Eng. A.
677 (2016) 182–192. doi:10.1016/j.msea.2016.09.050.
[13]. S. Kou, A criterion for cracking during solidification, Acta Mater. 88 (2015) 366–374.
doi:10.1016/j.actamat.2015.01.034.
[14]. I. Valavanis, D. Kosmopoulos, Multiclass defect detection and classification in weld
radiographic images using geometric and texture features, Expert Syst. Appl. 37 (2010)
7606–7614. doi:10.1016/j.eswa.2010.04.082.
[15]. H. Park, M. Choi, J. Park, W. Kim, A study on detection of micro-cracks in the
dissimilar metal weld through ultrasound infrared thermography, Infrared Phys. Technol. 62
(2014) 124–131. doi:10.1016/j.infrared.2013.10.006.
[16]. T. Yuan, X. Chai, Z. Luo, S. Kou, Predicting susceptibility of magnesium alloys to
weld-edge cracking, Acta Mater. 90 (2015) 242–251. doi:10.1016/j.actamat.2015.02.031.
[17]. S.K. Dinda, J.M. Warnett, M.A. Williams, G.G. Roy, P. Srirangam, 3D imaging and
quantification of porosity in electron beam welded dissimilar steel to Fe-Al alloy joints by
X-ray tomography, Mater. Des. 96 (2016) 224–231. doi:10.1016/j.matdes.2016.02.010.
[18]. T. Mohandas, D. Banerjee, V. V. Kutumba Rao, Fusion zone microstructure and
porosity in electron beam welds of an α+β titanium alloy, Metall. Mater. Trans. A. 30 (1999)
M
AN
US
CR
IP
T
AC
CE
PT
ED
22
[19]. C.J. Parga, I.J. van Rooyen, B.D. Coryell, W.R. Lloyd, L.N. Valenti, H. Usman, Room
temperature mechanical properties of electron beam welded zircaloy-4 sheet, J. Mater.
Process. Technol. 241 (2017) 73–85. doi:10.1016/j.jmatprotec.2016.11.001.
[20]. P. Mishra, V.P. Jathar, J.L. Singh, D.N. Sah, P.K. Shah, S. Anantharaman, In-reactor
degradation of fuel and cladding in fuel pins operated with weld defects, in: J. Nucl. Mater.,
2013: pp. 217–223. doi:10.1016/j.jnucmat.2012.05.033.
[21]. W. Tao, C. Cai, L. Li, Y. Chen, Y.L. Wang, Pulsed laser spot welding of intersection
points for Zircaloy-4 spacer grid assembly, Mater. Des. 52 (2013) 487–494.
doi:10.1016/j.matdes.2013.05.037.
[22]. R. Nomoto, Y. Takayama, F. Tsuchida, H. Nakajima, Non-destructive
three-dimensional evaluation of pores at different welded joints and their effects on joints strength,
Dent. Mater. 26 (2010). doi:10.1016/j.dental.2010.08.006.
[23]. J. Kar, S.K. Dinda, G.G. Roy, S.K. Roy, P. Srirangam, X-ray tomography study on
porosity in electron beam welded dissimilar copper–304SS joints, Vacuum. 149 (2018) 200–
206. doi:10.1016/j.vacuum.2017.12.038.
[24]. A. Leitch, V. Alex, J. Weber, Raman Spectroscopy of Hydrogen Molecules in
Crystalline Silicon, Phys. Rev. Lett. 81 (1998) 421–424. doi:10.1103/PhysRevLett.81.421.
[25]. J. Kar, S.K. Roy, G.G. Roy, Effect of beam oscillation on electron beam welding of
copper with AISI-304 stainless steel, J. Mater. Process. Technol. 233 (2016) 174–185.
M
AN
US
CR
IP
T
AC
CE
PT
ED
23
[26]. I. Eriksson, J. Powell, A.F.H. Kaplan, Melt behavior on the keyhole front during high
speed laser welding, Opt. Lasers Eng. 51 (2013) 735–740.
doi:10.1016/j.optlaseng.2013.01.008.
[27]. P. Fu, Z. Mao, C. Zuo, Y. Wang, C. Wang, Microstructures and fatigue properties of
electron beam welds with beam oscillation for heavy section TC4-DT alloy, Chinese J.
Aeronaut. 27 (2014) 1015–1021. doi:10.1016/j.cja.2014.03.020.
[28]. J.L. Huang, N. Warnken, J.C. Gebelin, M. Strangwood, R.C. Reed, On the mechanism
of porosity formation during welding of titanium alloys, Acta Mater. 60 (2012) 3215–3225.
M
AN
US
CR
IP
T
AC
CE
PT
ED
Highlights
• Electron Beam Welding of Zircaloy-4 was successfully carried out for four different
welding parameters such as with beam oscillation, without beam oscillation and at
different welding speeds.
• XCT technique was used to analyse the 3D porosity: The average size, number and
shape of the pores in the Electron Beam welded joints of Zircaloy-4.
• Weld porosity increased substantially with the increase in weld speed.
• Results show that the application of beam oscillation resulted in smaller average pore