© 2019, IRJET | Impact Factor value: 7.211 | ISO 9001:2008 Certified Journal | Page 2119
PSO BASED PID CONTROLLER FOR BIDIRECTIONAL INDUCTIVE POWER
TRANSFER SYSTEM
B.Balaki
1, Dr.K.Yasoda
21
ME-Power Systems Engineering, Department of Electrical and Electronics Engineering, Government College of
Technology, Coimbatore, Tamil nadu, India
2
Assistant Professor, Department of Electrical and Electronics Engineering, Government College of Technology,
Coimbatore, Tamil nadu, India
---***---Abstract -
This paper presents the optimalproportional-integral-derivative (PID) controller for a Bidirectional inductive power transfer (IPT) system using multiobjective Particle Swarm Optimization (PSO). The objective of the paper is to analyze the power flow in Bidirectional inductive power transfer systems and to design and implement the optimal parameters of PID controller. The optimal PID control parameters are applied for a composition control system. The performance of PSO- tuned controller is dependent on nature of the objective function and with the determination of parameters of PID controller based PSO is observed. Simulated performance analysis of the proposed PSO-based PID controller is compared with other well-known tuning method to investigate the optimal response and the best balance between performance and robustness. Finally, design parameters for bidirectional IPT system, implemented with a PSO-based PID controller, which uses a multiobjective fitness function, are presented to demonstrate the validity, performance and effectiveness of the optimum controller design.
Key Words: Proportional-integral-derivative (PID),
Inductive power transfer system (IPT), Particle swarm optimization (PSO), genetic algorithm (GA)
1. INTRODUCTION
PID control is the most ancient and the strongest control method in process industries. With the advancement in technology control systems are becoming more and more complex day by day. Conventional PID control is not able to solve such complex problems. In recent years many intelligent controllers have been introduced such as fuzzy PID controller, neural network and so on. The intelligent PID controllers having the properties such as self-adaptability, self-learning ability and self-organization are able to control complex systems. PID controller is widely used in industrial control systems. PID controller calculates the error between set point value and measured response. The objective of PID controller is to minimize the generating error. PID controller
calculation involves three terms proportional, derivative and integral. The purpose of proportional term is to determine the reaction of current error, integrating term determines
the reaction of sum of current error and derivative term determines the rate of error generating. The objective of PID controller tuning is to design such a controller which meet the desired closed loop performance. A PID controller improves the transient response of the system by reducing the overshoot in the step response, and by reducing the settling and rise time. Standard methods of PID tuning involve Ziegler Nichols, Corecon’s, Astrom and Hagglund and many other techniques. This paper presents soft computing technique for designing an intelligent PID controller.
2. PARTICLE SWARM OPTIMIZATION
Particle swarm optimization has been used here for the tuning of PID controller. PSO is a population based stochastic optimization algorithm which is first proposed by Eberhart and Kennedy in 1995.This technique is derived from research on biological organism such as bird flocking and fish schooling. Craig Reynolds (1987) showed that flock is simply the result of the interaction between the behaviors of individual birds. To simulate a flock we simulate the behavior of an individual bird. He concluded that to build a simulated bird flock model following three simple rules must be followed: Velocity Matching, centering of bird flock and avoid collisions. Work of Kennedy and Eberhart was influenced by Heppner and Germander’s (1990) work on simulated behavior of bird.
2.1
PSO Flowchart Steps
© 2019, IRJET | Impact Factor value: 7.211 | ISO 9001:2008 Certified Journal | Page 2120
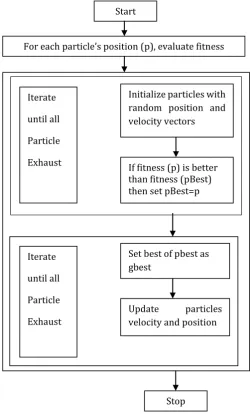
population is called swarm. The term ‘swarm’ meansirregular movement of particles. Particle swarm optimization is a member of swarm intelligence family it has some advantages over other intelligent optimization techniques: 1) It is simple to implement 2) There are fewer parameters to adjust. 3) It has more effective memory capability 4) It uses a relatively small population 5) It is fast 6) PSO is more effective in maintaining diversity of swarm and lead to fast convergence These advantages have given it popularity to solve nonlinear optimization problems in the field of evolutionary computation. PSO have been successfully applied in many areas of system design, system modeling, system identification, signal processing, pattern recognition, robotic applications. The algorithm of PSO include following steps: 1.Initialize the swarm by assigning random position and velocity to each particle. 2. Evaluate fitness function for each particle. 3. Compare the current fitness value with the pbest value of the particle in history. 4. If current fitness value is better than the previous best value (pbest), then set this value as current pbest. 5. Now best evaluated value of pbest is set as gbest value. 6. Update the velocity and position of the particles according to the equation 5 and 6. 7. Repeat the steps 2 to 6 until sufficiently good stopping criterion is met such as maximum number of iterations or best fitness value.
Particle Swarm Optimization (PSO), an evolutionary algorithm for optimization is extended to determine if natural selection, or survival-of-the fittest, can enhance the ability of the PSO algorithm to escape from local optima. To simulate selection, many simultaneous, parallel PSO algorithms, each one a swarm, operate on a test problem. Simple rules are developed to implement selection. The ability of this so-called Darwinian PSO to escape local optima is evaluated by comparing a single swarm and a similar set of swarms, differing primarily in the absence of the selection mechanism, operating on the same test problem. The selection process is shown to be capable of evolving the best type of particle velocity control, which is a problem specific design choice of the PSO algorithm
A particular algorithm may work well on one problem but may fail on another problem. If an algorithm could be designed to adapt to the fitness function, adjusting itself to the fitness landscape, a more robust algorithm with wider applicability, without a need for problem specific engineering would result. Strategies for avoiding local optima include stretching of Parsopoulos and other convexification strategies. Nature points to a way that may help circumvent local optima. We propose a strategy based on natural selection in which, when a search tends to a local optimum, the search in that area is simply discarded and another area is searched instead. This is the type of search designed and analyzed in this paper.
A swarm consists of several particles. Each particle keeps track of its own attributes. The most important attribute is their current positions which are represented by
n-dimensional vectors. The position of the particles corresponds to potential solutions of the cost function which is to be minimized. Another attribute of the particle is current velocity which keeps track of the current speed and direction of travel by the particles. Each particle has a current fitness value which is obtained by evaluating the error function of the particles current position. Each particle has to remember its own personal best position so that it can be used to guide the construction of new solutions. The best overall positions among all particles are recorded. This position is used for termination of the algorithm.
Fig -1: Flowchart of PSO algorithm in bidirectional IPT system
2.2
PID using PSO Algorithm
Objective of tuning method is to find a set of controller parameters which gives better results. The objective of PID controller is to adjust parameters like that system perform better in the wide range of operating conditions.
Start
For each particle’s position (p), evaluate fitness
Initialize particles with random position and velocity vectors
If fitness (p) is better than fitness (pBest) then set pBest=p Iterate
until all
Particle
Exhaust
Iterate
until all
Particle
Exhaust
Set best of pbest as gbest
Update particles velocity and position
[image:2.595.307.558.240.655.2]© 2019, IRJET | Impact Factor value: 7.211 | ISO 9001:2008 Certified Journal | Page 2121
Fig -2: Block diagram for PSO Based PID tuned controller
2.3
PID controller design
To design PID controller with PSO some parameters and fitness function are required. Particle swarm optimization algorithm is population based technique so first of all have to produce initial swarm of particles in search space represented by a matrix of dimension swarm size. Swarm size is the number of particles. Maximum number of iterations has been used here. However more number of iterations produce better results but for study and comparison between different performance indices iterations have been used in this paper.
ZN method may cause high overshoots, large oscillations, and longer settling times for higher order systems. The bidirectional IPT system, being a higher order resonant network falls into this category and the task of tuning PID gains for this system is, therefore, a major challenge. One of the most efficient methods of tuning PID parameters for such systems is through direct optimization, which often requires a solution to a non-convex problem. Various other methods such as refined ZN and pole placement have also been proposed to obtain the optimum PID parameters. PSO must have a fitness evaluation function to decide the better and best positions, the function can take the particle’s position and assigns it a fitness value. Then the objective is to optimize the fitness function. In general, the fitness function is pre-defined and is depend on the problem. Fig. 5shows the simulation output for the PID controller. It is the result of the controller during tuning for the IPT systems.
3. BIDIRECTIONAL IPT SYSTEM
Fig. 3 shows a typical bidirectional IPT system, consisting of a primary and a secondary side. The secondary circuit, which receives power from the primary through an air gap, is typically referred to as the pickup. The primary and the pickup use identical electronic circuitry, comprising a converter, an inductor–capacitor–inductor (LCL) resonant network with a series capacitor and a dedicated controller. The controllers are independent of each other and operate the converters on both sides to regulate the power flow across the air gap. The primary controller operates the primary-side converter, which is connected to the LCL resonate network to produce a constant sinusoidal current at a desired frequency f0 in the primary winding, represented
by the coil Lpt. This primary winding is commonly referred to as the primary track or the primary pad in IPT applications. The LCL circuits on both sides of the system are tuned to the frequency of track current iptgenerated by the converter on the primary side. In a bidirectional IPT system, the magnitude and/or phase angle of the voltage vector produced by the pickup converter can be controlled with respect to the voltage vector produced by the primary converter to regulate the magnitude and direction of power flow, as described later.
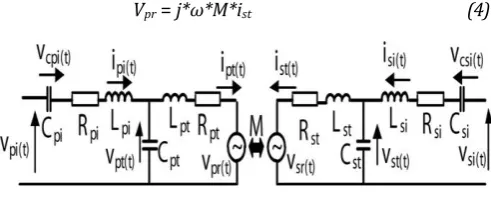
Assume that the primary-side converter of the bidirectional IPT system, shown in Fig. 3, produces a reference sinusoidal voltage Vpi∠0 at an angular frequency ω, and the track current iptis held constant by the primary-side controller. Since the inductor Lptis magnetically coupled to the secondary or the pickup coil Lst , a voltage is induced across Lstdue to ipt. The induced voltage Vsrin the pickup coil can be given by,
Vsr= j*ω*M*ipt (1)
where M represents the mutual inductance between the windings Lptand Lst and can be given by,
M = k*Lpt*Lst (2)
where k is the coupling coefficient of the system, which typically is in the range of 0.1–0.3. As such, the coupling between the primary and secondary of an IPT system is significantly less than that of a traditional transformer or an induction motor, which have coupling coefficients greater than 0.95.
M = k*√Lpt*Lst (3)
The pickup may be operated as a source or a sink by the controller and, despite the mode of operation, the voltage Vpr reflected onto the track can be expressed by,
Vpr = j*ω*M*ist (4)
Fig -3: Equivalent circuit representation of a bidirectional IPT system
Under these conditions, it can be shown that the currents
ipi and ipt of the primary are given by,
ipi= j Vpr (5)
ωLpt Initialize
parameters
PSO Algorithm
Design PID controller
Design Bidirectional PID
Controller Analyze
[image:3.595.35.273.77.194.2] [image:3.595.314.560.556.658.2]© 2019, IRJET | Impact Factor value: 7.211 | ISO 9001:2008 Certified Journal | Page 2122
ipt= −j Vpi (6)
ωLpt
Similarly, the input and output currents of the pickup circuit can be given by,
isi= j Vsr (7)
ωLst
ist= −j Vsi (8)
ωLst
Solving for isi using,
ipi= j MVpr (9)
ωLpt
If the equivalent ac voltage of the input voltage to the pickup side converter is given by Vsi ∠ − θ, then the power input Psiof the pickup is given by
Psi = Re : { Vsi (isi)* } (10)
Substituting (6) into (8)
Psi = M | Vsi | | Vpi | sin (θ) (11)
Lst ωLpt
It is evident from (11) that maximum power transfer takes place when the phase difference θ between the primary and pickup voltage vectors is ±90◦. A leading phase
angle constitutes power transfer from the pickup to the primary, while a lagging phase angle enables power transfer from the primary to the pickup. As evident from (11), for any given Vpiand Vsi, the amount and direction of power flow between the primary and the pickup can be regulated by controlling both the magnitude and relative phase angle of the voltage vectors generated by the converters.
4. BIDIRECTIONAL IPT PICKUP-SIDE CONTROLLER
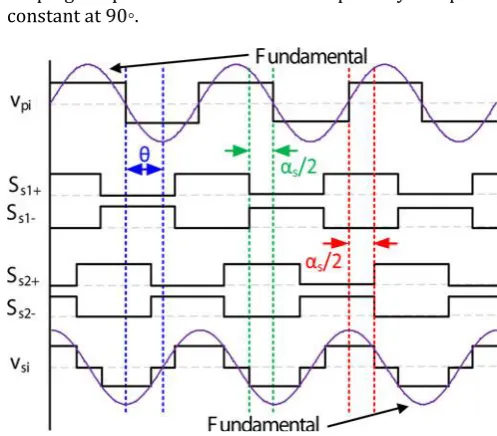
Decentralized controller can be used to control the power flow in a bidirectional IPT system. Therefore, this paper only presents the design and optimization of the pickup-side controller and the primary side of the system is operated at a fixed phase angle using an open-loop controller. The pickup controller regulates the output power by measuring the power flowing into the load and controlling the magnitude of the voltage Vsi applied to the pickup’s resonant network accordingly. A simplified diagram depicting how the magnitude of the voltage vsi is controlled is shown in Fig 4. The voltage Vpi applied to the input of the primary resonant network is shown in the top plot. The second and third waveforms show the switching signals applied to the
switches in the left-hand leg of the full bridge, whereas the fourth and fifth waveforms show the control signals applied to the right-hand leg. As evident from Fig.4, switches in each leg are driven with complementary waveforms with a phase delay/advance of αs/ 2 with respect to Vpi. The final plot shows the resultant voltage applied to the input of the pickup-side resonant network. As can be seen from Fig. 3, by increasing the phase angle αs, the magnitude of the voltage Vsican be increased, thus increasing the power flow while keeping the phase shift θ between the primary and pickup constant at 90◦.
Fig -4: Switching waveforms for pickup-side controller
The root-mean-square (RMS) value of the fundamental voltage component produced by the pickup converter can be expressed as a function of the control variable αsthrough,
Vsi = Vsin* 4 *sin (αs) (12)
√2π
where Vsinis the dc voltage of the active load supplied by the pickup-side converter. Combining (12) with (10), the input power of the pickup can be given by
Psi =8*M*Vpin*Vsin*sin (αp) *sin (αs)* sin (θ) (13)
ωπ2 * Lpt *Lst
where αpis the phase delay applied to the primary-side converter to control iptand Vpinis the dc voltage applied to the primary side converter. Both αpand αsare time discrete variables with a sampling period tsampequal to twice the converters switching frequency ω.
5. SIMULATION RESULTS
[image:4.595.305.554.215.433.2]© 2019, IRJET | Impact Factor value: 7.211 | ISO 9001:2008 Certified Journal | Page 2123
package. At 0 ms, a step change in the reference power levelwas introduced, where the power level was changed from 0 to −1 kW, which corresponds to power flowing in the forward direction from the primary to pickup. Under such conditions, the step response of the power flowing into the pickup-side converter.
The response of a bidirectional IPT system to a step change in the power reference is somewhat different when the power flow is reversed. As such, it is essential to verify that the controller gains derived in the preceding section results in a stable and fast response when the power is flowing in the reverse direction (from the pickup to the primary). Similarly, to the response shown by the system when power was flowing in the forward direction, oscillations can be observed in the power when the pickup is controlled derived using the ZN tuning method. However, the magnitudes of oscillations in the step responses are much smaller in comparison to the response yielded when the IPT system was transmitting power in forward direction.
Fig -5: PID controller tuned output for the bidirectional IPT system
5.1
PID controller design
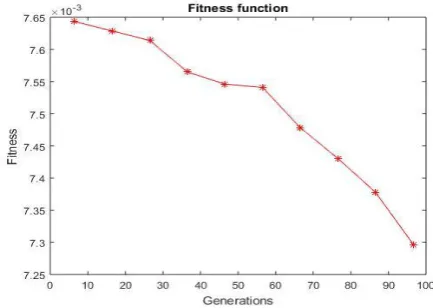
The objective function for PSO algorithm is calculated as power in terms of error. The fitness function plot as in Fig. 6 represents the fitness function of power transferred in bidirectional IPT system. It is calculated by the no. of populations and iterations in the algorithm.
The objective function of the bidirectional IPT system using PSO algorithm is calculated by the following,
Y= KP e (t) + KI ʃ e (t) dt +KD d/dt e (t)
Y is the output from the PID controller for tuning the bidirectional IPT system. KP is the proportional error
constant, KD is the derivative error constant and KI is the
integral error constant.
C(S) = U(S) / E(S) = KP + KI /S + KDS
C(S) represents the transfer function of the IPT system with tuned PID controller. U(S) represents the output and E(S) represents the input for the general transfer function of the system.
Kp = 0.5; Ki = 0.05; Kd = 3 are the designed error values obtained for the PID controller to tune the bidirectional IPT systems.These are the error constants which acts as the objective functions for the system to perform analysis in this paper.
Fig 6 represents the fitness function plot for the designed PID control parameters of the PSO algorithm. PSO iteratively less compared to other algorithm techniques and so in this graph the obtained fitness is effective with less number of
iterations and populations of the system.
Fig -6: Fitness function of PSO algorithm
5.2
MATLAB coding results
Data= [-8.9454150197628479 0.10119999999999998 - 0.006333881644934803];
Minimized Data= [-0.006333881644934803 - 8.9454150197628479];
Psi = 1.537254777568402;
T = 360; Tdc = 0.624;
Tf = 1000; Ti = 0.10119999999999998;
er = -0.059569137078034018;
er1= 2.0365063896576885E-5;
er2 = 5.8387519707991942E-5;
ist = 31432.467291003421;
Vpi = 439.86028856145924;
[image:5.595.312.529.286.440.2] [image:5.595.42.276.345.483.2]© 2019, IRJET | Impact Factor value: 7.211 | ISO 9001:2008 Certified Journal | Page 2124
w = 0.12725695259515554;Here, T represents the phase shifts and integral time period of oscillation of the PID controller. Tdc represents the
derivative time of the controller. k is the coupling co-efficient. Ti is the initial time period and Tf is the final time
period for the controller in the bidirectional IPT systems. The errors are represented as er, er1, er2. Ist is the
interference calculated for the bidirectional IPT system. Psi is the simulated power transferred to the system. Vpi is the
induced voltage in the primary where as Vsi is the induced
voltage in the pickup side (secondary) controller and w is the switching angular frequency.
5.3
Comparison on analysis between GA and PSO
The proposed PSO algorithm is compared with earlier popular techniques such as genetic algorithm (GA). In Fig 7 show the fitness function comparison between GA and PSO. PSO is comparatively effective as it requires minimum iteration than GA to obtain the fitness of the system.
Fig -7: Fitness function of GA and PSO algorithm
Table 1 shows the effective parameter comparison between GA and PSO algorithms. With infer to the table, PSO is more effective than GSO in all terms of parameters analysis of the system. Fig 8 & 9 shows the bidirectional power transfer of the IPT systems. It represents the forward and reverse direction of the PSO based PID controller of the bidirectional IPT system. Fig 10 & 11 shows the interference or disturbances that are take in consideration in the IPT
system. The trapezoidal form of plot represents the interference in forward direction whereas triangle form
represents the interference in reverse direction.
Table -1: Comparison between GA and PSO
Parameters
Comparative Analysis
GA based PID controller
PSO based PID controller
Parameters
Comparative Analysis
GA based PID controller
PSO based PID controller
Fitness function
value 0.089 0.077
Population 100 100
Rise Time (ms) 0.40 0.31
Settling Time (ms) 0.61 0.20 Peak overshoot
(%) 1.22 1.55
Simulated Power
(kw) 1.0 1.537
Fig -8: Power transfer in forward direction
[image:6.595.316.553.82.417.2] [image:6.595.45.279.361.513.2]© 2019, IRJET | Impact Factor value: 7.211 | ISO 9001:2008 Certified Journal | Page 2125
Fig -10: Interference in forward directionFig -11: Interference in reverse direction
6. CONCLUSION
Bidirectional IPT systems are essentially higher order systems and therefore conventional approaches of designing PID controllers, especially those based on ZN and various model reduction techniques do not yield satisfactory performance. Therefore, a systematic approach based on PSO has been proposed to tune the PID parameters. The parameters of PID controller along with interference have been analyzed and simulated using PSO. Simulated performance results of GA and PSO based PID controller has been compared to show the effectiveness with less iterative time. The results of simulation convincingly illustrate that PSO-based PID controller, which used effective objective functions, offers the best balance between performance and robustness.
REFERENCES
[1] Michael J. Neath, Akshya K. Swain, Udaya K.
Madawala,and Duleepa J. Thrimawithana (2015), “An Optimal PID Controller for a Bidirectional Inductive Power Transfer System Using Multiobjective Genetic Algorithm”, IEEE Transactions on Power Electronics, vol. 29, no. 3
[2] Yusoff, T.A.F.K., Atan, M.F., Rahman, N.A., Salleh, S.F., and
Wahab, N.A. (2015), “Optimization of PID tuning using genetic algorithm”, Journal of Applied Science & Process Engineering.
[3] C. Y. Huang, J. T. Boys, and G. A. Covic (2013), “LCL
pickup circulating current controller for inductive power transfer systems,” IEEE Trans. PowerElectron., vol. 28, no. 4, pp. 2081–2093.
[4] Akshya K. Swain, Member, Michael J. Neath, Udaya K.
Madawal, and Duleepa J. Thrimawithana (2012), “A Dynamic Multivariable State-Space Model for Bidirectional Inductive Power Transfer Systems”,IEEE Transactions on Power Electronics, vol. 27, no. 11.
[5] M. P. Kazmierkowski and A. J. Moradewicz (2012),
“Unplugged but connected: Review of contactless energy transfer systems,” IEEE Ind. Electron. Mag.,vol. 6, no. 4, pp. 47–55
[6] U. K. Madawala and D. J. Thrimawithana (2012), “New
technique for inductive power transfer using a single
controller,” IET Power Electron., vol. 5, no. 2, pp. 248– 256.
[7] U. K. Madawala and D. J. Thrimawithana (2012),
“Modular-based inductive power transfer system for high-power applications,” IET Power Electron.,vol. 5, no. 7, pp. 1119–1126
[8] U. K.Madawala andD. J. Thrimawithana (2011), “Current
sourced bi-directional inductive power transfer system,”
IET Power Electron., vol. 4, no. 4,pp. 471–480.
[9] J.Huh, S. W. Lee,W. Y. Lee, G. H. Cho, and C. T. Rim (2011),
“Narrow-width inductive power transfer system for online electrical vehicles,” IEEE Trans.Power Electron., vol. 26, no. 12, pp. 3666–3679.
[10] U. K. Madawala and D. J. Thrimawithana (2011), “A