Original citation:
Jaekel, Julia, Strauss, Vicky Yu-Chun, Johnson, Samantha, Gilmore, Camilla and Wolke, Dieter. (2015) Delayed school entry and academic performance : a natural experiment. Developmental medicine & child neurology .
Permanent WRAP url:
http://wrap.warwick.ac.uk/66376
Copyright and reuse:
The Warwick Research Archive Portal (WRAP) makes this work by researchers of the University of Warwick available open access under the following conditions. Copyright © and all moral rights to the version of the paper presented here belong to the individual author(s) and/or other copyright owners. To the extent reasonable and practicable the material made available in WRAP has been checked for eligibility before being made available.
Copies of full items can be used for personal research or study, educational, or not-for profit purposes without prior permission or charge. Provided that the authors, title and full bibliographic details are credited, a hyperlink and/or URL is given for the original metadata page and the content is not changed in any way.
Publisher’s statement:
"This is the peer reviewed version of the following article: Jaekel, Julia, Strauss, Vicky Yu-Chun, Johnson, Samantha, Gilmore, Camilla and Wolke, Dieter. (2015) Delayed school entry and academic performance : a natural experiment. Developmental medicine & child neurology, which has been published in final form at
http://dx.doi.org/10.1111/dmcn.12713. This article may be used for non-commercial purposes in accordance with Wiley Terms and Conditions for Self-Archiving."
A note on versions:
The version presented here may differ from the published version or, version of record, if you wish to cite this item you are advised to consult the publisher’s version. Please see the ‘permanent WRAP url’ above for details on accessing the published version and note that access may require a subscription.
Delayed school entry and academic performance: A natural experiment
Julia Jaekel1,2*, Vicky Yu-Chun Strauss3,4*, Samantha Johnson5,2, Camilla Gilmore6,2, Dieter
Wolke7,8
* first authorship is shared between the first two authors (alphabetical order) and they both made equal contributions to this publication
1 Department of Developmental Psychology, Ruhr-University Bochum, 44801 Bochum,
Germany
2 Senior Research Fellow
3 Centre for Statistics in Medicine, University of Oxford, Oxford, OX3 7LD, UK
4 Medical Statistician
5 Department of Health Sciences, University of Leicester, Leicester, LE1 6TP, UL
6 Mathematics Education Centre, Loughborough University, Loughborough, LE11 3TU, UK
7 Department of Psychology and Warwick Medical School, University of Warwick, Coventry,
CV4 7AL, UK
8 Professor
Correspondence to: D Wolke, [email protected]
Word count: 3308
Abstract
Aim. Recent reports suggest that delayed school entry (DSE) may be beneficial for children with developmental delays. However, studies of the effects of DSE are inconclusive. This study investigated the effects of DSE versus age-appropriate entry (ASE) on children’s academic achievement and attention in middle childhood.
Method. 999 children (492 females, 507 males; 472 born preterm) were studied as part of a prospective population-based longitudinal study in Germany. Using a natural experimental design, propensity score matching was applied to create two matched groups who differed only in terms of DSE vs. ASE. Teacher ratings of achievement in mathematics, reading, writing, and attention were obtained in Year 1, and standardized tests were administered at age 8 years.
Results. There was no evidence of a difference in the odds of DSE vs. ASE children being rated as above average by teachers in Year 1. In contrast, DSE children’s standardised mean test scores were lower than ASE children’s mean scores in all domains (mathematics: B =-0.28[-0.51,-0.06)], reading: B=-0.39[-0.65,-0.14], writing: B=-0.90[-1.07,-0.74], and attention: B=-0.58[-0.79,-0.36]).
Interpretation. DSE did not affect teacher rated academic performance. However, missing one year of learning opportunities was associated with poorer average performance in standardized tests at 8 years of age. Future research is needed to determine the long-term effect of DSE on academic achievement.
Short title: Impact of delayed school entry on achievement
What this paper adds
• Delayed school entry has no effect on Year 1 teacher ratings of academic performance • Delayed school entry is associated with poorer performance in standardized tests of reading, writing, mathematics and attention at age 8 years
A child’s initial entry into formal schooling marks an important developmental transition. Compulsory school entry age is determined according to a child’s birth date relative to a country-specific cut-off date which indicates the start of the academic year. Research has shown that, within the same academic year, the youngest children have lower academic achievement compared with the oldest children in class.1-3 In countries such as Germany,
paediatricians assess children’s school readiness and may recommend that children who fail such tests should enter school a year later. Preterm children may be born up to four months before their due date and may have to enter school less mature than their peers.4 Thus, the
issue of delayed school entry (DSE) is particularly pertinent for these children and their parents often enquire whether they can delay entry into school as they believe it would benefit their child to enter school a year later.
Delaying school entry may be beneficial because teachers may not be able to provide differential support for the less mature children in class,5 and thus they may not receive
developmentally appropriate teaching if they start school at the age-appropriate time. DSE may therefore prevent psychological pressure and negative feedback for those who delay school entry due to developmental immaturity. Indeed, positive effects of DSE on primary school achievement have been reported.6; 7 Conversely, DSE may disadvantage children as it
denies them the opportunity to receive the early intellectual input they may need to catch up with their peers. Accordingly, DSE has also been shown to negatively affect school performance.8
However, previous studies are characterised by inadequate power and selection bias because, compared with children who entered school age-appropriately (ASE), DSE children more often had special educational needs (SEN) or behavioural problems and were more often summer born boys and from disadvantaged backgrounds.9; 7 Consequently, it remains unclear if DSE
has any positive or negative long-term effects on academic achievement.7; 10 Given that
randomised controlled trials are not feasible, applying propensity score matching (PSM) to observational data within a natural setting provides a method for reducing selection bias.11
PSM can be used to select two comparable groups of children who are similar in baseline characteristics but different in their treatment, i.e. whether they are DSE or ASE. Using PSM, the aim of this study was to investigate the effect of DSE on children’s academic performance. The specific research questions were:
1. Does DSE affect children’s mathematics, reading, writing, and attention as rated by teachers at the end of Year 1?
2. Does DSE affect children’s performance in standardized mathematics, reading, writing, and attention tests at 8 years of age?
3. Are differences between ASE and DSE children’s performance explained by the length of formal schooling received at the time of assessment?
In addition, given the study’s particular relevance for preterm children, we repeated analyses on a matched sub-sample of children born preterm.
Method PARTICIPANTS
Data were collected as part of the prospective Bavarian Longitudinal Study (BLS)12, a
1316 survivors stratified by sex, socio-economic status, and degree of neonatal risk were assessed at 6 and 8 years of age.13; 12 Of these, 118 children were excluded: these were born
>41 weeks of gestation, entered school one year early1, or were enrolled directly in special
school (i.e. teacher ratings would not be comparable). In addition, n=199 children had incomplete information on baseline characteristics and could not be included in PSM.11
Descriptive characteristics of the 999 children included and 317 excluded in the present study are shown in Appendix Table A1.
PROCEDURE
Parents were approached within 48 hours of the infant’s hospital admission and were included in the study once they had given written consent for their child to participate. Ethical approval was obtained from the University of Munich Children’s Hospital Ethics committee. Study follow-up assessments were scheduled at 5, 20, 56 months, and 6 years of age in order to assess children’s pre-school neurological and cognitive abilities. For the present report, two sets of formal assessments were used as dependent variables. (1) At 8 years of age (irrespective of school year), children’s mathematics, reading, writing, and attention regulation abilities were assessed using standardised tests by psychologists who were blind to group membership. (2) At the end of school Year 1, whenASE children were aged 6-7 years and DSE children aged 7-8 years, teacher ratings of mathematics, reading, writing, and attention were obtained.
MEASURES
Delayed school entry. In 1990-1993, Bavarian policy required that all children were assessed
by a community paediatrician 3-12 months before their chronological-age school entry date to determine their school readiness. All children who turned 6 years before 30th June would
ordinarily start school the following September. Assessments lasted 30-60 minutes and covered key developmental domains. Paediatric recommendation for DSE was based on the results of these assessments. Schools, in conjunction with parents, made the final decision regarding DSE. Parents could not request DSE if their child passed the test.
Baseline characteristics. Twelve variables were included in PSM. These were measured
between birth and 56 months of age, before the DSE decision was made, and were selected as potential confounders of the association between DSE and academic achievement (see Appendix Table A2 for details).
Teacher ratings of mathematics, reading, writing, and attention at the end of school Year 1. Teacher ratings of children’s performance in mathematics, reading, writing and attention were obtained from written reports of primary school teachers’ assessments when children had completed their first year of schooling and coded into a binary variable (0=average or below average, 1=above average). These reports describe a child’s achievement during Year 1 in comparison to what is expected from an average child in their age group. Psychologists achieved excellent inter-rater reliability on these codings (100% agreement in a subsample of 50 reports).
Standardised assessment of mathematics, reading, writing, and attention regulation at 8
years of age. To assess intuitive mathematical competencies, individual children were
administered a mathematics test.13; 14 Tasks were presented to children in book form with 29
items assessing estimation, reasoning, and visual-spatial problem solving. Item responses were scored for accuracy and summarised into a total score (range: 5-24, M=13.25, SD=3.45). Reading was assessed using the validated Zürich Reading Test15 and a pseudo-word reading
test.13; 16 Both scores were highly correlated (r=0.69) and combined into one Reading Test
Score (range: 1-235, M=33.49, SD=29.62). Orthographic abilities (writing and spelling) were assessed with a structured diagnostic test (DRT-2; range: 0-24, M=11.19, SD=5.64).17
Children’s attention regulation during a standardized test situation was evaluated with the
Task Orientation sub-scale (range: 11-60, M=44.72, SD=5.36) of the Tester’s Rating of Child
Behaviour (TRCB).18 Assessments were scheduled to take place when children were 8 years,
5 months old; however, DSE children on average had their assessments slightly later than ASE children (mean difference: 0.77 months; 95% CI:0.21-1.33) and had completed fewer months of schooling when assessments were administered (mean difference: 7.65 months; 95% CI:6.84-8.46). Test scores were z-standardised according to the total sample included in this study. See Appendix Table A3 for more details on dependent variables.
Preschool numeric and phonetic knowledge. Assessments were made to objectively measure
children’s knowledge before they started elementary school at 6 years. Standardized numeric and phonetic tests comprised 10 and 34 items, respectively,12; 13 and two total accuracy scores
were computed.
Length of schooling. The number of completed months of schooling when standardised tests
were administered was calculated.
STATISTICAL ANALYSIS
Propensity score matching. Propensity scores were estimated with a logistic regression of DSE
when compared to ASE on baseline characteristics. When cases were matched, the difference in baseline characteristics between DSE and ASE children disappeared.11 Thus, PSM resulted
in an unbiased estimate of the association of DSE/ASE with academic achievement.19 We
used the Radius algorithm whereby each DSE child was “paired” with one or more ASE children who had similar propensity scores.19 Children were excluded from the matched
sample if no participants shared similar values. Analysis used the matched sample incorporated weights that reflected the ratio of DSE and ASE children sharing similar PSM values.19 The weighting on the matched sample accounts for the fact that an individual DSE
child may have been matched to more than one ASE child in the matching process, i.e. matching with replacement. For example, if 1 DSE child was matched to only 1 ASE child, this ASE child received a weight of 1. If 1 DSE child was matched to 4 ASE children, each ASE child received a weight of ¼ in the analysis. The overall matching balance was measured using pseudo R2, where a value close to 0 indicates the probability that DSE/ASE would be
independent of all baseline variables. Standardised bias was used to evaluate the balance in individual variables (>5%=meaningful imbalance). PSM was implemented using the psmatch2 and pstest STATA packages.
Ordinary least squares linear/logistic regressions. Analyses predicting academic achievement
It was not possible to control for length of schooling in these regression models as it reflects the decision for DSE/ASE. DSE children had completed, on average, eight fewer months of schooling when standardized assessments were administered. We calculated the effect of months of schooling on each standardized assessment within the ASE group only and used this predictive function to predict DSE children’s performance if they would have received the same amount of schooling (i.e. eight additional months) as ASE children at the time of assessment (proxy estimates).
Results
Propensity score matching. The matched total PSM sample included 959 children (99 DSE, 860
ASE) with similar propensity scores. Table 1 shows baseline characteristics for the unmatched and matched PSM sample. Before matching, there were moderate to large differences on all 12 baseline covariates between DSE and ASE children. After matching, none of these variables remained statistically different and bias for all 12 covariates was <5% in the matched sample, indicating that a good balance was obtained for all variables. A good overall matching quality was also indicated by Pseudo R2=0.12.
-Table 1 here-
The matched PSM subsample included 472 preterm children (see Appendix Table A4).
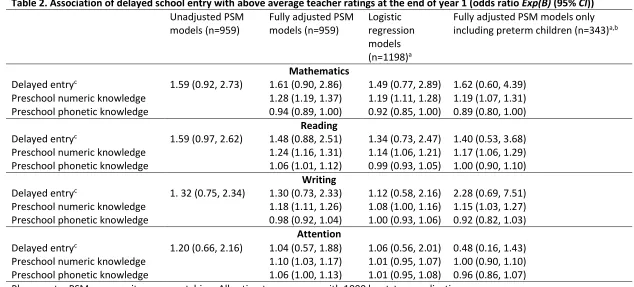
Does delayed school entry affect teacher ratings of children’s mathematics, reading, writing,
and attention at the end of Year 1? Table 2 shows that there was no evidence of a difference
in the odds of DSE compared with ASE children being rated as performing above average in mathematics, reading, writing, and attention by teachers in Year 1. Regression results were robust across the final overall PSM sample, the logistic regression sample, and the PSM sub-sample of preterm children. Controlling for children’s preschool numeric and phonetic knowledge did not change these findings. Better preschool numeric knowledge was consistently associated with higher odds of being rated as performing above average in mathematics, reading, and writing when compared to lower preschool numeric knowledge.
-Table 2 here-
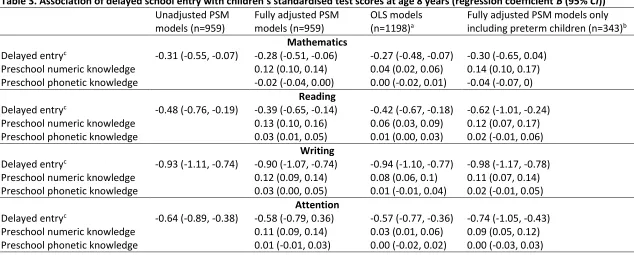
Does delayed school entry affect children’s performance in standardized mathematics,
reading, writing, and attention tests at 8 years of age? In contrast to the outcomes for Year
1, there was evidence that DSE predicted significantly lower mean scores in all four standardised tests (mathematics, reading, writing, and attention regulation) and across all PSM and OLS models at age 8 years (Table 2, also see Appendix Figure A1) with one exception: preterm children’s intuitive mathematics mean scores were not affected by DSE after controlling for children’s preschool knowledge and sex. Preschool numeric knowledge consistently predicted better average performance across all four domains.
-Table 3 here-
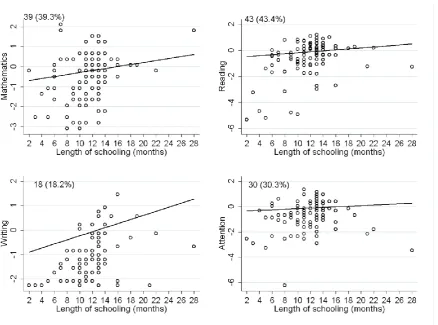
Are differences in performance between children with age-appropriate and delayed school
entry explained by the length of schooling? We calculated the effect of eight additional
Although not shown in the figure, predictions were based on the observed effect of eight months of schooling on ASE children’s scores. These results suggest that even if DSE children had received the same amount of schooling as ASE children, the majority would show worse mean performance than ASE children (i.e. dots are below the line). Similar findings were obtained on the PSM subsample of preterm children (Appendix Figure A2).
- Figure 1 here -
Discussion
This study found that there was no significant difference in the odds of ASE vs. DSE children being rated as performing above average in mathematics, reading, writing and attention by their teachers at the end of Year 1. In contrast, DSE children’s standardised mean test scores of mathematics, reading, writing and attention at 8 years of age were lower than ASE children’s mean scores. To our knowledge this is the first study that assessed the effect of DSE in a large sample after minimising selection bias and accounting for confounding effects of preschool knowledge.
The issue of DSE has received considerable interest.9; 7; 8; 20 Parents who wish to delay their
child’s school entry may do so because their child has developmental problems. If these are due to developmental immaturity then starting school a year later may give their child additional time to mature.9 However, these problems may often indicate developmental
impairments or SEN which could be better addressed with early intervention rather than DSE. Our results suggest that DSE has no effect on academic achievement but may delay formal instruction and the provision of special educational support during a key developmental period.
The findings presented here are based on both assessments according to age (standardized tests) and according to grade level (teacher ratings). In primary school, age has a large impact on performance as older children outperform younger children within a class.21 Thus
neither age-level nor grade-level assessments alone provide unbiased outcome measures. Our results indicate that despite DSE children being older, they did not outperform the younger ASE children on teacher ratings. Similarly, DSE did not lead to any performance advantage in standardized tests. DSE children had completed, on average, eight fewer months of schooling than ASE children when standardized assessments were administered at age 8 yearsand it was not possible to control for length of schooling in regression models as it reflects the decision for DSE/ASE. We however estimated the effect of eight months of schooling on mean test scores within the ASE group and used the regression line to estimate the impact of longer schooling within the DSE group. Still, more DSE children would have lower mean test scores than ASE children. Overall, delayed school entry may thus not provide any advantage for achievement at school. However, this analysis needs to be interpreted cautiously.
These findings are particularly applicable to preterm children who are born up to four months before their due date and may enter school less mature compared with their peers.4 Preterm
children were over-represented in the DSE group and our analyses on a matched subsample of preterm children confirmed the total sample results. Although there was only one significant DSE x preterm birth interaction on attention regulation but not on academic performance this analysis is important for several reasons: Prematurity is associated with increased need for special educational support22; 23 and specific impairments may only
delay entry into school as they believe it would benefit their child. This may arise from an expectation that preterm children will developmentally catch-up with their peers over time. Accordingly, it has recently been suggested that DSE may particularly benefit preterm children.26 However, parents and professionals should be aware that DSE may not promote
preterm children’s academic performance. Teachers are essential resources in encouraging learning and providing formal instruction. Raising education professionals’ awareness of the potential problems faced by preterm children may aid in ensuring they receive the specific help they need to thrive in school. In some situations, delaying children’s school entry may seem an appealing solution – but our results suggest that DSE children increase heterogeneity in class8 and make it more difficult for teachers to address individuals’ needs. Thus decisions
to delay school entry should be taken with due caution as there may be disadvantages arising from missing one year of learning opportunities or not receiving special educational support during the critical primary years.9; 8
Strengths and limitations. The longitudinal data reported here were collected in a large
whole-population sample of children born across the full spectrum of gestational ages. Assessors were blind to DSE vs. ASE group membership but teachers were not and thus their ratings could have been biased. While this is a general problem of all studies that include teacher ratings, these assessments are highly reliable as teachers based their judgement on knowing the child for a whole school year. The application of PSM provided precise effect estimates of DSE on academic performance while taking into account a comprehensive number of confounding variables. In this way, we carefully matched both groups on variables previously shown to be relevant for predicting school progress and controlled for preschool numeric and phonetic knowledge. Most birth cohort studies (e.g. all British cohort studies) schedule assessments according to age. Thus, both DSE and ASE children were assessed with standardised tests at the same age (8 years), rather than according to length of school experience. However we also included an assessment according to grade level using teacher reports at the end of Year 1, the first year of schooling for all children in the study. This assessment is thus based on the length of academic experience and not age. Thus we were able to assess the effects of DSE according to both age (standardized tests) and grade level (teacher assessments). We believe that this combination of grade-level and age-level assessments allows us to be confident in our conclusion that DSE did not enhance school achievement compared to ASE. Although there may be additional confounding factors not assessed there was no indication that DSE could be beneficial for academic progress and regression models confirmed these findings. In Germany, decisions to delay children’s school entry are based on community paediatric assessments and not on parents’ requests; thus our data are comparable with international studies on retaining (school decision to delay entry) but less with studies on ‘redshirting’ (parent decision to delay school entry).
Conclusion. DSE has no advantage for the likelihood of positive teacher ratings of academic
References
1 Crawford C, Dearden L, Greaves E. Does when you are born matter? The impact of month of birth on children's cognitive and non-cognitive skills in England. UK: Institue for Fiscal Studies; 2011. 2 Verachtert P, De Fraine B, Onghena P, Ghesquiere P. Season of birth and school success in the early years of primary education. Oxford Review of Education 2010; 36: 285-306.
3 Robertson E. The effects of quarter of birth on academic outcomes at the elementary school level. Economics of Education Review 2011; 30: 300-11.
4 Roberts G, Lim J, Doyle LW, Anderson PJ. High rates of school readiness difficulties at 5 years of age in very preterm infants compared with term controls. Journal of Developmental & Behavioral Pediatrics 2011; 32: 117-24 10.1097/DBP.0b013e318206d5c9.
5 Gledhill J, Ford T, Goodman R. Does season of birth matter? Research in Education 2002; 68: 41-7.
6 Tymms P, Merrell C, Henderson B. Baseline assessment and progress during the first three years at school. Educational Research and Evaluation 2000; 6: 105-29.
7 Katz LG. Academic redshirting and young children.: Eric Digest EDO-PS-00-13; 2000. 8 Martin AJ. Age appropriateness and motivation, engagement, and performance in high school: effects of age within cohort, grade retention, and delayed school entry. Journal of Educational Psychology 2009; 101: 101-14.
9 Graue ME, DiPerna J. Redshirting and early retention: who gets the "gift of time" and what are its outcomes? American Educational Research Journal 2000; 37: 509-34.
10 Arnold Lincove J, Painter G. Does the age that children start kindergarten matter? Evidence of long-term educational and social outcomes. Educational Evaluation and Policy Analysis 2006; 28: 153-79.
11 Baser O. Too Much Ado about Propensity Score Models? Comparing Methods of Propensity Score Matching. Value in Health 2006; 9: 377-85.
12 Wolke D, Meyer R. Cognitive status, language attainment, and prereading skills of 6-year-old very preterm children and their peers: the Bavarian Longitudinal Study. Dev Med Child Neurol 1999; 41: 94-109.
13 Schneider W, Wolke D, Schlagmüller M, Meyer R. Pathways to school achievement in very preterm and full term children. European Journal of Psychology of Education 2004; 19: 385-406. 14 Jaekel J, Wolke D. Preterm birth and dyscalculia. J Pediatr 2014; 164: 1327-32.
15 Grissemann H. Züricher Lesetest (ZLT). Göttingen: Hogrefe; 2000.
16 Leon-Villagra J, Wolke D. Pseudoword reading test. Munich: Unpublished Manuscript; 1993. 17 Müller R. Diagnostischer Rechtschreibtest DRT 2 [Diagnostic spelling test for Grade 2]. Weinheim: Beltz; 1983.
18 Jaekel J, Wolke D, Bartmann P. Poor attention rather than hyperactivity/impulsivity predicts academic achievement in very preterm and fullterm adolescents. Psychol Med 2013: 183-96. 19 Stuart EA. Matching methods for causal inference: A review and a look forward. Statistical science: a review journal of the Institute of Mathematical Statistics 2010; 25: 1.
20 Zill N, Loomis LS, West J. The Elementary School Performance and Adjustment of Children Who Enter Kindergarten Late or Repeat Kindergarten: Findings from National Surveys. National Household Education Survey. Statistical Analysis Report Washington, DC: United States Department of Education, National Center for Education Statistics; 1997.
21 Quigley M, Poulsen G, Boyle EM, Wolke D, Field D, Alfirevic Z, Kurinczuk JJ. Early term and late preterm birth is associated with poorer school performance at age 5 years: a cohort study. Arch Dis Child Fetal Neonatal Ed 2012.
23 MacKay DF, Smith GCS, Dobbie R, Pell JP. Gestational age at delivery and special educational need: retrospective cohort study of 407,503 schoolchildren. PLoS Med 2010; 7: e1000289.
24 Wolke D. Preterm and low birth weight children. In: P. Howlin, T. Charman, Ghaziuddin M editors. The SAGE Handbook of Developmental Disorders. London: Sage Publications; 2011. 497-527. 25 Jaekel J. Aftercare services and follow-up. 9. Cognitive problems. Caring for tomorrow - the EFCNI White Paper on maternal and newborn health and aftercare. European Foundation for the Care of Newborn Infants (EFCNI); 2011. 179-82.
26 Odd D, Evans D, Emond A. Preterm birth, age at school entry and educational performance. PLoS ONE 2013; 8: 0076615.
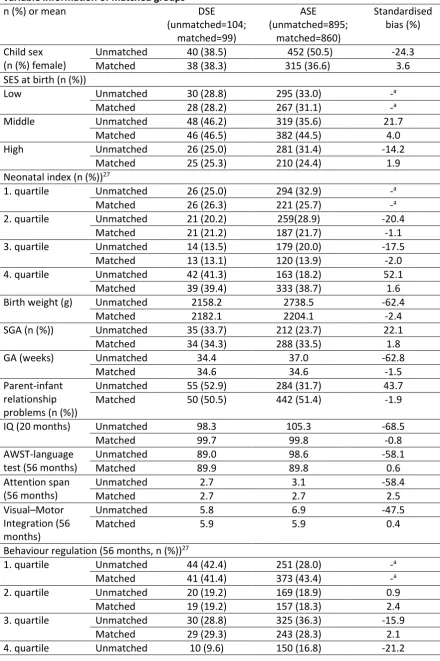
Table 1. Means and prevalence of baseline covariates of children with delayed versus age-appropriate school entry before and after propensity score matching; descriptive outcome variable information of matched groups
n (%) or mean DSE
(unmatched=104; matched=99) ASE (unmatched=895; matched=860) Standardised bias (%) Child sex (n (%) female)
Unmatched 40 (38.5) 452 (50.5) -24.3
Matched 38 (38.3) 315 (36.6) 3.6
SES at birth (n (%))
Low Unmatched 30 (28.8) 295 (33.0) -a
Matched 28 (28.2) 267 (31.1) -a
Middle Unmatched 48 (46.2) 319 (35.6) 21.7
Matched 46 (46.5) 382 (44.5) 4.0
High Unmatched 26 (25.0) 281 (31.4) -14.2
Matched 25 (25.3) 210 (24.4) 1.9
Neonatal index (n (%))27
1. quartile Unmatched 26 (25.0) 294 (32.9) -a
Matched 26 (26.3) 221 (25.7) -a
2. quartile Unmatched 21 (20.2) 259(28.9) -20.4
Matched 21 (21.2) 187 (21.7) -1.1
3. quartile Unmatched 14 (13.5) 179 (20.0) -17.5
Matched 13 (13.1) 120 (13.9) -2.0
4. quartile Unmatched 42 (41.3) 163 (18.2) 52.1
Matched 39 (39.4) 333 (38.7) 1.6
Birth weight (g) Unmatched 2158.2 2738.5 -62.4
Matched 2182.1 2204.1 -2.4
SGA (n (%)) Unmatched 35 (33.7) 212 (23.7) 22.1
Matched 34 (34.3) 288 (33.5) 1.8
GA (weeks) Unmatched 34.4 37.0 -62.8
Matched 34.6 34.6 -1.5
Parent-infant relationship problems (n (%))
Unmatched 55 (52.9) 284 (31.7) 43.7
Matched 50 (50.5) 442 (51.4) -1.9
IQ (20 months) Unmatched 98.3 105.3 -68.5
Matched 99.7 99.8 -0.8
AWST-language test (56 months)
Unmatched 89.0 98.6 -58.1
Matched 89.9 89.8 0.6
Attention span (56 months)
Unmatched 2.7 3.1 -58.4
Matched 2.7 2.7 2.5
Visual–Motor Integration (56 months)
Unmatched 5.8 6.9 -47.5
Matched 5.9 5.9 0.4
Behaviour regulation (56 months, n (%))27
1. quartile Unmatched 44 (42.4) 251 (28.0) -a
Matched 41 (41.4) 373 (43.4) -a
2. quartile Unmatched 20 (19.2) 169 (18.9) 0.9
Matched 19 (19.2) 157 (18.3) 2.4
3. quartile Unmatched 30 (28.8) 325 (36.3) -15.9
Matched 29 (29.3) 243 (28.3) 2.1
Matched 10 (10.1) 86 (10.0) 0.9
Outcome variables
Teacher ratings at the end of year 1 (% above average)
Mathematics 42(62.7%) 487 (58.9%) Reading 42 (61.8%) 483 (58.4%) Writing 34 (60.7%) 434 (62.5%) Attention 33 (58.9%) 404 (60.6%) Standardised test mean scores at age 8 years (SD)
Mathematics -0.6 (1.2) 0.1 (1.0) Reading -0.6 (1.4) 0.1 (0.8) Writing -1.1 (0.8) 0.1 (0.9) Attention -0.8 (1.2) 0.1 (0.9)
Please note: DSE=delayed school entry, ASE=age-appropriate school entry. Numbers are
reported as means if not stated otherwise. a STATA default-standardised bias was not computed
Table 2. Association of delayed school entry with above average teacher ratings at the end of year 1 (odds ratio Exp(B) (95% CI)) Unadjusted PSM
models (n=959)
Fully adjusted PSM models (n=959)
Logistic regression models (n=1198)a
Fully adjusted PSM models only including preterm children (n=343)a,b
Mathematics
Delayed entryc 1.59 (0.92, 2.73) 1.61 (0.90, 2.86) 1.49 (0.77, 2.89) 1.62 (0.60, 4.39)
Preschool numeric knowledge 1.28 (1.19, 1.37) 1.19 (1.11, 1.28) 1.19 (1.07, 1.31) Preschool phonetic knowledge 0.94 (0.89, 1.00) 0.92 (0.85, 1.00) 0.89 (0.80, 1.00)
Reading
Delayed entryc 1.59 (0.97, 2.62) 1.48 (0.88, 2.51) 1.34 (0.73, 2.47) 1.40 (0.53, 3.68)
Preschool numeric knowledge 1.24 (1.16, 1.31) 1.14 (1.06, 1.21) 1.17 (1.06, 1.29) Preschool phonetic knowledge 1.06 (1.01, 1.12) 0.99 (0.93, 1.05) 1.00 (0.90, 1.10)
Writing
Delayed entryc 1. 32 (0.75, 2.34) 1.30 (0.73, 2.33) 1.12 (0.58, 2.16) 2.28 (0.69, 7.51)
Preschool numeric knowledge 1.18 (1.11, 1.26) 1.08 (1.00, 1.16) 1.15 (1.03, 1.27) Preschool phonetic knowledge 0.98 (0.92, 1.04) 1.00 (0.93, 1.06) 0.92 (0.82, 1.03)
Attention
Delayed entryc 1.20 (0.66, 2.16) 1.04 (0.57, 1.88) 1.06 (0.56, 2.01) 0.48 (0.16, 1.43)
Preschool numeric knowledge 1.10 (1.03, 1.17) 1.01 (0.95, 1.07) 1.00 (0.90, 1.10) Preschool phonetic knowledge 1.06 (1.00, 1.13) 1.01 (0.95, 1.08) 0.96 (0.86, 1.07) Please note: PSM=propensity score matching. All estimates were run with 1000 bootstrap replications.
a adjusted for all baseline characteristics used in selecting PSM sample b additionallyadjusted for child sex
Table 3. Association of delayed school entry with children’s standardised test scores at age 8 years (regression coefficient B (95% CI)) Unadjusted PSM
models (n=959)
Fully adjusted PSM models (n=959)
OLS models (n=1198)a
Fully adjusted PSM models only including preterm children (n=343)b
Mathematics
Delayed entryc -0.31 (-0.55, -0.07) -0.28 (-0.51, -0.06) -0.27 (-0.48, -0.07) -0.30 (-0.65, 0.04)
Preschool numeric knowledge 0.12 (0.10, 0.14) 0.04 (0.02, 0.06) 0.14 (0.10, 0.17) Preschool phonetic knowledge -0.02 (-0.04, 0.00) 0.00 (-0.02, 0.01) -0.04 (-0.07, 0)
Reading
Delayed entryc -0.48 (-0.76, -0.19) -0.39 (-0.65, -0.14) -0.42 (-0.67, -0.18) -0.62 (-1.01, -0.24)
Preschool numeric knowledge 0.13 (0.10, 0.16) 0.06 (0.03, 0.09) 0.12 (0.07, 0.17) Preschool phonetic knowledge 0.03 (0.01, 0.05) 0.01 (0.00, 0.03) 0.02 (-0.01, 0.06)
Writing
Delayed entryc -0.93 (-1.11, -0.74) -0.90 (-1.07, -0.74) -0.94 (-1.10, -0.77) -0.98 (-1.17, -0.78)
Preschool numeric knowledge 0.12 (0.09, 0.14) 0.08 (0.06, 0.1) 0.11 (0.07, 0.14) Preschool phonetic knowledge 0.03 (0.00, 0.05) 0.01 (-0.01, 0.04) 0.02 (-0.01, 0.05)
Attention
Delayed entryc -0.64 (-0.89, -0.38) -0.58 (-0.79, 0.36) -0.57 (-0.77, -0.36) -0.74 (-1.05, -0.43)
Preschool numeric knowledge 0.11 (0.09, 0.14) 0.03 (0.01, 0.06) 0.09 (0.05, 0.12) Preschool phonetic knowledge 0.01 (-0.01, 0.03) 0.00 (-0.02, 0.02) 0.00 (-0.03, 0.03)
Please note: PSM=propensity score matching, OLS=ordinary least squares regression. The B coefficients express the effect size. All regression coefficients B where the 95% CI does not include 0 are statistically significant at the p<.05 level. All estimates were run with 1000 bootstrap replications.
a adjusted for all baseline characteristics used in selecting PSM sample b additionally adjusted for child sex
Delay or not delay-Appendix
Delay or not delay-Appendix
Appendix Table A1: Characteristics of children included and excluded from analysis n (%) or mean (SD) Cases excluded
(n=317)
Cases included (n=999)
Chi-square test/ T-test p value Delayed school entry 19 (10.4%) 104 (10.4%) 0.991
Child sex (female) 154 (48.6%) 492 (49.2%) 0.836 SES at birth
Upper 98 (30.9%) 326 (32.6%)
0.850
Middle 119 (37.5%) 366 (36.6%)
Lower 100 (31.5%) 307 (30.7%)
Neonatal optimality index (OPTI)
1. quartile 48 (26.5%) 320 (32.1%)
0.214 2. quartile 50 (27.6%) 280 (28.0%)
3. quartile 34 (18.8%) 193 (19.3%)
4. quartile 49 (27.1%) 206 (20.6%)
Birth weight (g) 2712.3 (1011.1) 2678.1 (919.3) 0.592 Gestational age (weeks) 36.9 (4.6) 36.7 (3.8) 0.402 Parent-infant
relationship problems
67 (45.0%) 339 (33.9%)
0.009
IQ at 20m 96.4 (25.6) 97.4 (17.9) 0.620
Active Vocabulary Test (AWST) at 56 months
98.0 (17.7) 97.6 (15.9)
0.796
Visual–Motor Integration at 56 months
-0.3 (1.2) -0.2 (1.0)
0.158
Behaviour regulation at 56 months
1. quartile 21 (38.9%) 295 (29.5%)
0.524
2. quartile 8 (14.8%) 189 (18.9%)
3. quartile 17 (31.5%) 355 (35.5%)
4. quartile 8 (14.8%) 160 (16.0%)
Attention span at 56 months
2.8 (0.8) 3.1 (0.7)
<0.001
Delay or not delay-Appendix
Appendix Table A2. Description of baseline characteristics included in propensity score matching
Variable (point in time) Description Score / categories
Sex (birth) Documented in the birth records. 0=male, 1=female
Family socioeconomic status, SES (birth)
Collected through structured parental interviews.
Family SES was computed as a weighted composite score derived from the occupation of the self-identified head of each family together with the highest educational qualification of both parents.1
0=low, 1=middle, 2=high
Neonatal optimality index (OPTI)
Assessed infant neonatal complications (21 items, e.g. ventilation or intubation, severe anaemia, cerebral haemorrhage).
Higher scores indicate more problems.2
For the PSM scores were transformed into a categorical variable based on quartiles to minimise the misspecification of propensity score matching due to threshold effects.3
Quartiles
Birth weight (birth) Documented in the birth records. Grams, ranging from 730g to 5050g Gestational age (birth) Determined from maternal reports of the last menstrual period
and serial ultrasounds during pregnancy.4
Weeks
Small for gestational age (SGA, derived from birth)
Classified if children’s birth weight was less than the gender-specific 10th percentile for gestational age. 5
0=no, 1=SGA
Parent-infant relationship problems (5 months)
Information collected from both a standard interview with parents and observations by study nurses.
Eight items including attachment-related parental concerns and current or anticipated relationship problems.
Items were dichotomised as 0 (no concern or problem) and 1 (problem) and were then summed into a score ranging from 0 (good relationship) to 8 (poor relationship). 5
Transformed into a dichotomised variable due to an extremely left skewed distribution of the sum score.
Delay or not delay-Appendix
IQ (20 months) The Griffiths Scales assessed the following dimensions:
locomotor development, personal-social development, hearing and speech, hand and eye coordination and performance.6
A total developmental quotient across the five dimensions was computed based on the German norms.
Total score, ranging from 33 to 127
Active Vocabulary Test (AWST, 56 months)
Active Vocabulary Test (AWST) assessed the expressive vocabulary of preschool children using 82 drawings.6
Children named the presented items.
Standardized score based on the BLS normative sample, ranging from 29.5 to 136.3
Attention span (56 months) Information from observations by study nurses on the child and parents on 11 items.5
Derived sum score, ranging from 0 (no problem) to 4 (several problems)
Visual-motor integration (56 months)
Beery-Buktenica Developmental Test of Visual-Motor Integration.
Measured the integration of visual and motor abilities.
The child copied 15 drawings of geometric forms that had been arranged by increasing difficulty.6
Delay or not delay-Appendix
Appendix Table A3. Description of standardized tests used as dependent variables
Test Description Score
Mathematics test7,8
29 items
Twelve estimation tasks measured children’s accuracy in
estimating numbers and comparing distances between numbers
Application of arithmetic abilities and procedural competence on real-world problems assessed with six reasoning tasks
Eleven mental rotation tasks testing visual-spatial problem solving
Combined raw total score range: 5-24, M=13.25, SD=3.45; z-standardised according to the total sample included in this study
Reading test score Zürich Reading Test9 assessing children’s word decoding skills via
reading errors
Pseudo-word reading test7,10 (Cronbach’s α=.91)
Combined raw total score range: 1-235,
M=33.49, SD=29.62; z-standardised according to the total sample included in this study
Structured diagnostic orthography test (DRT-2)11
Assessment of writing and spelling abilities using simple words
Participants are required to fill in single words dictated by the experimenter into sentences depicted on the test materials
Differential diagnosis based on individual orthographic errors
Raw score range: 0-24, M=11.19, SD=5.64; z-standardised according to the total sample included in this study
Tester’s Rating of Child Behaviour (TRCB)12
Task Orientation index-scale
Psychologist-rated attention regulation during a standardized IQ test situation
Subscales included: 1. Attention, 2. Robustness and Endurance, 3. Demandingness (recoded), 4. Cooperativeness, 5. Compliance, 6. Difficulty (recoded) (Cronbach’s α= .85; Inter-rater reliabilities (ICC) .63 to .97)
Delay or not delay-Appendix
Appendix Table A4. Means and prevalence of baseline covariates of preterm children with delayed versus age-appropriate school entry before and after propensity score matching
Proportion or mean DSE
(unmatched=78; matched=53) ASE (unmatched=394; matched=287) Standardised bias (%) Child sex (proportion female)
Unmatched 0.34 0.48 -28.6
Matched 0.35 0.28 14.5
SES at birth (proportion)
Low Unmatched 0.31 0.36 -
Matched 0.32 0.35 -
Middle Unmatched 0.45 0.32 26.9
Matched 0.44 0.43 2.9
High Unmatched 0.24 0.32 -16.4
Matched 0.24 0.22 3.9
Parent-infant relationship problems (proportion)
Unmatched 0.60 0.37 48.5
Matched 0.57 0.55 4.0
IQ (20 months) Unmatched 94.31 103.07 -75.0
Matched 96.57 96.96 -3.3
AWST-language test (56 months)
Unmatched 82.79 96.07 -77.8
Matched 84.79 84.41 2.2
Attention span (56 months)
Unmatched 2.54 2.98 -60.7
Matched 2.59 2.60 -0.5
Visual–Motor Integration (56 months)
Unmatched 5.29 6.39 -45.4
Matched 5.5 5.66 -6.7
Behaviour regulation (56 months, proportion)
1. quartile Unmatched 0.41 0.31 -
Matched 0.39 0.43 -
2. quartile Unmatched 0.22 0.18 11.3
Matched 0.22 0.21 3.1
3. quartile Unmatched 0.28 0.38 -21.3
Matched 0.30 0.26 7.7
4. quartile Unmatched 0.09 0.13 -15.1
Matched 0.09 0.10 -2.7
Gestational age (weeks)
Unmatched 30.66 32.77 -
Matched 30.89 32.71 -
SGA (proportion) Unmatched 44.87 32.49 -
Matched 43.40 34.49 -
Birth weight (g) Unmatched 1374.68 1829.27 -
Matched 1440.38 1823.89 -
Neonatal optimality index (OPTI, proportion)
1. quartile Unmatched 2.56 3.56 -
Matched 3.77 4.18 -
2. quartile Unmatched 10.26 18.58 -
Matched 13.21 19.16 -
Delay or not delay-Appendix
3. quartile Matched 13.21 30.31 -
4. quartile Unmatched 75.64 46.56 -
Matched 69.81 46.34 -
Please note: Numbers are reported as means if not stated otherwise. a STATA
default-standardised bias was not computed on the reference group of nominal variables.
Delay or not delay-Appendix
Appendix Figure A1.Means of achievement tests at age 8 years with 95% confidence intervals according to appropriate (ASE) and delayed school entry (DSE) group status in the full propensity score matching (PSM) sample (1a) and in the PSM sample only including preterm children (1b)
Delay or not delay-Appendix
Delay or not delay-Appendix
Appendix references
1 Bauer A. Ein Verfahren zur Messung des fuer das Bildungsverhalten relevanten Sozial Status (BRSS) - ueberarbeitete Fassung. Frankfurt: Deutsches Institut fuer Internationale Paedagogische Forschung; 1988.
2 Schmid G, Schreier A, Meyer R, Wolke D. Predictors of crying, feeding and sleeping problems: a prospective study. Child: Care Health Dev 2011; 37: 1365-2214.
3 Sullivan A, Field S. Do preschool special education services make a difference in kindergarten reading and mathematics skills?: A propensity score weighting analysis. Journal of School Psychology 2013; 51: 243-60.
4 Dubowitz LM, Dubowitz V, Goldberg D. Clinical assessment of gestational age in the newborn infant. J Pediatr 1970; 77: 1-10.
5 Riegel K, Ohrt B, Wolke D, Osterlund K. Die Entwicklung gefährdet geborener Kinder bis zum fünften Lebensjahr. (The development of at risk children until the fifth year of life. The Arvo Ylppö longitudinal study in South Bavaria and South Finland). Stuttgart: Ferdinand Enke Verlag; 1995. 6 Wolke D, Schmid G, Schreier A, Meyer R. Crying and Feeding Problems in Infancy and Cognitive Outcome in Preschool Children Born at Risk: A Prospective Population Study. J Dev Behav Pediatr 2009; 30: 226-38 10.1097/DBP.0b013e3181a85973.
7 Schneider W, Wolke D, Schlagmüller M, Meyer R. Pathways to school achievement in very preterm and full term children. Eur J Psychol Edu 2004; 19: 385-406.
8 Jaekel J, Wolke D. Preterm birth and dyscalculia. J Pediatr 2014; 164: 1327-32. 9 Grissemann H. Züricher Lesetest (ZLT). Göttingen: Hogrefe; 2000.
10 Leon-Villagra J, Wolke D. Pseudoword reading test. Munich: Unpublished Manuscript; 1993. 11 Müller R. Diagnostischer Rechtschreibtest DRT 2 [Diagnostic spelling test for Grade 2]. Weinheim: Beltz; 1983.