O R I G I N A L R E S E A R C H
Open Access
Bone SPECT-based segmented attenuation
correction for quantitative analysis of bone
metastasis (B-SAC): comparison with
CT-based attenuation correction
Tadaki Nakahara
*†, Yoshiki Owaki
†, Tsubasa Shindou, Kiyotaka Nakajima and Masahiro Jinzaki
Abstract
Background:Evidence has shown the clinical usefulness of measuring the metastatic tumor burden of bone for prognostic assessment especially in prostate cancer; quantitative evaluation by dedicated SPECT is difficult due to the lack of attenuation correction (AC) method.
We developed a novel method for attenuation correction using bone SPECT emission data (bone SPECT-based segmented attenuation correction; B-SAC) where emission data were virtually segmented into three tissues (i.e., bone, soft tissue, and air). Then, the pixel values in SPECT were replaced by 50 for the virtual soft tissue, and−1000 for the virtual air. The replaced pixel values for the virtual bone were based on the averaged CT values of the normal vertebrae (B-SACN) or the metastatic bones (B-SACM). Subsequently, the processed SPECT data (i.e., SPECT value) were supposed to realize CT data (i.e., CT value) that were used for B-SAC. The standardized uptake values (SUVs) of 112 metastatic bone tumors in 15 patients with prostate cancer were compared between CTAC with scatter correction (SC) and resolution recovery (RR) and the following reconstruction conditions: B-SACN(+)SC(+) RR(+), B-SACM(+)SC(+)RR(+), uniform AC(UAC)(+)SC(+)RR(+), AC(−)SC(+)RR(+), and no correction (NC).
Results:The SUVs in the five reconstruction conditions were all correlated with those in CTAC(+)SC(+)RR(+) (p< 0.01), and the correlations between B-SACNor B-SACMand CTAC images were excellent (r> 0.94). Bland-Altman analysis showed that the mean SUV differences between CTAC (+)SC(+)RR(+) and the other five reconstructions were 0.85 ± 2. 25 for B-SACN(+)SC(+)RR(+), 1.61 ± 2.36 for B-SACM(+)SC(+)RR(+), 1.54 ± 3.84 for UAC(+)SC(+)RR(+),−3.12 ± 4.97 for AC(−)SC(+)RR(+), and−5.96 ± 4.59 for NC. Compared to CTAC(+)SC(+)RR(+), B-SACN(+)SC(+)RR(+) showed a slight but constant overestimation (approximately 17%) of the metastatic tumor burden of bone when the same threshold of metabolic tumor volume was used.
Conclusions:The results of this preliminary study suggest the potential for B-SAC to improve the quantitation of bone metastases in bone SPECT when X-ray CT or transmission CT data are not available. Considering the small but
unignorable differences of lesional SUVs between CTAC and B-SAC, SUVs obtained with the current version of B-SAC seem difficult to be directly compared with those obtained with CTAC.
Keywords:Bone SPECT, Segmented attenuation correction, SUV, SPECT/CT, SPECT, Quantitation, Bone, Segmentation
© The Author(s). 2019Open AccessThis article is distributed under the terms of the Creative Commons Attribution 4.0 International License (http://creativecommons.org/licenses/by/4.0/), which permits unrestricted use, distribution, and reproduction in any medium, provided you give appropriate credit to the original author(s) and the source, provide a link to the Creative Commons license, and indicate if changes were made.
* Correspondence:[email protected]
†Tadaki Nakahara and Yoshiki Owaki contributed equally to this work.
Background
With the development of reconstruction algorithms, quantitation in single-photon emission computed tom-ography (SPECT) has become feasible in clinical practice using standardized uptake value (SUV) [1, 2]. Attenu-ation correction (AC), scatter correction (SC), and reso-lution recovery (RR) are known to have important roles in quantifying tracer distribution in target organs or le-sions. Among them, AC is generally performed by the use of integrated SPECT/computed tomography (CT) systems or external radioactive sources in order to esti-mate photon attenuation inside the scan area. Therefore, quantitative evaluation is considered practically difficult in facilities that have only dedicated SPECT equipment, although there are still many institutions implementing SPECT machines without CT portion.
Quantitation of radiotracer uptake is theoretically more reliable with SPECT than with planar scintigraphy because of the projection of several overlying structures in a planar image. However, quantitation of bone uptake is still chal-lenging with dedicated SPECT. A lesion-to-background ra-tio is generally used to semi-quantify lesional radiotracer uptake on SPECT images, especially in the field of neur-ology, whereas a very limited number of clinical studies used the semi-quantitative index in bone SPECT [3] be-cause of the difficulty in the standardization of region-of-interest settings. Recent SPECT/CT systems allow to calculate SUVs only with the information of pa-tient body weight and injected dose, although the limited availability of SPECT/CT hampers the application of quan-titative bone SPECT/CT to clinical multicenter studies. On the other hand, the total metastatic burden of bone on planar scintigraphy, called as bone scan index (BSI), has been established as a useful biomarker for the prediction of patient prognosis in prostate cancer [4, 5]. Therefore, we considered that it would become easier to conduct multicenter studies using quantitative SPECT data if a suc-cessful quantitation is achieved with dedicated SPECT.
The most common technique for attenuation cor-rection without CT or external devices is the seg-mented attenuation correction (SAC) in which body structures are segmented into several kinds of tissues based on pixel values on SPECT [6, 7], positron emis-sion tomography (PET) [8–10], and magnetic reson-ance (MR) images [11, 12]. As for SPECT, SAC has been used only for qualitative cardiac imaging, but not for oncologic imaging. In the present study, we developed a novel method for attenuation correction using bone SPECT emission data (bone SPECT-based segmented attenuation correction; B-SAC) where emission data were virtually segmented into three tis-sues (i.e. bone, soft tissue, and air). Considering the fact that the technique of SAC had been clinically ap-plied to dedicated PET before the advent of PET/CT,
it is worth evaluating the feasibility of B-SAC for quantitative assessment of bone SPECT compared to SPECT/CT.
Therefore, the purposes of this study were to evaluate the quantitative accuracy of B-SAC compared to other conventional reconstruction conditions and to discuss whether B-SAC can be used as an alternative to CT-based attenuation correction (CTAC).
Methods
Clinical bone SPECT data acquisition
Bone SPECT data in the areas (1–2 SPECT steps) cover-ing metastatic sites of bone were obtained from 15 pa-tients with prostate cancer 3 h after intravenous injection of 740 MBq of Tc-99m hydroxymethylene diphosphonate (Tc-99m HMDP) using a combined SPECT/CT system (Discovery NM/CT 670pro, GE Healthcare, Milwaukee, WI, USA). The acquisition protocol was as follows: 60 steps of 12 s/step, 360 de-grees, a matrix of 128 × 128, low-energy high-resolution collimator, main energy window at 141 keV ± 10%, and sub energy window at 120 keV ± 5%. Low-dose X-ray CT was performed for CTAC.
Virtual CT data preparation for bone SPECT-based segmented attenuation correction (B-SAC)
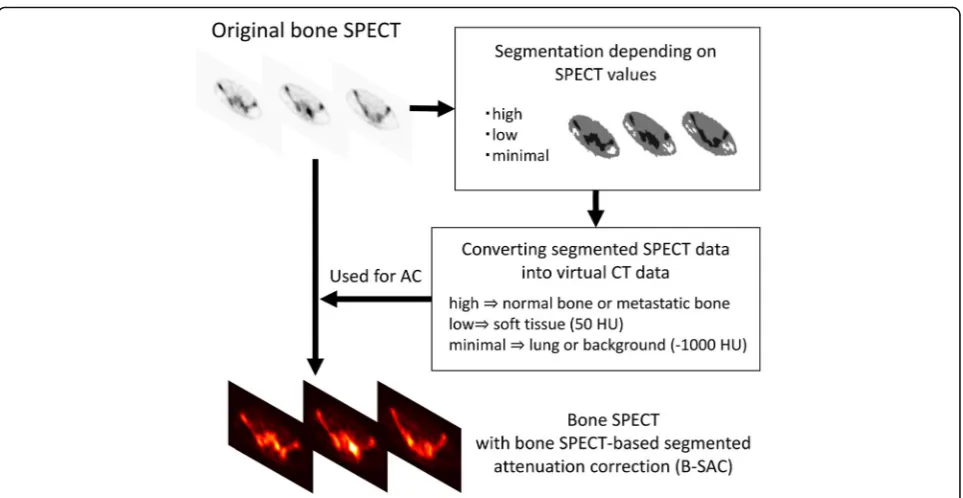
The first step of generating virtual CT data for B-SAC is to segment original bone SPECT depending on SPECT pixel values (Fig. 1). The SPECT images were recon-structed according to the EANM guideline [13]: 3D-OSEM algorithm with an iteration of 5, a subset of 10, and a Gaussian filter of 4 mm. Although it is impos-sible to visualize the details of human anatomy from the bone SPECT images, the distribution of Tc-99m HMDP is visually divided into bone with high uptake (area A), soft tissue with low uptake (area B), and background or lung with minimal uptake (area C) (Fig. 2). In order to accomplish a semi-automatic segmentation, average lung count (L) was measured by carefully setting a spherical volume of interest (VOI) with a diameter of 60 mm in the right upper lung, and areas A, B, and C were defined as the areas of pixel values of≥5 × L, pixel values of L to < 5 × L, and pixel values of < L, respectively.
Afterwards, the pixel values in bone SPECT were re-placed by 50 for area B and−1000 for area C based on general CT values for soft tissue (30–70 HU) and lung (−900–1000 HU), respectively (Fig. 1). The replaced pixel values for area A were based on the averaged CT value of the normal vertebrae in randomly selected 40 patients without bone metastasis (B-SACN) and the metastatic bones in the 15 patients with prostate cancer (B-SACM), respectively. Subsequently, the processed SPECT data (i.e., SPECT value) were supposed to realize CT data (i.e., CT value) for attenuation correction. Since
the virtual CT images have the same pixel size of the original SPECT images, pixel values were simply con-verted into attenuation coefficients without resampling.
SPECT data reconstruction for image analysis
The clinical SPECT data were reconstructed using 3D-OSEM algorithm with an iteration of 10, a subset of 10, and a Gaussian filter of 3 mm. These reconstruction parameters were previously determined in order to per-form quantitative analysis using CTAC [14]. Three kinds of attenuation correction were performed: CTAC, B-SAC, and uniform attenuation correction with Chang’s method (UAC). In UAC, 0.11 cm−1 was used as the attenuation
coefficient according to the manufacturer’s recommenda-tion. SC was performed using a dual-energy window method. RR by compensating the distance-dependent de-tector response was used. As a result, the following six types of reconstructed SPECT data were obtained: CTAC(+)SC(+)RR(+), B-SACN (+)SC(+)RR(+), B-SACM (+)SC(+)RR(+), UAC(+)SC(+)RR(+), AC(−)SC(+)RR(+), and no correction (NC).
Quantitative analysis
In order to convert SPECT count density in the target into SUV, the calibration factor (CF) was determined using a cylindrical phantom with a diameter of 160 mm and a height of 150 mm filled with Tc-99m solution of known activity concentration (approximately 25 MBq) [14]. The phantom images with CTAC(+)SC(+)RR(+), UAC(+)SC(+)RR(+), AC(−)SC(+)RR(+), and NC were obtained for calculating CFs for the corresponding re-construction conditions. CF for B-SAC was determined using phantom images with UAC(+)SC(+)RR(+) because the Tc-99m solution did not contain any attenuation medium.
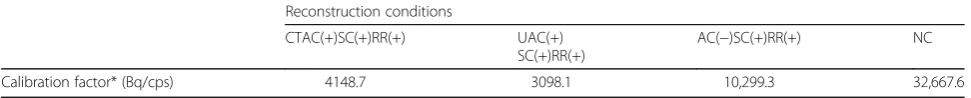
On the phantom images, a circular region of interest was drawn on the center of the phantom in the central slice as well as in slices ± 1 and ± 2 cm away, measuring SPECT count density (count/cc). CF was calculated as the ratio of actual radioactivity concentration (as mea-sured by the dose calibrator) in the phantom at the time of scanning to the measured SPECT count density per scan duration (Table1).
Fig. 1Schematic outline of the process of bone SPECT-based segmented attenuation correction (B-SAC)
SPECT count densities in a total of 112 bone metasta-ses were measured by setting VOIs under each recon-struction condition, and SUV was calculated as:
SUV¼CF½Bq=cpsSPECT count density½count=ccScan duration1
sec
½
Body weight½ g
Injected activity½ Bq
where SUV is defined as the ratio of the radioactivity concentration in a target to the average radioactivity concentration in the body. Then, peak SUV (SUVpeak) was measured. SUVpeak represents the average SUV ob-tained within a 1-cc sphere of interest centered on a highest voxel of the VOI. CTAC(+)SC(+)RR(+) image was used as a gold standard for assessing the accuracy of SUV of each metastatic lesion on the other five sets of SPECT images.
After determining which reconstruction type was the closest to CTAC(+)SC(+)RR(+), the total bone uptake (TBU; unit, gram) of bone metastases, which was calculated as the summation of metabolic tumor volume (MTV; unit, cm3) multiplied by its mean SUV, was compared between the reconstruction type and CTAC(+)SC(+)RR(+). Regard-ing the definition of MTV, 41% of SUVmax of the target was recommended for contouring tumors on PET [15], and some studies used higher thresholds (i.e., 50–60%) [16–18]. Considering the poorer spatial resolution of SPECT than that of PET, we set the VOIs delineating 50%, 55%, and 60% of SUVmax within the lesions to delineate the meta-static lesions on SPECT. Then, TBUs were measured as TBU50, TBU55, and TBU60.
Statistical analysis
All statistical data analyses were performed using SPSS ver-sion 22.0 (IBM Corporation). Correlations of SUV between CTAC(+)SC(+)RR(+) image and the other five sets of images were assessed with the Pearson correlation coefficient. The Bland-Altman analysis was applied for evaluating the agree-ment of SUV measureagree-ment between CTAC(+)SC(+)RR(+) image and each of the five SPECT images.
Results
Replacing pixel values of normal and metastatic bones for B-SAC
Averaged CT values of the normal vertebrae and meta-static bones were 289.1 ± 42.4 and 631.9 ± 314.7,
respectively. Therefore, the pixel values in bone SPECT for area A were replaced by 300 for B-SACNand 600 for B-SACM.
Correlations and differences between CTAC(+)SC(+)RR(+) and the other five reconstructions in the quantitative measurement of bone metastases
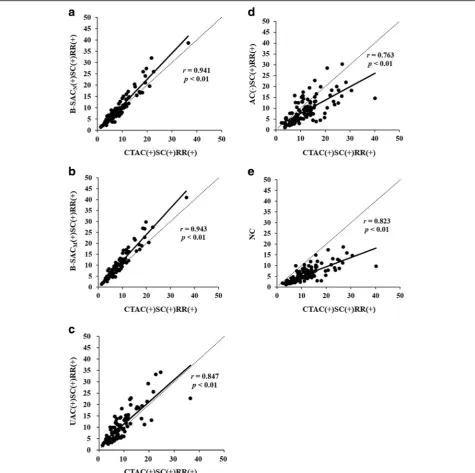
SUVs of the 112 metastatic bone tumors in B-SACN (+)SC(+)RR(+), B-SACM (+)SC(+)RR(+), UAC(+)SC (+)RR(+), AC(−)SC(+)RR(+), and NC images were all correlated with SUVs in CTAC(+)SC(+)RR(+) images (p< 0.01) (Fig. 3). Especially, the correlations of SUVs between B-SAC and CTAC images were excellent (r > 0.94).
The Bland-Altman analysis (Fig. 4) showed that the mean SUV differences between CTAC(+)SC(+)RR(+) and the other five reconstructions were 0.85 ± 2.25 for B-SACN (+)SC(+)RR(+), 1.61 ± 2.36 for B-SACM (+)SC(+)RR(+), 1.54 ± 3.84 for UAC(+)SC(+)RR(+), − 3.12 ± 4.97 for AC(−)SC(+)RR(+), and −5.96 ± 4.59 for NC. Ninety-five percent limits of agreement ranged be-tween −3.56 to 5.27 for B-SACN (+)SC(+)RR(+), −3.02 to 6.24 for B-SACM (+)SC(+)RR(+), −5.98 to 9.05 for UAC(+)SC(+)RR(+), −12.86 to 6.62 for AC(−)SC(+)RR (+), and −14.96 to 3.05 for NC. There was a significant proportional bias between B-SACN (+)SC(+)RR(+) and CTAC(+)SC(+)RR(+). The lesional SUVs were relatively higher with B-SAC than with CTAC (ratio, 1.08 ± 0.22). In addition, the tendency of the bias between B-SACM (+)SC(+)RR(+) and CTAC(+)SC(+)RR(+) was noted, whereas there were no proportional biases between the other three reconstructions and CTAC(+)SC(+)RR(+).
These results indicated B-SACN(+)SC(+)RR(+) was found to be the closest to CTAC(+)SC(+)RR(+) in terms of SUV measurement of the bone metastases, although B-SACN showed a slight overestimation compared to CTAC. A representative case was shown in Fig.5.
Comparison of TBU between B-SACN(+)SC(+)RR(+) and CTAC(+)SC(+)RR(+)
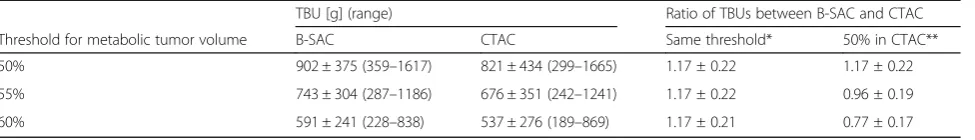
B-SACN (+)SC(+)RR(+), which was best correlated with CTAC(+)SC(+)RR(+) regarding SUV, was further com-pared regarding the TBUs of bone metastases on a per-patient basis. TBUs in B-SACN (+)SC(+)RR(+) were slightly higher than those in CTAC(+)SC(+)RR(+) when the same threshold of MTV was used; the ratios of TBU50, TBU55, and TBU60 in the former to TBU50,
Table 1Calibration factors to convert SPECT count density into SUV
Reconstruction conditions
CTAC(+)SC(+)RR(+) UAC(+) SC(+)RR(+)
AC(−)SC(+)RR(+) NC Calibration factor* (Bq/cps) 4148.7 3098.1 10,299.3 32,667.6
*Based on the phantom study
TBU55, and TBU60in the latter were 1.17 ± 0.22, 1.17 ± 0.22, and 1.17 ± 0.21, respectively (Table2). These results were definitely due to the overestimation of SUV observed with B-SAC compared to CTAC. Therefore, an add-itional comparison was made to determine how much higher threshold should be set in B-SAC to achieve closer TBU than the predetermined threshold (i.e., 50%) in CTAC: TBU55 and TBU60 in B-SACN (+)SC(+)RR(+) vs TBU50 in CTAC(+)SC(+)RR(+). The ratios were 0.96 ± 0.19 and 0.77 ± 0.17 (Table2).
Discussion
There have still been many institutions implementing only dedicated SPECT. However, its inability to perform quantita-tive analysis reduces the value of bone SPECT, which may account for increased high-quality evidence of bone planar scintigraphy instead of bone SPECT. Recently, quantitative bone SPECT/CT was reported to provide more accurate as-sessment of bone metastasis than planar scintigraphy [19], suggesting that bone SPECT with B-SAC could have better performance than planar scintigraphy when assessing the
Fig. 3Correlations between CTAC(+)SC(+)RR(+) and the other 5 reconstructions in the SUV measurement of bone metastases.a: B-SACN
metastatic tumor burden. Furthermore, B-SAC may allow to estimate the delivered dose of therapeutic radionuclides such as Ra-223 to metastatic lesions on a per-lesion basis because of an easier evaluation of individual bone metastasis than
planar scintigraphy. Therefore, an achievement of quantita-tion with dedicated SPECT would expand its clinical usabil-ity considering the fact that cancer is now a common disease.
Fig. 4Bland-Altman plots of SUVs of bone metastases between CTAC(+)SC(+)RR(+) and the other five reconstruction conditions.aB-SACN
(+)SC(+)RR(+).bB-SACM(+)SC(+)RR(+).cUAC(+)SC(+)RR(+).dAC(−)SC(+)RR(+).eNC
Importance of attenuation correction for quantitation
We found that SUVs in all of the five evaluated images (B-SACN (+)SC(+)RR(+), B-SACM (+)SC(+)RR(+), UAC(+)SC(+)RR(+), AC(−)SC(+)RR(+), and NC) had sub-stantial correlations with those in CTAC(+)SC(+)RR(+)
images. However, B-SAC(+)SC(+)RR(+) revealed the best correlation with CTAC(+)SC(+)RR(+), and the absolute difference between B-SAC(+)SC(+)RR(+) and CTAC(+)SC (+)RR(+) images was much smaller than those between the others and CTAC(+)SC(+)RR(+) images. Even uniform
Fig. 5Comparison of CTAC(+)SC(+)RR(+) and the other five reconstruction conditions in SUV measurement in a patient with bone metastases in the thoracic spine, rib, and sternum.aCTAC(+)SC(+)RR(+).bB-SACN(+)SC(+)RR(+).cB-SACM(+)SC(+)RR(+).dUAC(+)SC(+)RR(+).e
attenuation correction, which is widely applied to quanti-tative brain SPECT, was found to be insufficient as a method of attenuation correction for bone SPECT. These results clearly suggested that an attenuation correction of bone as well as soft tissues plays an important role in the quantitation of bone uptake.
Segmentation according to pixel value in bone SPECT
A major advantage of using bone SPECT emission data for attenuation correction is that it is feasible to semi-automatically delineate bone structures which ex-hibit the highly accumulated areas on SPECT images. Photon attenuation is dependent on transmission medium (usually defined as a function of attenuation co-efficient) inside the body through which photon travels into the detector. If the human body is roughly divided into three components according to photon attenuation (i.e., bone, soft tissue/water, and air), bone has the great-est impact on attenuation correction whereas the attenu-ation effect of air is negligible. Although the other tissues than bone or air have different attenuation coeffi-cient values (in this study the coefficoeffi-cient for them was constant), the difference would be much smaller than the difference between bone and soft tissue/water, or than the difference between soft tissue/water and air. Based on this assumption, the fixed values replacing areas A (300 HU or 600 HU) and B (50 HU) for B-SAC were applied to every case in spite of the non-uniform human structure. In addition, metastatic bones had dif-ferent CT values. Therefore, SUVs obtained with the current version of B-SAC seem difficult to be directly compared with those obtained with CTAC.
In the present study, the cutoff values for the segmen-tation on original SPECT images were based on the lung counts because of the following reasons. First, the con-tour of the lung is roughly identified on SPECT images because of its very low background uptake and sur-rounding uptake in the rib, liver, and mediastinum (Fig. 2). Second, SPECT count density in the lung seems constant depending on the VOI position within the lung (e.g., peripheral or deep side of the lung) even on non-attenuation-corrected SPECT images because of minimal attenuation effect within the lung. However, it remains uncertain whether the proposed method is most suitable for B-SAC. In addition, the threshold settings
for discriminating areas A, B, and C were only based on our visual inspection of the bone SPECT images in the 55 patients with prostate cancer with (n= 15) and with-out (n= 40) bone metastasis, which is one of the weak-nesses of this study.
In B-SAC, the urinary system, known as high uptake in bone SPECT, is recognized as one of the bone tissues. Therefore, the kidney, urinary tract, and bladder show as high SPECT values as the bone even after B-SAC. How-ever, as far as we evaluated the cases in the present study, we have observed no measurement error due to high accumulation in non-bone tissues including the urinary system. However, it is possible to cause the error especially when extraosseous accumulation is very close to any bone structure.
Moreover, the tissue segmentation with the current B-SAC method is susceptible to image noise because of the lack of the contouring process. Therefore, image smoothing and/or longer scan duration seems important when performing the segmentation. However, consider-able image filtering can lower SPECT values of both nor-mal and metastatic bones, resulting in the potential failure of bone segmentation. It is therefore necessary to perform further research about the optimization of smoothing and/or scan duration to improve the accuracy of the B-SAC.
Despite these limitations, the results of this prelimin-ary study suggest the potential for B-SAC to improve the quantitation of bone metastases in bone SPECT when X-ray CT or transmission CT data are not available.
Possible advantage of B-SAC over CTAC
B-SAC may contribute to the reduction of radiation dose compared to CTAC if quantitative bone uptake is a key to clinical assessments including differentiation of be-nign and malignant bone lesions, evaluation of active in-flammatory bone diseases, and treatment evaluation of a variety of bone diseases. In pediatric patients, sports in-juries, scoliosis, trauma, and bone tumors causing back pain are often evaluated with bone SPECT/CT or fluoride-18 PET/CT [20], although the radiation expos-ure from low-dose CT would be a matter of debate [21]. Indeed, MR-based segmented attenuation correction to pediatric PET/MR imaging has been specifically devel-oped for generating attenuation maps without CT [11].
Table 2Differences in the total bone uptake (TBU) between B-SAC and CTAC
TBU [g] (range) Ratio of TBUs between B-SAC and CTAC Threshold for metabolic tumor volume B-SAC CTAC Same threshold* 50% in CTAC** 50% 902 ± 375 (359–1617) 821 ± 434 (299–1665) 1.17 ± 0.22 1.17 ± 0.22 55% 743 ± 304 (287–1186) 676 ± 351 (242–1241) 1.17 ± 0.22 0.96 ± 0.19 60% 591 ± 241 (228–838) 537 ± 276 (189–869) 1.17 ± 0.21 0.77 ± 0.17
*Same threshold for metabolic tumor volume in both B-SAC and CTAC **Threshold for metabolic tumor volume was set at 50% in CTAC
TBU measurement of bone metastasis for assessing patient prognosis
Recently, a randomized controlled clinical trial suc-ceeded in demonstrating that BSI in planar scintigraphy was a good prognostic indicator in patients with prostate cancer [5]. Another large-scale clinical trial also showed that the volume of bone metastases affected the benefit of radiotherapy to the primary prostate cancer [22]. Thus, the measurement of metastatic tumor burden is crucial for the management of prostate cancer patients, and BSI has been used as one of the biomarkers for this purpose. However, since the automatic extraction of metastatic lesions for calculating BSI is based on the image contrast between normal and metastatic lesions, it can cause an underestimation of metastatic tumor bur-den especially in case of diffuse bone metastases as a re-sult of the reduced ability to differentiate between normal and pathologic uptake areas from anteroposter-ior planar images [19]. On the other hand, TBU is a promising alternative to BSI because of both the im-proved image contrast by SPECT and the objective as-sessment of measuring lesional SUVs. We found that TBUs observed with B-SAC were slightly and constantly (17%) higher than those observed with CTAC when the same threshold was used. These results suggested that B-SAC is probably comparable to CTAC when compar-ing TBUs before and after treatment. It may further fa-cilitate the comparison of SUVs among different dedicated SPECT scanners or between dedicated SPECT and SPECT/CT if the reconstruction condition and the threshold for tumor delineation are properly adjusted. However, at present, an appropriate application of B-SAC requires full validation through significant clin-ical data from many institutions.
Conclusions
We developed a novel method of attenuation correction using original bone SPECT data that we call B-SAC. SUVs in B-SAC(+)SC(+)RR(+) were best correlated with those in CTAC(+)SC(+)RR(+) compared to any other recon-struction conditions. Especially, B-SAC by replacing pixel values for bone based on the averaged CT value of the normal vertebrae (B-SACN) showed an excellent correl-ation and agreement with CTAC. However, a certain error is unavoidable when quantifying radiotracer uptake in an individual metastatic lesion considering the process of B-SAC. Nevertheless, this study demonstrated that B-SAC may be an option for attenuation correction if quantitative analysis is required even with dedicated SPECT.
Abbreviations
AC:Attenuation correction; B-SAC: Bone SPECT-based segmented attenuation correction; BSI: Bone scan index; CF: Calibration factor; CT: Computed tomography; CTAC: CT-based attenuation correction;
HMDP: Hydroxymethylene diphosphonate; MR: Magnetic resonance;
MTV: Metabolic tumor volume; PET: Positron emission tomography; RR: Resolution recovery; SAC: Segmented attenuation correction; SC: Scatter correction; SPECT: Single-photon emission computed tomography; SUV: Standardized uptake value; TBU: Total bone uptake; VOI: Volume of interest
Acknowledgements
The authors thank the staff of the Division of Nuclear Medicine at the Department of Radiology for their valuable support.
Funding None.
Availability of data and materials
All data generated or analyzed during this study are included in this published article.
Authors’contributions
TN and YO contributed to the study design, analyzed the data, and drafted and critically revised the manuscript. TS and KN contributed to the analysis of the clinical data and collected the phantom data for calculating the calibration factors. MJ contributed to the study design and critically revised the manuscript. All authors read and approved the final manuscript.
Ethics approval and consent to participate
This study was approved by the Ethics Committee of Keio University School of Medicine (registration number: 20160397). This article does not contain any studies with animals performed by any of the authors.
Consent for publication
All procedures performed in studies involving human participants were in accordance with the ethical standards of the institutional and/or national research committee and with the 1964 Helsinki declaration and its later amendments or comparable ethical standards. The SPECT/CT data obtained from routine clinical examinations were used for the present study, which was approved by the Institutional Review Board (IRB) in the hospital. The IRB officially granted permission for this retrospective review of the imaging data, and waived the need for obtaining informed consent from the patients.
Competing interests
TN and YO are inventors on a patent application (2018–092351) related to this work submitted by Nihon Medi-Physics Co., Ltd. to the Japan Patent Office. TN and MJ received research grants from Nihon Medi-Physics Co., Ltd. and GE Healthcare Corp. All other authors declare that they have no competing interests.
Publisher’s Note
Springer Nature remains neutral with regard to jurisdictional claims in published maps and institutional affiliations.
Received: 26 December 2018 Accepted: 12 March 2019
References
1. Seret A, Nguyen D, Bernard C. Quantitative capabilities of four state-of-the-art SPECT-CT cameras. EJNMMI Res. 2012;2:45.https://doi.org/10.1186/2191-219X-2-45. 2. Zeintl J, Vija AH, Yahil A, Hornegger J, Kuwert T. Quantitative accuracy of
clinical 99mTc SPECT/CT using ordered-subset expectation maximization with 3-dimensional resolution recovery, attenuation, and scatter correction. J Nucl Med. 2010;51:921–8.https://doi.org/10.2967/jnumed.109.071571. 3. Sedonja I, Budihna NV. The benefit of SPECT when added to planar
scintigraphy in patients with bone metastases in the spine. Clin Nucl Med. 1999;24:407–13.https://doi.org/10.1097/00003072-199906000-00006. 4. Dennis ER, Jia X, Mezheritskiy IS, Stephenson RD, Schoder H, Fox JJ, et al.
Bone scan index: a quantitative treatment response biomarker for castration-resistant metastatic prostate cancer. J Clin Oncol. 2012;30:519–24. https://doi.org/10.1200/JCO.2011.36.5791.
castration-resistant prostate cancer: a secondary analysis of a randomized clinical trial. JAMA Oncol. 2018;4:944–51.https://doi.org/10.1001/jamaoncol.2018.1093. 6. Okuda K, Nakajima K, Motomura N, Kubota M, Yamaki N, Maeda H, et al.
Attenuation correction of myocardial SPECT by scatter-photopeak window method in normal subjects. Ann Nucl Med. 2009;23:501–6.https://doi.org/ 10.1007/s12149-009-0258-0.
7. Takahashi Y, Murase K, Mochizuki T, Higashino H, Sugawara Y, Kinda A. Segmented attenuation correction for myocardial SPECT. Ann Nucl Med. 2004;18:137–43.
8. Visvikis D, Cheze-Lerest C, Costa D, Bomanji J, Gacinovic S, Ell P. Influence of OSEM and segmented attenuation correction in the calculation of standardised uptake values for [(18) F]FDG PET. Eur J Nucl Med. 2001;28: 1326–35.https://doi.org/10.1007/s002590100566.
9. Xu EZ, Mullani NA, Gould KL, Anderson WL. A segmented attenuation correction for PET. J Nucl Med. 1991;32:161–5.
10. Ramos CD, Erdi YE, Gonen M, Riedel E, Yeung HW, Macapinlac HA, et al. FDG-PET standardized uptake values in normal anatomical structures using iterative reconstruction segmented attenuation correction and filtered back-projection. Eur J Nucl Med. 2001;28:155–64.
11. Bezrukov I, Schmidt H, Gatidis S, Mantlik F, Schafer JF, Schwenzer N, et al. Quantitative evaluation of segmentation- and atlas-based attenuation correction for PET/MR on pediatric patients. J Nucl Med. 2015;56:1067–74. https://doi.org/10.2967/jnumed.114.149476.
12. Marshall HR, Stodilka RZ, Theberge J, Sabondjian E, Legros A, Deans L, et al. A comparison of MR-based attenuation correction in PET versus SPECT. Phys Med Biol. 2011;56:4613–29.https://doi.org/10.1088/0031-9155/56/14/024. 13. Van den Wyngaert T, Strobel K, Kampen WU, Kuwert T, van der Bruggen W,
Mohan HK, et al. The EANM practice guidelines for bone scintigraphy. Eur J Nucl Med Mol Imaging. 2016;43:1723–38. https://doi.org/10.1007/s00259-016-3415-4.
14. Nakahara T, Daisaki H, Yamamoto Y, Iimori T, Miyagawa K, Okamoto T, et al. Use of a digital phantom developed by QIBA for harmonizing SUVs obtained from the state-of-the-art SPECT/CT systems: a multicenter study. EJNMMI Res. 2017;7:53.https://doi.org/10.1186/s13550-017-0300-5. 15. Meignan M, Sasanelli M, Casasnovas RO, Luminari S, Fioroni F, Coriani C, et
al. Metabolic tumour volumes measured at staging in lymphoma: methodological evaluation on phantom experiments and patients. Eur J Nucl Med Mol Imaging. 2014;41:1113–22. https://doi.org/10.1007/s00259-014-2705-y.
16. Deron P, Mertens K, Goethals I, Rottey S, Duprez F, De Neve W, et al. Metabolic tumour volume. Prognostic value in locally advanced squamous cell carcinoma of the head and neck. Nuklearmedizin. 2011;50:141–6. https://doi.org/10.3413/Nukmed-0367-10-11.
17. La TH, Filion EJ, Turnbull BB, Chu JN, Lee P, Nguyen K, et al. Metabolic tumor volume predicts for recurrence and death in head-and-neck cancer. Int J Radiat Oncol Biol Phys. 2009;74:1335–41.https://doi.org/10.1016/j. ijrobp.2008.10.060.
18. Dibble EH, Alvarez AC, Truong MT, Mercier G, Cook EF, Subramaniam RM. 18F-FDG metabolic tumor volume and total glycolytic activity of oral cavity and oropharyngeal squamous cell cancer: adding value to clinical staging. J Nucl Med. 2012;53:709–15.https://doi.org/10.2967/jnumed.111.099531. 19. Umeda T, Koizumi M, Fukai S, Miyaji N, Motegi K, Nakazawa S, et al.
Evaluation of bone metastatic burden by bone SPECT/CT in metastatic prostate cancer patients: defining threshold value for total bone uptake and assessment in radium-223 treated patients. Ann Nucl Med. 2018;32:105–13. https://doi.org/10.1007/s12149-017-1224-x.
20. Grant FD. (1)(8)F-fluoride PET and PET/CT in children and young adults. PET Clin. 2014;9:287–97.https://doi.org/10.1016/j.cpet.2014.03.004.
21. Nadel HR. SPECT/CT in pediatric patient management. Eur J Nucl Med Mol Imaging. 2014;41(Suppl 1):S104–14.https://doi.org/10.1007/s00259-014-2697-7. 22. Parker CC, James ND, Brawley CD, Clarke NW, Hoyle AP, Ali A, et al.
Radiotherapy to the primary tumour for newly diagnosed, metastatic prostate cancer (STAMPEDE): a randomised controlled phase 3 trial. Lancet. 2018;392:2353–66.https://doi.org/10.1016/S0140-6736(18)32486-3.