Geschke Center
Master's Theses Theses, Dissertations, Capstones and Projects
Spring 5-22-2015
Privatization & FDI: Examining Growth in
Vietnam's Provinces
William T. Clark
University of San Francisco, [email protected]
Follow this and additional works at:https://repository.usfca.edu/thes
Part of theEconometrics Commons,Growth and Development Commons, and the Macroeconomics Commons
This Thesis is brought to you for free and open access by the Theses, Dissertations, Capstones and Projects at USF Scholarship: a digital repository @ Gleeson Library | Geschke Center. It has been accepted for inclusion in Master's Theses by an authorized administrator of USF Scholarship: a digital repository @ Gleeson Library | Geschke Center. For more information, please [email protected].
Recommended Citation
Clark, William T., "Privatization & FDI: Examining Growth in Vietnam's Provinces" (2015).Master's Theses. 128.
Privatization & FDI
Examining Growth in Vietnam’s Provinces
William Travis Clark
May 2015
University of San Francisco
I. Introduction
A key strategy for many developing nations to grow has been to accumulate capital and
use it to invest to create economic activity. Starting in the 1980’s many countries began to pull
back on highly planned state investment into industries, and began relying more on investment
from the private market in an effort to create developed financial markets. Increasingly,
developing nations are looking to boost investment into their local economies’ with capital from
Multinational Corporations (MNCs) and Sovereign Wealth Funds (SWFs) around the world by
attracting Foreign Direct Investment (FDI). In fact, the World Economic Forum notes that,
“since 1980…the stock of FDI has expanded by a factor of 20.” (Hufbauer & Draper, 2013)
While this trend is significant, FDI has very different implications for different levels of financial
FDI has on growth and a growth channel, and how that is affected by financial sector
development.
Recent literature shows that the positive effects of FDI are more nuanced than many tend
to believe. Specifically what has been found is that FDI is beneficial when there are higher levels
of human capital, or higher levels of financial sector development have been reached. (Alfaro et.
al, 2008) (Borensztein, 1998) (Anwar & Nguyen, 2009) While this research provides important
insight into how FDI can positively affect growth in a developing country, the question of how
financial sector development and privatization of investment has on industrial output growth is
yet to be seen. Further, most FDI literature is based on country to country comparisons leaving
provincial and regional governments with little information on what they can specifically do to
attract FDI and promote growth. Recent literature aimed to solve the within county comparison
issue by using panel data of the provinces of Vietnam 1994-2006 (Anwar & Ngyuen, 2009) and
panel data of the Chinese provinces (Guariglia & Poncet, 2008) . The Anwar and Ngyuen (2009)
research covered the effect of financial sector development, human capital, and FDI on growth in
Vietnamese provinces. Using an expanded data set (1998-2012) and some alternative measures
my research seeks to not only look at the effect these factors have on growth of industrial output,
which has been a main driver of growth in Vietnam since it committed to a more liberalized
economy in 1986 under Doi Moi.
It has been common practice within the scholarly literature of FDI to focus mostly on
world level data, with some exceptions. (Anwar & Nguyen, 2009) (Guariglia & Poncet, 2008) In
terms of policy implications for inward FDI attraction, this entails a total dependency on central
government policies to not only effectively attract FDI, but also ensure that the FDI is having a
regional or provincial level to enact policies that will promote industrial output growth when the
central government is unable or unwilling to. To ensure that my model is valid my research will
build on a host of scholarly literature relating to FDI.
II. Literature Review
The recent scholarly literature concerning FDI has been focused on investigating the
specific circumstances that may affect positive growth spillovers FDI may bring. My analysis of
the literature will start by detailing the initial debate over the benefits of FDI. I will then present
and analyze the current debates over FDI’s effect on industrial growth as well as what I will add
through my research. Since my research will include a case study in Vietnam using primary data
on financial sector development and human capital I will briefly discuss the literature on their
relationship to economic growth. I will then move on to the literature pertaining to my
methodology, which will focus on estimating financial sector development and human capital.
My intention is to use previously used calculations for certain variables in the Anwar and
Ngyuen research (2009) as well as alternate calculations to check for robustness. Additionally I
will be using urbanization and state investment to look at the effect privatized investment and
urbanization has played in provincial growth. This review of the literature should detail why
financial sector development and FDI are important to promoting economic growth, but that the
question of how this translates to the growth channel and between provinces within a country
still remains a question.
A. Heterogeneous effects of FDI
Attracting inward FDI to help boost economic growth has been an ongoing phenomenon
changes have been made in over 100 countries to attract inward FDI. (UNCTAD, 2000) Yet,
empirical literature is split on just how useful inward FDI is in promoting economic growth.
Many such as Choe (2003) and Mullen and Williams (2005) have found a positive effect of FDI
on economic growth, while others such as Carkovic and Levine (2005) have argued that there is
little to no effect on economic growth. Still others such as Mencinger (2003) have actually found
a negative growth effect from FDI. Certainly the true effect of FDI is effected by factors
associated with the host country as well as the kind of FDI being undertaken (extractive resource
industries versus highly skilled manufacturing for example. The disparate findings on this
subject have been explained using the former explanation by Borensztein et al. (1998), Alfaro et
al. (2004), and Alfaro et al. (2008) who conclude that FDI will only promote growth under
certain economic criteria. In both Alfaro et al. papers, it was discovered that host countries with a
more developed financial system see growth benefits from FDI, whileBorensztein et al. found
that a certain threshold of human capital is necessary to benefit from FDI. Further research by
Wang and Wong (2009) found that capital accumulation is only positively affected by FDI when
there is a certain threshold of human capital in the host country, and that total factor productivity
only benefits when a certain threshold of financial sector development has been met. While these
two factors seem to be significant in affecting FDI’s positive spillover effects on growth at the
country level, further research has begun to study the effect these factors have on the provincial
or regional level.
It is no surprise that human capital and financial sector development have a positive
effect on FDI growth spillovers, since much of the economic literature has shown that these two
factors are important in promoting growth in general. In particular Barro and Lee (1993) have
King and Levine (1993), Gupta (1986), as well as De Gregorio and Guidotti (1995) have shown
the same for financial sector development. However, what has only recently been investigated is
what effect these two factors have within countries between provinces or regions. (Anwar &
Nguyen, 2009)(Broadman & Sun, 2002)(Whalley & Xin, 2006) Anwar & Ngyuen (2009) find
that Vietnamese provinces benefit from FDI and financial sector development, while Whalley
and Xin (2006) find that foreign invested enterprises in China are far superior in capital to labor
output ratio than state owned or domestic private firms. With this in mind, it is necessary to
briefly discuss what role financial sector development has played in economic growth.
B. Financial Sector Development and Growth
As previously mentioned there has been a great deal of research done on the role
financial sector development promotes growth overall. Jao (1976), Lanyi and Saracoglu (1983),
and Gelb (1989) used cross-sectional data using various methods of estimation to find that there
was indeed a positive effect on economic growth. Similarly, in the time series studies done by
Wai (1980), Gupta (1986), and Odedokun (1996) a positive effect on economic growth
stemming from financial sector mediation was found. Odedokun (1996) found that this was
particularly important for least developed countries (LDCs). Some prominent skeptics such as
Lucas (1988) downplay its’ importance by arguing that financial sector development comes
about as a result of economic growth rather than the other way around. However, Levine (1997)
through a testing of relevant studies, as well as King and Levine (1993) through an endogenous
growth model simulation have both shown that the evidence overwhelmingly points to a positive
and important role for the creation of a well-functioning financial sector in attaining economic
development, rather than the other way around. With the wealth of literature in support of a
reasonable to assume that it has similar effects on industrial output as well. The first step in
setting up the test to settle the question of what difference (if any) does financial sector
development have in promoting growth spillovers for FDI, is to identify how best to estimate
financial sector development.
C. Estimating Financial Sector Development
In the scholarly literature concerned with estimating financial sector development, there
has been much debate as to what is the best method to carry this out. Most of the scholarly
literature has emphasized different measures of financial deepening as the best way to
empirically test for financial sector development. Jao (1976), in his cross-sectional research into
capital deepening and its effects on economic growth used both growth of per capita real money
balances, and ratio of wide money stock (M2) to the GDP to estimate financial sector
development. Further studies by Wai (1980) using time series data, estimated the financial sector
development by using per capita real money balances and found a similar causal relationship
between financial sector development and economic growth. Lanyi and Saracoglu (1983) used
the M2 to GDP ratio method with a new set of cross-section data, and again found the same
results. Even in within country studies, financial deepening is used to proxy for financial sector
development with strong evidence showing that it plays a positive role in promoting growth.
(Anwar & Ngyuen) (Guariglia & Poncet, 2008) (O’Toole & Newman, 2012)
Another part of the scholarly literature focuses on the structure of investment to estimate
the effects on growth and investment. (Kosteved et. al., 2003) (Guariglia & Poncet, 2008)
(O’Toole & Newman, 2012) (Gao, 2003) Kosteved et. al. (2003) as well as Guariglia and Poncet
investments are used to achieve broad policy goals that often don’t have return on investment as
a primary concern. Gao (2003) found that Chinese provinces with lower state investment levels
grew faster in terms of industrial output. O’Toole and Newman (2012) measured investment in
Vietnamese enterprises between 2002 and 2009 and also found that state loan value relative to
output crowds out private investment. Specifically they note that, “In scarce capital markets,
state firms and private firms compete for limited financial resources.” (p.36) All of these studies
also use financial deepening as a measure of financial sector development, so while my research
will focus primarily on privatization of investment, I will also include financial deepening in the
interest of robustness.
Policy makers and businesses alike seek to understand the full effects of FDI on
economic growth. As many developing countries seek to attract capital from foreign investors,
the relationship that financial sector development has on the growth spillovers of FDI would be
an important insight into how best to attract this capital. There is a considerable amount of
literature that backs the theory that FDI has a positive effect on economic growth in the host
country given certain other factors. Similarly the effect of financial sector development has been
shown to have a strong positive and causal relationship to economic growth. Studies on financial
sector development and the relationship to FDI, such as Alfaro et. al. (2004), have predictably
found that to benefit from FDI through higher economic growth is by reaching a threshold of
financial sector development. Similarly Borenzstein (1998) found that a certain level of human
capital is necessary for FDI to increase economic growth. In research done by Anwar and
Nguyen (2009), they found, “that high ratio of credit to Gross Provincial Product (GPP) has
accelerated economic growth in Vietnam.” (p.1) My research will be expanding their data set
sector development to investigate whether similar results hold. Additionally, I will be using
many of the same components, but using some alternative measures for trade and human capital
in the interest of robustness. Finally, I will also be investigating the role these factors play in
industrial output growth, so as to shed light on the nature of how a main growth channel
responds to privatization and FDI. This is where the research I will conduct and analyze will add
to existing scholarly literature.
III. Methodology
In order to test the effect of privatization of investment on growth spillovers from FDI I \
collected a great deal of data from the provincial level for the years 1998 to 2012. Conceptually,
I believe that FDI and capital resource growth effects the growth of industrial output differently
depending upon how privatized investment is. I will start by presenting my empirical models and
describing the variables I need for the models to accurately test my research topic. I will then
conclude by detailing the sources, and briefly discussing issues in the data.
A. Empirical Model
To test the effect privatization and urbanization has had on industrial output growth; I
will need to formulate a model that can measure the effect of privatization on FDI and growth.
The model’s dependent variable is real industrial output growth in province “i” at time “t” with
the independent variables of the final model being initial GPP (1998 GPP for all years), FDI,
savings rate, human capital, financial deepening, capital resources, state direct investment (which
is used as a proxy for privatization of investment), urbanization, a technological trend dummy,
population growth, and volume of trade. The variables containing the Z vector are important
controls used in growth literature (Levine and Renelt, 1992).
Growthit = α0 + φIGPPi + ρHCit + Zit + τTrendt + εit (1)
Growthit = α0 + φIGPPi + ρHCit + Zit + τTrendt + λPFEit + εit (2)
My first two models are estimated in columns 1 and 2 in Table 1, as basic growth
equations without FDI. The difference in the two equations show the importance of using
provincial fixed effects when estimating growth between many different provinces that have very
different endogenous factors that are otherwise impossible to measure.
Growthit = α0 + φIGPPi + βFDIit + ρHCit + Zit + τTrendt + λPFEit + εit (3)
Equation (3) is estimated in column 3 of Table 1. Here I add FDI to show the contrast
between this model and the first two in order to show whether FDI is indeed a positive and
significant factor in industrial output growth. As is explained in the results, FDI is positive and
statistically significant under many different model specifications.
Growthit = α0 + φIGPPi + βFDIit + ρHCit + Zit + GSit + τTrendt + λPFEit + εit (4)
Growthit = α0 + φIGPPi + βFDIit + ρHCit + Zit + GSit + δFSDit + τTrendt + λPFEit + εit (5)
Equations (4) and (5) are estimated in columns 4, 5, and 6 in Table 1. Equation (4) uses
gross savings of the province because of its’ essential role as an explanation for growth in the
Solow growth model. For equation (5) I added measures of financial sector development in order
to proxy for development of the private investment sector. Since I used a crude assumption for
in capital resources normalized by the natural log in the province that year. This is done in the
interest of robustness, and when switching these two definitions of financial sector development
it turns out that it is more positive and statistically significant than the measure of M2.
Growthit = α0 + φIGPPi + βFDIit + ρHCit + Zit + GSit + δFSDit + μUrbanit + τTrendt + λPFEit+ εit
(6)
Growthit = α0 + φIGPPi + βFDIit + ρHCit + Zit + GSit + δFSDit + γSDIit + μUrbanit + τTrendt +
λPFEit+ εit (7)
Equations (6) and (7) add in the final controls of state investment and urbanization, as
well as use both proxies for financial sector development with them. Urbanization is usually
associated with higher growth as cities are normally more hospitable to high output industries.
(Lewis, 1954) However, I find urbanization to be negative and not significant in the baseline
regressions, which motivate my manipulation of the dataset and equation (8) in Table 3. I expand
further on this in the results section, but the results suggest that increasing state investment into
provinces with higher levels of urbanization significantly hinders growth for provinces with
highly planned investment regimes.
With these equations I aim to test the role FDI has played in increasing industrial output
growth. In order to test this and move on to testing the effects of privatization of investment I
make use of a wealth of data made available to me by Vietnam’s Ministry of Finance, Ministry
of Planning and Investments, and Government Statistics Office during my in country research.
Some data was not available at the provincial level so national figures were collected using
B. Variable Specification
Variable Calculation Source
Industrial Output per capita Growth Ln(Ind. Out.it/Tot. Popit) – Ln(Ind. Out.it-1/Tot. Pop.it-1) GSO
Foreign Direct Investment (FDI) Total FDIit/GPPit GSO
Gross Savings Ln [Savingst/GDPt * (GPPit)] ADB
Financial Depth Ln [M2t/GDPt * (GPPit)] ADB
Capital Resource Growth Ln(Capital Resourcesit)/ Ln(Capital Resourcesit-1) GSO
State Investment (Privatization) State Investmentit/GPPit MOP
Human Capital University Students/per thsd GSO
Government Expenditure Government Expenditureit/GPPit MOF
Inflation Ln(CPIit ) – Ln(CPIit-1) GSO
Population Growth Populationit – Populationit-1/Populationit-1 GSO
Trade Openness Exportsit + Importsit/GPPit GSO
Urbanization Urban residentsit/Populationit GSO
Technological Growth Trend Trend dummy to account for technological advancements -
My dependent growth variables are defined as the natural log difference of real GDP and
real industrial output in province “i” at time “t”. GDP is commonly used in growth literature as a
good measure for economic growth, especially those measuring FDI. (Wang & Wong, 20009)
(Odedokun, 1994) Since Doi Moi Vietnam has seen significant increases of foreign investment,
particularly in the industrial sector. (GSO, 2015) This motivates my examination of industrial
My first independent variable is the amount FDI as a percentage of the GDP in
province/country “i” at time “t”. The second variable is measured as the total savings divided by
the GDP of that year. The third variable estimates the overall effect of financial sector
development on growth. This variable relies on estimating financial deepening, and so I use the
commonly accepted method in macro literature (Wang & Wong, 2009) (Jao, 1976) (Odedokun,
1994) of calculating currency plus demand deposits and other interest-bearing liabilities of banks
and nonbank intermediaries (M2) as a share of GDP. This is a good estimator for the total
amount of liquidity available to the private sector, and thus is the mark of a more efficient and
developed financial sector.It is important to note that the measures for savings rate and financial
deepening are taken at the national level, so that they only vary over time. To correct for this
limitation I make a somewhat crude assumption that national M2 and national savings relative to
national GDP is proportional to provincial M2 and provincial savings relative to GPP. Therefore
using some simple algebra I derive an easy to use measure that provides a somewhat accurate
approximation of savings and financial deepening.
Savet∝ P.Saveit Savet/GDPt = PSaveit/GPPit (Savet/GDPt )* GPPit = PSaveit
M2t∝ PM2it M2t/GDPt = PM2it/GPPit (M2t/GDPt)*GPPit =PM2it
These aggregate figures are normalized through natural log. Previous studies that were
unable to obtain M2 provincial data have simply used the national figure for all provinces only
varying by year (Anwar & Ngyuen, 2009). I believe that the measure I am using is a closer
approximation to the real number by province than used previously, yet savings remains crudely
estimated compared to the Anwar and Ngyuen (2009) study. As a robustness check to my
province that year, as another measure for financial sector development that truly varies by year
and province. While the data limitations do not allow me to make comparisons on the provincial
level when it comes to financial deepening (as defined by M2) and savings, my focus is more on
the effect FDI and privatization of investment has had on growth. Thus, these two are included
more as a way to construct the basic tenants of the Solow growth model while being able to
investigate the role FDI as well as different levels of privatized investment have on growth. Later
on it is used as an instrument to test for endogenous issues in FDI’s growth spillovers.
State Investment is measured as the amount of state investment to state owned
enterprises, joint stock companies, and other traditionally private businesses that involve
government ownership/investment relative to GPP of the province in that year. This is used as a
proxy for privatization of investment and has been found to negatively affect investment in
Vietnamese provinces (O’Toole & Newman, 2012) as well as growth in Chinese provinces
(Guariglia & Poncet, 2008) and Vietnam (Kosteved et. al., 2003). I will also be using university
students per thousand residents in the province as my measure for human capital, replicating the
same measure used by Anwar and Ngyuen (2009).
The state direct investment and FDI variables are at the crux of my research question, so
being able to accurately measure how privatization of investment influences growth spillovers
from FDI. While there is no absolute consensus in the scholarly macro literature on the best way
to estimate financial sector development the previously mentioned measures are the most often
used in the well regarded literature pertaining to FDI and financial sector development.
(Odedokun, 1996) (Anwar & Nguyen, 2009) While my baseline regressions will include all
provinces, I will also use state direct investment as a means to manipulate observations included
which I define as planned (SDI>75% of observations), mixed (lowest 25%<SDI< 25% highest),
and private (SDI<75% highest).
State Investment
Percentiles Smallest
1% 0.0398195 0.0270522
5% 0.0616589 0.0300375
10% 0.0783985 0.0311197
25% 0.1065715 0.0319722
50% 0.1656698 Mean 0.22558
Largest Std. Dev. 0.200344
75% 0.2776784 1.540368
90% 0.4254923 1.806794
95% 0.5457004 1.943139
99% 0.9040198 2.273595
0 0.1 0.2 0.3 0.4 0.5
Planned Mixed Private
Graph 1
Summary Averages by Investment Privatization
Urbanization
FDI
State Investment
Industrial Output Growth
0 100 200 300 400 500 600 700
Planned Mixed Private
Graph 2
Average Industrial Output & Privatization
A look at graph one that shows the average of urbanization, state investment and
industrial output per capita growth respectively, further proves the importance of this data
manipulation. All investment regimes have similar rates of urbanization, but planned investment
regimes have the highest confirming qualitative evidence that urbanization has had state
sponsorship. (Circa et. al, 2011) There also seems to be a slight but noticeable increase in
industrial output growth with increasing levels of privatization, which may mean convergence
rather than a difference due to privatization. This concern is put to bed by graph two, which
shows average real industrial output per capita in the sample studied by investment regime. This
actually shows that increasing privatization of investment increases the average total real
industrial output per capita. Therefore convergence cannot be the culprit of the increasing rates
of average industrial output growth per capita seeming to come from more privatization of
investment.
Planned investment economies average state investment at about 47% of GPP compared
to mixed investment economies that average at 17% of GPP, which makes the 30% difference in
means significant enough to produce reliable results. Privatized economies average 7% of GPP,
which is a full 10% lower than mixed economies, which again should provide reliable results on
the difference of investment regime. When estimating the regressions and separating the
observations by investment regime it should be able to reveal how FDI, privatization, and
urbanization in particular affects growth.
The vector Z which represents inflation, government expenditure, population growth, and
volume of trade is an important control vector used in growth literature (Levine and Renelt,
1992) with the technological trend dummy and urbanization added in to ensure robustness of
government expenditure is defined as the total government expenditure on public goods as a
share of GPP (not to be confused with state investment); population growth represents the
percentage change in total population each year relative to the previous year; trade openness is
defined as the total sum value of exports and imports relative to GPP; urbanization is defined as
total urban residents relative to the total population of the province; and the technological trend
dummy is simply a trend dummy meant to capture technological growth from year to year.
C. Data
Collecting all the data needed for this research required several sources in order to be
effective. I procured most of my data straight from the General Statistics Office of Vietnam’s
website and statistical yearbooks. I received data on government expenditure from the Ministry
of Finance and state direct investment from the Ministry of Planning and Investments. National
measures such as financial deepening and savings rate are taken from the Asian Development
Bank. My sample size will consist of all 64 provinces of Vietnam over the full time span. Due to
three provinces splitting off and one being absorbed into another during the time this research
covers, I balance the panel by combining the data of split and absorbed provinces with the
provinces they split from or were absorbed into to make the total unique provinces being
empirically tested, 60.
In addition to the quantitative data gathered in Vietnam, I also gathered qualitative data
from interviews with government officials and historical comparisons. Since the liberalization
reforms of 1986 known as “Doi Moi” Vietnam has sought to liberalize investment and privatize
industry slowly. One official at the Ministry of Investments and Planning informed me that the
Even though Vietnam’s Doi Moi happened before the break-up of the U.S.S.R., their path toward
liberalization almost foresaw the problems with quickly privatizing formerly state industries.
Creating private monopolies out of formerly state industries was also a concern in Israel
following the collapse of their currency and near default of their government in 1985. (Eckstein
& Ramot-Nyska, 2008) They also decided on privatizing investment and industry gradually,
coming up with a 14 year plan that would also liberalize trade and investment. (Eckstein &
Ramot-Nyska, 2008) Yet, after such a long time since this first opening, lingering state
investment still limits growth in formerly socialist economies. (Kosteved et. al., 2003) (Guariglia
& Poncet, 2008)
IV. Results
This section proceeds by first estimating and analyzing the baseline results. I test
equations one through nine, previously detailed in part A of section III. I then follow up with a
robustness check for endogenous factors in FDI spillovers on growth by using a 2-stage least
squares model. I confirm the positive and significant results for FDI found in Table 1, and from
there move on to my investment regime analysis. The results from the first table will motivate
the new model that makes use of an interaction variable tested in the third table, which breaks
apart the data by investment regime following the parameters mentioned previously in part B of
section III. I will then follow up with analysis on the results of Table 3, and finish by positing
and analyzing some arguments for the reasoning behind the empirical results found. Generally
the results can be summarized as pointing to a positive and statistically significant role in FDI
promoting industrial output per capita growth. Further increasing levels of urbanization and
suggesting that urbanized economies with high state investment are misallocating capital
resources leading to losses in growth.
A. Baseline OLS Results
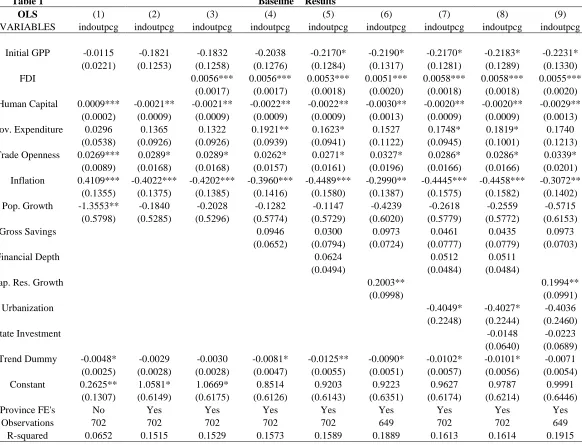
Table 1 Baseline Results
OLS (1) (2) (3) (4) (5) (6) (7) (8) (9)
VARIABLES indoutpcg indoutpcg indoutpcg indoutpcg indoutpcg indoutpcg indoutpcg indoutpcg indoutpcg
Initial GPP -0.0115 -0.1821 -0.1832 -0.2038 -0.2170* -0.2190* -0.2170* -0.2183* -0.2231* (0.0221) (0.1253) (0.1258) (0.1276) (0.1284) (0.1317) (0.1281) (0.1289) (0.1330) FDI 0.0056*** 0.0056*** 0.0053*** 0.0051*** 0.0058*** 0.0058*** 0.0055***
(0.0017) (0.0017) (0.0018) (0.0020) (0.0018) (0.0018) (0.0020) Human Capital 0.0009*** -0.0021** -0.0021** -0.0022** -0.0022** -0.0030** -0.0020** -0.0020** -0.0029**
(0.0002) (0.0009) (0.0009) (0.0009) (0.0009) (0.0013) (0.0009) (0.0009) (0.0013) Gov. Expenditure 0.0296 0.1365 0.1322 0.1921** 0.1623* 0.1527 0.1748* 0.1819* 0.1740
(0.0538) (0.0926) (0.0926) (0.0939) (0.0941) (0.1122) (0.0945) (0.1001) (0.1213) Trade Openness 0.0269*** 0.0289* 0.0289* 0.0262* 0.0271* 0.0327* 0.0286* 0.0286* 0.0339* (0.0089) (0.0168) (0.0168) (0.0157) (0.0161) (0.0196) (0.0166) (0.0166) (0.0201) Inflation 0.4109*** -0.4022*** -0.4202*** -0.3960*** -0.4489*** -0.2990** -0.4445*** -0.4458*** -0.3072**
(0.1355) (0.1375) (0.1385) (0.1416) (0.1580) (0.1387) (0.1575) (0.1582) (0.1402) Pop. Growth -1.3553** -0.1840 -0.2028 -0.1282 -0.1147 -0.4239 -0.2618 -0.2559 -0.5715
(0.5798) (0.5285) (0.5296) (0.5774) (0.5729) (0.6020) (0.5779) (0.5772) (0.6153)
Gross Savings 0.0946 0.0300 0.0973 0.0461 0.0435 0.0973
(0.0652) (0.0794) (0.0724) (0.0777) (0.0779) (0.0703)
Financial Depth 0.0624 0.0512 0.0511
(0.0494) (0.0484) (0.0484)
Cap. Res. Growth 0.2003** 0.1994**
(0.0998) (0.0991)
Urbanization -0.4049* -0.4027* -0.4036
(0.2248) (0.2244) (0.2460)
State Investment -0.0148 -0.0223
(0.0640) (0.0689) Trend Dummy -0.0048* -0.0029 -0.0030 -0.0081* -0.0125** -0.0090* -0.0102* -0.0101* -0.0071
(0.0025) (0.0028) (0.0028) (0.0047) (0.0055) (0.0051) (0.0057) (0.0056) (0.0054) Constant 0.2625** 1.0581* 1.0669* 0.8514 0.9203 0.9223 0.9627 0.9787 0.9991
(0.1307) (0.6149) (0.6175) (0.6126) (0.6143) (0.6351) (0.6174) (0.6214) (0.6446)
Province FE's No Yes Yes Yes Yes Yes Yes Yes Yes
Observations 702 702 702 702 702 649 702 702 649
R-squared 0.0652 0.1515 0.1529 0.1573 0.1589 0.1889 0.1613 0.1614 0.1915 Robust standard errors in parentheses *** p<0.01, ** p<0.05, * p<0.1
Table 1 reports the coefficients and significance of all coefficients used in each of the
a growth rate, the equations that contain that measure have a dip in observations, but certainly
not enough to cause any major concerns with the results. Since government expenditure data was
not available before the year 2000 as well, I report the baseline table excluding 1998 and 1999 in
the appendix, since very little changes.
The first equation is the most basic equation that only contains the controls in the Z
vector as well as initial GPP and human capital. The results are quite spurious as inflation seems
to be highly significant and positive. When the provincial fixed effects are turned on, it generates
far more reliable results with a significant jump in the R2 and a switching of the sign of inflation. Inflation is negative and highly statistically significant in all estimations suggesting that changes
in monetary and/or fiscal policy may be necessary to fix this problem. Inflation diminishes the
real value of output growth, robbing people of the benefits of a growing economy by causing
consumer prices to increase. I cannot provide any concrete monetary policy prescriptions based
solely on this research, however I can say with certainty that the issue must be addressed in order
to ensure the value of output growth is not lost in rising consumer prices.
Curiously in all estimations, other than the one without provincial fixed effects, human
capital is negative and statistically significant. This measure is used in previous literature
studying growth in Vietnam, but was found to be positive and statistically significant in terms of
GDP growth. (Anwar & Nguyen, 2009) In terms of industrial output growth it seems to be more
of a hindrance than an asset. This may be due to the University system in Vietnam either serving
as a means for workers to move from the industrial sector to the service sector, or that the system
is indeed churning out more highly skilled graduates in industrial fields that simply leave for
better pay in foreign countries. As for which the true culprit is in this case is beyond the purview
Trade Openness remains positive and statistically significant in all models, which
suggests that a provinces ability to generate exports as well as gain access to imports is important
in driving industrial output growth. Taken along with the positive significance seen for FDI in all
models in which it is included, the results suggest that opening Vietnam to trade and investment
from abroad has had a positive and significant role in promoting industrial output per capita
growth. Neo-classical economic theory predicts this relationship, so while the results are not
surprising, it is nonetheless important to point out that the provinces of Vietnam conform nicely
to the neo-classical economic theory based around this subject. (Lal, 2000)(Kohn,
2009)(Dawson, 2007)(Dawson, 1998)
The Solow convergence theory also holds, as the initial GPP coefficient ends up being
negative for growth. This confirms that smaller economies grow faster and that diminishing
returns cause the growth rate to diminish as economies increase in size. This is also confirmed by
the negative coefficient (albeit not statistically significant past the first equation) on population
growth. As labor increases in size we expect to see per capita growth rates shrink without some
major technological innovation that leads to an increase in output per worker. Since there have
been technological improvements over the years the coefficient is not statistically significant
suggesting that output per worker has indeed increased over the sample period.
The imprecision with which savings is calculated may account for the non-statistically
significant coefficients it has throughout all equations. However, it does remain positive
suggesting that at least the sign conforms to the Solow growth model in that it is positively
related to output growth. This in turn suggests that a more accurate reading of the savings rate
coefficients should not be significantly impacted by a more accurate measure of savings, and
therefore with confidence that my data is sound enough to be analyzed further.
Financial deepening is the most often used proxy for financial sector development, and
here it is used making the same imprecise estimation as savings. Again like savings it is not
statistically significant, but it is positive making the sign again conform to neo-classical
economic theory on financial depth as well as empirical evidence with more robust results
(Anwar & Nguyen, 2009) (Jao, 1976) (Odedokun, 1997) (King & Levine, 1993). Instead the
precise measure of the value of capital resource growth normalized by natural log used in
columns six and nine. These show positive and statistically significant results, which is a
promising sign for further models as this can be used as a reasonable proxy for financial sector
development. Since industrial output is heavily reliant on return on investment of capital, this
provides a perfect measure of how well the financial sector can assist capital owners in creating
return on investment capital in the face of capital depreciation. The baseline results show a
positive and significant coefficient, which suggests that return on investment in the form of
increasing value of capital resources is very important to output growth, which coincidentally is
supported by theoretical literature. (Solow, 1954)
Government expenditure and state investment have conflicting signs suggesting that
public expenditure is helpful (or at least not a detriment) to output growth, but that state
investment into SOE’s, joint-stock companies, and state run cooperative are detrimental to
growth. Government expenditure as a share of GPP only loses statistical significance when
savings is not included and when capital resource growth is included. These results conflict with
research done by Thanh (2014), which found that increases government expenditure and revenue
Nguyen study that found a positive and statistically significant role for increasing government
share in GPP growth. State investment is not statistically significant suggesting that the widely
ranging values on state investment may not be as detrimental as hypothesized earlier and found
by others previously (O’Toole & Newman, 2012) (Guariglia & Poncet, 2008) (Kosteved et al.,
2003). This ambiguity will further motivate later models that use a new interaction variable and
manipulate the data based on investment regime, which was previously presented in part B of
section III.
Finally, another curious result pops up in terms of urbanization. Usually most tend to
think urbanization should increase industrial output growth as they are more known to have these
kinds of enterprises versus more rural economies consisting of companies that produce more
agriculturally based products and services. Yet, the results indicate that it has a negative effect on
industrial output growth in all equations in which it is used, and statistically significant in all but
the final one. The final one uses capital resource growth, and therefore may provide a clue as to
how exactly state investment hurts industrial output growth.
The baseline results are an important window into just how industrial output growth has
been effected by FDI, privatization, and many other factors from before the millennium to the
present decade. Yet, I must make sure my results are robust to endogenous factors affecting
FDI’s growth spillovers. To accomplish this I make use of a 2-stage least squares model, to
instrument for endogeneity in the relationship of FDI to growth. In the next part of this section I
will briefly describe and analyze the second stage results of the 2SLS model in Table 2, as well
as the IV tests for first and second stage results also found in Table 2. The results indicate that
FDI is a positive and statistically significant causal factor in growth, confirming the results found
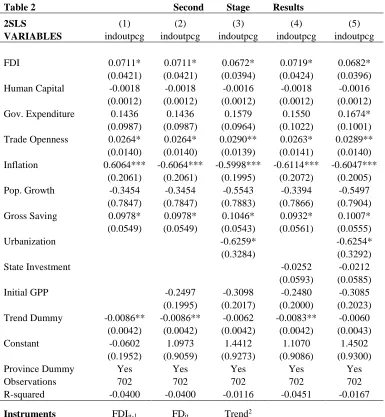
B. 2SLS Results
In order to ensure that the significance seen on FDI is not the result of endogenous factors
that may exist beyond the provincial fixed effects already used. I will use a 2SLS approach to
determine whether FDI’s effect on growth is robust in several models that specifically test for
endogeneity through the use of instrumental variables. The second stage results, instruments
used, and the corresponding test statistics are reported in Table 2. The results suggest that FDI is
consistently statistically significant and positive in terms of the effect it has on growth.
Table 2 Second Stage Results
2SLS (1) (2) (3) (4) (5)
VARIABLES indoutpcg indoutpcg indoutpcg indoutpcg indoutpcg
FDI 0.0711* 0.0711* 0.0672* 0.0719* 0.0682*
(0.0421) (0.0421) (0.0394) (0.0424) (0.0396) Human Capital -0.0018 -0.0018 -0.0016 -0.0018 -0.0016 (0.0012) (0.0012) (0.0012) (0.0012) (0.0012) Gov. Expenditure 0.1436 0.1436 0.1579 0.1550 0.1674* (0.0987) (0.0987) (0.0964) (0.1022) (0.1001) Trade Openness 0.0264* 0.0264* 0.0290** 0.0263* 0.0289**
(0.0140) (0.0140) (0.0139) (0.0141) (0.0140) Inflation 0.6064*** -0.6064*** -0.5998*** -0.6114*** -0.6047***
(0.2061) (0.2061) (0.1995) (0.2072) (0.2005) Pop. Growth -0.3454 -0.3454 -0.5543 -0.3394 -0.5497 (0.7847) (0.7847) (0.7883) (0.7866) (0.7904) Gross Saving 0.0978* 0.0978* 0.1046* 0.0932* 0.1007* (0.0549) (0.0549) (0.0543) (0.0561) (0.0555)
Urbanization -0.6259* -0.6254*
(0.3284) (0.3292)
State Investment -0.0252 -0.0212
(0.0593) (0.0585)
Initial GPP -0.2497 -0.3098 -0.2480 -0.3085
(0.1995) (0.2017) (0.2000) (0.2023) Trend Dummy -0.0086** -0.0086** -0.0062 -0.0083** -0.0060 (0.0042) (0.0042) (0.0042) (0.0042) (0.0043) Constant -0.0602 1.0973 1.4412 1.1070 1.4502
(0.1952) (0.9059) (0.9273) (0.9086) (0.9300)
Province Dummy Yes Yes Yes Yes Yes
Observations 702 702 702 702 702
R-squared -0.0400 -0.0400 -0.0116 -0.0451 -0.0167
IV Tests (1) (2) (3) (4) (5) F-Test 3.89*** 3.89*** 4.33*** 3.86*** 4.30*** Prob > F [0.0091] [0.0091] [0.0049] [0.0094] [0.0051] Anderson LM 12.71*** 12.71*** 14.15*** 12.63*** 14.09*** Chi-sq(3) P-val [0.0053] [0.0053] [0.0027] [0.0055] [0.0028]
Sargan 3.721 3.721 2.754 3.85 2.857
Chi-sq(2) P-val [0.1556] [0.1556] [0.2523] [0.1459] [0.2396] Standard errors in parentheses *** p<0.01, ** p<0.05, * p<0.1
The second stage results show FDI as positive and significant at the 10% level in all five
regression specifications. Furthermore the rest of the coefficients hold onto the same signs and
similar significance as in the baseline regression, suggesting that my baseline results are
consistent and robust to any endogeneity issues. The bottom part of Table 2 shows the three
instruments used in all five regressions as well as the test statistics relevant to each equation. I
will proceed by detailing my instruments and the justifications for their choice. I will then
conclude with a brief description of the tests used and how they further justify the use of the
model and instruments.
In all of my regressions I use the lag of FDI, financial depth of that year, and a trend2 dummy. It has been commonly accepted in the scholarly literature that the previous year’s share
of FDI to output has been used in 2SLS estimations (Alfaro & Charlton, 2007) and GMM
estimation (Anwar & Nguyen, 2009) (Anwar & Nguyen, 2010). This is a popular instrument due
to the possibility that growth actually increases FDI, so by using a one year lag of FDI as an
instrument it can better determine the causal direction of FDI and growth. However, on its own
it does not work well as an instrument, so next I also add the measure used to proxy for financial
It is reasonable to use M2 as an instrumental variable since financial development can
lead to higher FDI attraction (Anwar & Nguyen, 2010), which will cause an increase in growth.
Yet, this would mean that what is really being measured is not FDI’s effect on growth, but rather
its’ effect on financial sector depth. To control for this possibly endogenous intervening factor
the composite M2 measure calculated using national figures and provincial GPP will act as an
instrumental variable. Again this has been used in both GMM and 2SLS estimations (Anwar &
Nguyen, 2010), so the scholarly and statistical backing is sound.
Finally, the models also use a quadratic trend dummy (trend2) to account for non-linear trends associated with FDI. One of these non-linear trends is diminishing marginal costs of
investment. Once FDI is undertaken it is much easier for the MNC or SWF of the host country to
continually funnel more FDI into the company, which is most likely due to less legal, regulatory,
and exploratory costs associated with further investment. Also the amount of FDI each province
receives each year over time is non-linear as well further showing the need for a non-linear trend
dummy as an instrument for FDI. These justifications have strong statistical backing as seen in
the results of the predictive power test and identification tests reported in Table 2.
The bottom of Table 2 reports three relevant test statistics and their p-values underneath
them. The first of these is the F-Test, which tests the significance of the models’ predictive
power. I am delighted to report that all F-Tests are significant at the 1% level indicating that each
model is highly predictive and useful in drawing conclusions from the results, despite the
statistic itself being below the rule of thumb (10). The second test is for under identification of
instruments, which has a null hypothesis that the matrix of reduced form coefficients has
rank=K1-1(under identified), while the alternative hypothesis is that the matrix has rank=K1
which in all equations is statistically significant at the 1% level. This confirms that the
instruments are rank identified, and thus reject the null hypothesis in favor of the alternative
hypothesis. The final test is the Sargan test, which has a null hypothesis of the absence of over
identification and an alternative hypothesis of over identification. In all equations we cannot
reject the null hypothesis of the absence of over identification. The instruments as well as models
are robust to these tests, so with confidence we can trust the descriptive power of both.
The results of part B give confidence moving forward that FDI is indeed significant,
positive, and robust to endogeneity testing. Previous research done by Anwar and Nguyen (2009)
as well as Thanh (2014) made use of a GMM model for their research into growth in Vietnam’s
provinces to account for endogeneity. In this vein I also ran a GMM estimation with first and
second lags of FDI and output growth collapsed and again using the lag of FDI and financial
sector development as instruments to deal with possible heteroskedasticity issues in 2SLS
estimation. The results can be found in the appendix and further confirm the 2SLS results. Thus,
the 2SLS approach is just as relevant and provides a simple way to test for endogeneity without
the sensitivity to lag arguments that GMM estimation is prone to. Further, with 2SLS used to
confirm the results found in OLS, I can proceed with OLS estimation as I know it will provide
results that are robust to endogeneity. Therefore in part C, I will proceed with my previous OLS
using fixed effects model approach when testing for how FDI, capital resource growth, and
urbanization affect growth under different levels of privatized investment.
C. Investment Regime OLS Results
Thus far the results have essentially replicated and to some degree confirmed much of
Nguyen, 2009) (Anwar & Nguyen, 2010) (O’Toole & Newman, 2012). However, some research
has shown that state investment (O’Toole & Newman, 2012) (Anwar & Nguyen, 2010) is
negative and statistically significant, yet my results do not show any significance on this
measure. Another result that is odd is the negative and statistically significant sign urbanization
takes in relation to growth. As previously stated this does not conform well to economic theory,
but it does suggest that state investment may be especially harmful to industrial output in more
urban settings. A report by the World Bank (Circa et. al, 2011) explains that land in urban areas
are priced in a two tier system where the government buys land from those who own it at a “set
price” and then once the land is developed or resold it is allowed to be priced by the market.
“The two-price system transfers huge value and benefits, and creates opportunity for coalition
between two powerful groups of actors – developers (often SOEs), investors, and speculators
(who benefit greatly and directly from the two-price system) and state officials (who are the
gate-keepers of the regulations that determine this benefit).” (Circa et. al, 2011. p. 153)
The harmful effects of the two-price system for land could translate into misallocation of
capital resources. Further, this effect should be more observable in provinces with highly
planned investment regimes. With this in mind I introduce a new interaction variable that should
be able to approximate the effect capital growth and urbanization has on growth under different
investment regimes. Equation (9) translates equation (10) into the functional form where each
variable is measured not only by time “t” and province “i”, but also by investment regime “j.”
Equation (10) simply adds the interaction of urbanization and capital resource growth as the
variable that will be used to study the effects capital growth and urbanization has on different
Growthitj = α0 + φIGPPij + βFDIitj + ρHCitj + Zitj + GSitj + θCRG itj + γSDIitj + μUrbanitj +
τTrendt +λPFEitj + εitj (9)
Growthitj = α0 + φIGPPij + βFDIitj + ρHCitj + Zitj + GSitj + θCRG itj + γSDIitj + μUrbanitj +
η(UrbanitjXCRGitj) + τTrendt +λPFEitj + εitj (10)
Another important component of this estimation comes in the form of estimating how
FDI affects growth when it has to compete with different levels of state investment. FDI is an
important component to liberalization of investment, and has profound effects on growth
especially for LDC’s (Odedokun, 1997). If growth spillovers from FDI can be significantly
affected by having to compete with state investment, than it is reasonable to assume that
privatization will yield better results for FDI. The results indicate a much better outcome for both
capital resource growth in urban areas, and FDI with mixed and private investment economies.
The results of this estimation can be seen in Table 3.
The first two columns test all provinces with the new interaction term, changing only
what is used to measure financial sector development in the interest of robustness. However, I
use capital resource growth from then on as it is statistically significant and more accurately
measured than financial deepening. The results seen in columns one and two indicate an
important difference in capital resource growth of highly urban areas and capital resource growth
in less urban areas. Other coefficients are very similar to the previous regressions, and therefore
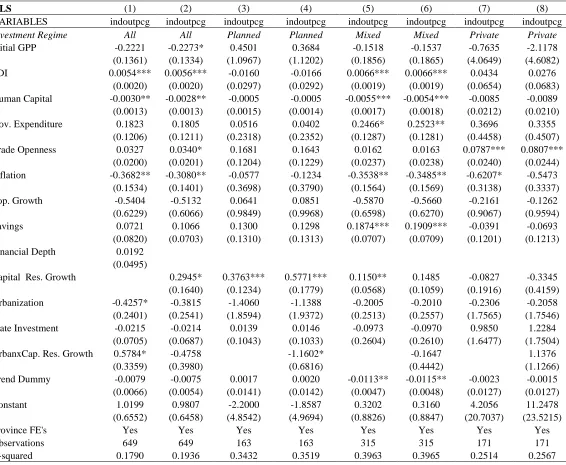
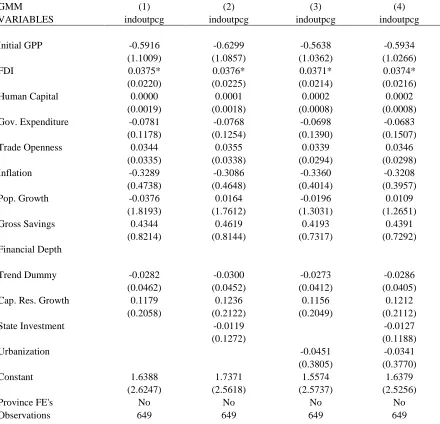
Table 3 Privatization Results
OLS (1) (2) (3) (4) (5) (6) (7) (8)
VARIABLES indoutpcg indoutpcg indoutpcg indoutpcg indoutpcg indoutpcg indoutpcg indoutpcg Investment Regime All All Planned Planned Mixed Mixed Private Private Initial GPP -0.2221 -0.2273* 0.4501 0.3684 -0.1518 -0.1537 -0.7635 -2.1178 (0.1361) (0.1334) (1.0967) (1.1202) (0.1856) (0.1865) (4.0649) (4.6082) FDI 0.0054*** 0.0056*** -0.0160 -0.0166 0.0066*** 0.0066*** 0.0434 0.0276
(0.0020) (0.0020) (0.0297) (0.0292) (0.0019) (0.0019) (0.0654) (0.0683) Human Capital -0.0030** -0.0028** -0.0005 -0.0005 -0.0055*** -0.0054*** -0.0085 -0.0089 (0.0013) (0.0013) (0.0015) (0.0014) (0.0017) (0.0018) (0.0212) (0.0210) Gov. Expenditure 0.1823 0.1805 0.0516 0.0402 0.2466* 0.2523** 0.3696 0.3355
(0.1206) (0.1211) (0.2318) (0.2352) (0.1287) (0.1281) (0.4458) (0.4507) Trade Openness 0.0327 0.0340* 0.1681 0.1643 0.0162 0.0163 0.0787*** 0.0807***
(0.0200) (0.0201) (0.1204) (0.1229) (0.0237) (0.0238) (0.0240) (0.0244) Inflation -0.3682** -0.3080** -0.0577 -0.1234 -0.3538** -0.3485** -0.6207* -0.5473 (0.1534) (0.1401) (0.3698) (0.3790) (0.1564) (0.1569) (0.3138) (0.3337) Pop. Growth -0.5404 -0.5132 0.0641 0.0851 -0.5870 -0.5660 -0.2161 -0.1262 (0.6229) (0.6066) (0.9849) (0.9968) (0.6598) (0.6270) (0.9067) (0.9594) Savings 0.0721 0.1066 0.1300 0.1298 0.1874*** 0.1909*** -0.0391 -0.0693 (0.0820) (0.0703) (0.1310) (0.1313) (0.0707) (0.0709) (0.1201) (0.1213) Financial Depth 0.0192
(0.0495)
Capital Res. Growth 0.2945* 0.3763*** 0.5771*** 0.1150** 0.1485 -0.0827 -0.3345 (0.1640) (0.1234) (0.1779) (0.0568) (0.1059) (0.1916) (0.4159) Urbanization -0.4257* -0.3815 -1.4060 -1.1388 -0.2005 -0.2010 -0.2306 -0.2058 (0.2401) (0.2541) (1.8594) (1.9372) (0.2513) (0.2557) (1.7565) (1.7546) State Investment -0.0215 -0.0214 0.0139 0.0146 -0.0973 -0.0970 0.9850 1.2284
(0.0705) (0.0687) (0.1043) (0.1033) (0.2604) (0.2610) (1.6477) (1.7504)
UrbanxCap. Res. Growth 0.5784* -0.4758 -1.1602* -0.1647 1.1376
(0.3359) (0.3980) (0.6816) (0.4442) (1.1266)
Trend Dummy -0.0079 -0.0075 0.0017 0.0020 -0.0113** -0.0115** -0.0023 -0.0015 (0.0066) (0.0054) (0.0141) (0.0142) (0.0047) (0.0048) (0.0127) (0.0127) Constant 1.0199 0.9807 -2.2000 -1.8587 0.3202 0.3160 4.2056 11.2478 (0.6552) (0.6458) (4.8542) (4.9694) (0.8826) (0.8847) (20.7037) (23.5215)
Province FE's Yes Yes Yes Yes Yes Yes Yes Yes
Observations 649 649 163 163 315 315 171 171
R-squared 0.1790 0.1936 0.3432 0.3519 0.3963 0.3965 0.2514 0.2567
Robust standard errors in parentheses *** p<0.01, ** p<0.05, * p<0.1
Provinces with highly planned investment regimes benefit most greatly from capital
resource growth. However, when this is interacted with urbanization the coefficient is negative
and statistically significant at the 10% level. This shows some evidence for capital misallocation
such as the two-price system for land. Further FDI is now negative and not statistically
significant. This indicates that while on average FDI makes up a bigger share of planned
investment economies than their private counter parts, they are not able to yield positive
spillovers. The classic issues with high amounts of state investment outlined in previous research
(Kosteved et al, 2003) (O’Toole & Newman, 2012) (Guariglia & Poncet, 2008) as well as urban
economic policy research (Circa et al., 2011) are confirmed by the results of columns three and
four. Results here need to be held with some reservations as little significance was found overall.
Provinces that have a mix of state and private investment relative to other provinces have
the strongest statistical results. Here we see FDI as positive and very statistically significant
indicating that reducing state investment actually increases the growth spillovers of FDI. The
new interaction is negative, but no longer statistically significant and the coefficient is greatly
reduced as well. Government expenditure is positive throughout the estimation, but is only
statistically significant in mixed economies. Savings are also statistically significant and positive
indicating an important role of emerging private investment through private savings in mixed
economies. These results relative to those found in planned investment economies are
encouraging results in terms of showing the positive effects of privatization.
The results for privatized economies are a bit more nuanced, but continue to lend support
to the proposition that privatization is indeed important in facilitating growth. FDI remains
positive, but loses significance. This may either be interpreted as a need for more state
investment in these privatized economies in order to be able to benefit more noticeably from
FDI, or that private domestic investment is expansive enough to the point where FDI is no longer
a major source of finance for the highest producing industrial establishments. The coefficient on
statistically significant. While also not statistically significant, the urbanization and capital
resource growth interaction is now positive indicating that capital resource growth in urbanized
provinces with less state involvement do not face the same capital misallocation that planned
investment economies do. Another interesting result is that while we have seen trade openness as
positive at the ten percent significance level in the baseline regressions it is only in private
economies that this is statistically significant and at the one percent level. This indicates that
privatized economies are the best suited to translate trade into industrial output growth, which
fits perfectly with neo-classical economic growth theory.
The testing by investment regime does not change the negative coefficient on human
capital, but it is only significant in mixed economies. It seems that no matter the model or
observational specifications, higher levels of human capital as measured by the number of
university students per one thousand residents has a negative effect on industrial output growth.
This may be happening for one of several reasons that are outside of the purview of this study to
explain. It may be that increasing opportunities for people to increase their productivity is
leading them to leave for more lucrative offers abroad, which may in turn leave only the least
productive workers. A less plausible scenario still worth considering is that the university system
is creating opportunities for people outside of the industrial sector, and therefore industrial
businesses relocate due to shrinking labor pool. Either of these explanations could be tested in
further research.
Inflation also remains negative and for the most part statistically significant, again despite
any changes in the model used or the variable specifications. This result is important in that it
indicates that increases in consumer prices play a rather large role in negatively affecting
has featured a continual devaluing of its’ currency in relation to the dollar. However, the results
here indicate that monetary authorities should be reluctant to continue this trend and consider
what they can do to make prices more uniform among all provinces.
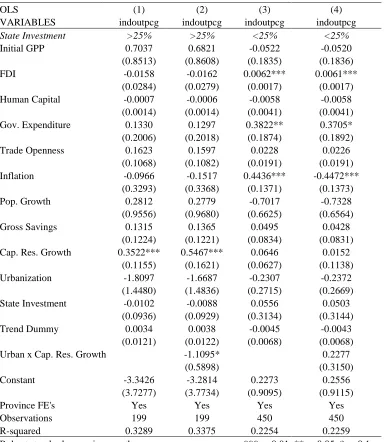
Overall these results indicate some important trends associated with privatization of
investment. On average state investment in provinces has dropped from its’ 2005 peak at just
over 25% of output to just below 16% as a share of output in 2012. Over this time growth has
greatly expanded and continued to grow even despite the recent financial crisis. In my final table
I go on to test the effects of these variables under only two investment regimes, planned being
state investment higher than 25% of GPP and private being lower than 25% of GPP. Here the
results are robust and further confirm the importance of keeping state investment below a quarter
of GPP.
Clearly from the table below we can see that using state investment measured as a share
of GPP has important consequences when reaching the 25% threshold. FDI remains positive and
statistically significant for privatized provinces, while FDI is negative and not statistically
significant for more planned provinces. Interesting to note is that human capital is no longer
significant suggesting that the previous results on education are not economically significant and
are sensitive to changes in the data. Government expenditure is only statistically significant for
the sub 25% cohort suggesting that public expenditure is more beneficial when there is a more
robust private investment market. Again we see a negative and statistically significant sign on
the urbanization and capital resource growth interaction term for the provinces above the 25%
threshold confirming the negative relationship between industrial output growth and growth of
is that trade openness is no longer statistically significant, which would suggest that to gain from
trade provinces need to lower state investment even further to around 10% of GPP.
Table 4
OLS (1) (2) (3) (4)
VARIABLES indoutpcg indoutpcg indoutpcg indoutpcg State Investment >25% >25% <25% <25%
Initial GPP 0.7037 0.6821 -0.0522 -0.0520
(0.8513) (0.8608) (0.1835) (0.1836)
FDI -0.0158 -0.0162 0.0062*** 0.0061***
(0.0284) (0.0279) (0.0017) (0.0017) Human Capital -0.0007 -0.0006 -0.0058 -0.0058 (0.0014) (0.0014) (0.0041) (0.0041) Gov. Expenditure 0.1330 0.1297 0.3822** 0.3705* (0.2006) (0.2018) (0.1874) (0.1892) Trade Openness 0.1623 0.1597 0.0228 0.0226
(0.1068) (0.1082) (0.0191) (0.0191) Inflation -0.0966 -0.1517 0.4436*** -0.4472***
(0.3293) (0.3368) (0.1371) (0.1373)
Pop. Growth 0.2812 0.2779 -0.7017 -0.7328
(0.9556) (0.9680) (0.6625) (0.6564)
Gross Savings 0.1315 0.1365 0.0495 0.0428
(0.1224) (0.1221) (0.0834) (0.0831) Cap. Res. Growth 0.3522*** 0.5467*** 0.0646 0.0152
(0.1155) (0.1621) (0.0627) (0.1138) Urbanization -1.8097 -1.6687 -0.2307 -0.2372 (1.4480) (1.4836) (0.2715) (0.2669) State Investment -0.0102 -0.0088 0.0556 0.0503
(0.0936) (0.0929) (0.3134) (0.3144)
Trend Dummy 0.0034 0.0038 -0.0045 -0.0043
(0.0121) (0.0122) (0.0068) (0.0068)
Urban x Cap. Res. Growth -1.1095* 0.2277
(0.5898) (0.3150)
Constant -3.3426 -3.2814 0.2273 0.2556
(3.7277) (3.7734) (0.9095) (0.9115)
Province FE's Yes Yes Yes Yes
Observations 199 199 450 450
R-squared 0.3289 0.3375 0.2254 0.2259
Robust standard errors in parentheses *** p<0.01, ** p<0.05, * p<0.1
V. Conclusion
While my study is not the first to look at FDI and its’ effect on growth, it is the first to
resource growth and urbanization on industrial output growth between provinces. Furthermore I
used several measures for financial sector development in order to ensure that results are
consistent under many specifications, which is scarce in the literature dealing with financial
sector development. My aim for this research is not only to uncover relationships between FDI
and growth, but also to see how this relationship plays out under different investment regimes.
Yet, like much empirical work in macroeconomics there have been quite a few new questions
raised by the results that may provide the starting point for further research.
A. Further Research
My research is not the first to delve into the topic of how state involvement may affect
growth in different provinces of Vietnam (Kosteved et al., 2003) (Thanh, 2014), yet mine is the
first to make a clear distinction between government expenditure (for public goods) and state
investment (state funds supporting SOE’s, joint stock companies, cooperatives, etc.). However,
interesting results pop up throughout each estimation that does not conform to much of the
previous literature on urbanization and human capital. In all estimations both of these measures
are negative and statistically significant, as well. This should motivate new research on the
negative growth effects of urban policies in Vietnam, as well as the true reasoning behind a loss
of industrial output growth by the increase of University students in different provinces. In the
results section I posited some reasons for why this is, but without further research it is just not
possible to know for sure.
Another important area of study that may yield important results is to test for exactly how
state investment hurts output growth. This may take the form of looking at the output differences
which state industries lag the most behind their private sector competitors. The avenues for
research in this realm are practically endless, but it should be of interest to policy makers and
researchers alike as to where exactly the most inefficiency is found.
B. Policy Recommendations
To close, I would like to lay out some policy prescriptions that I believe policy makers
should pursue in the interest of continuing to increase growth. These recommendations are based
primarily on the results found in my empirical testing, but they are also based somewhat on
review of the relevant economic history and literature of and based on Vietnam. Listed below are
the four policies I believe will help Vietnam most evenly spread across all provinces the
economic growth it continues to see.
1. Bring down state investment levels in highly planned provinces to below 25% of GPP. Money could be better spent as public expenditure.
2. Scrap the two-price system currently instituted in urban areas, in favor of a free market in urban property.
3. Continue pursuing policies to encourage FDI.
4. Continue lowering barriers to trade.
Based upon my research I would first and foremost recommend that policy makers
actively work to decrease state investment to 25% for all those provinces above that line. My last
table that uses this rule shows the importance of limiting state investment to one quarter of GPP.
The easiest way to achieve this would be to gradually switch SOE’s over to joint stock
sponsored enterprise and increase growth. Further, it seems much more prudent for government
officials to be spending money on truly public projects (roads, sewers, garbage collection, etc.)
than to have their focus being diverted too much toward running businesses the private sector
could do a much better job of.
The evidence from my test and the results from related literature (Circa et al., 2011)
suggest that Vietnam needs to reevaluate and most likely totally scrap the two-price system for
land in urban areas. While Circa et al. (2011) focused on the negative effect this has had on
buyers in the housing market (low supply/high prices/property rights violations), my study
focused on its’ negative effects on growth through the misallocation of capital resources. There
is no economically sound reasoning for keeping this blatantly corrupt system around, and the
violations of human rights through nationalization of legally owned private property is morally
dubious at best.
The third and fourth recommendations go along with neo-classical growth theory, as it is
generally believed (and confirmed here) that economies more open to trade and investment from
abroad will grow faster. This is particularly important if policy makers wish to continue to lower
the share of state investment to the output. While a robust domestic investment market is
emerging rapidly in Vietnam, FDI is an important source of investment that can fill the void of
needed investment into an economy. Trade has been a big part of Vietnam’s success due mostly
to the export oriented industries that have set up there recently. Yet, imports are also a very
important part of growth, particularly in the industrial sector. This is because intermediate and
capital goods used to produce what is exported are an important part of the production process.
Lowering barriers to these imports could be an excellent way to improve the output of