ISSN 2324-805X E-ISSN 2324-8068 Published by Redfame Publishing URL: http://jets.redfame.com
Adaptation of the Mathematics and Technology Attitudes Scale (MTAS)
Into Turkish: Validity and Reliability Studies for Middle School Students
Mesut Tabuk
Correspondence: Mesut Tabuk, Canakkale Onsekiz Mart University, Turkey.
Received: April 9, 2018 Accepted: May 8, 2018 Online Published: May 15, 2018
doi:10.11114/jets.v6i7.3172 URL: https://doi.org/10.11114/jets.v6i7.3172
Abstract
The paper aims to present the adaptation study of “The Mathematics and Technology Attitudes Scale (MTAS)” into Turkish. The original form MTAS was developed by Pierce, Stacey and Barkatsas (2007) in order to investigate the effect of five different variables in learning mathematics with technology. The original form of the attitudes scale consists of 20 items that are rated on a Likert-type 5-point scale. The MTAS also comprises five factorial dimensions in order to measure five different variables. The data were gathered from 1990 middle school students in order to show validity and reliability of MTAS. The analyses are completed in two phases. In the first stem EFA and CFA was conducted. Then the reliability coefficients were calculated. According to the findings of applied analyses, it was found that Turkish form of MTAS, that has completely similar factor structure to original form, is a reliable and valid scale for assesment of middle school students’ attitude towards learning mathematics with technology.
Keywords: attitude, scale adaptation, mathematics, technology, middle school
1. Introduction
The field of social psychology has been considered a composite of heterogeneous parts, but attitudes have always been the most important and fundamental concepts in the social psychology (McGuire, 1985). In fact, social psychology was defined as the scientific study of attitudes in pioneer researches (Allport, 1935). It is very reasonable to emphasize Allport’s (1935) prominent determination that attitudes are “the most distinctive and indispensable concept in American social psychology”. Allport’s this famous dictum obviously was true in the past, but also true even today, almost eighty five years later. It has also been noted, almost fifteen years ago, that the number of the published items in a literature search on the concept of 'attitude' is more than 50,000. The attitude concept is popular because it is the most important determinants in the prediction and explanation of human behavior (Visser and Cooper, 2003).
Similarly in the literature about mathematics education the attitude has a long history and a very high popularity. Many researchers have revealed that the students’ attitude towards mathematics is the most important determinant their mathematics achievement (Ma and Kishor, 1997). In the consideration of the achievement in mathematics, a large number of investigations focus on two subject; cognitive factors and affective factors. In teaching and learning interaction process, cognitive factors are influenced by affective factors (McLeod, 1992). Furthermore, there is a comprehensive body of research on affective factors, focusing mainly on attitudes (Ernest, 1989) because its influence over the students’ behavior.
In mathematics education literature, the attitude has also a long history. Despite of the attitude’s long history, the theoretical definition and the construct of attitude are ambiguous (Hannula, 2002). As a result of this, the trend in the attitude researches inclined more toward the construction of measurement tools rather than toward the methodological contributions about the theoretical construction and definition attitude (Di Martino and Zan, 2001). But considering the discussion on the structure and definition of attitude there are also many different theoretical models, proposed by the different scholars. Attitude towards technology is accepted one of the key concepts in some of these proposed theoretical models such as Technology Acceptance Model (TAM). TAM is an application of attitude as a model of attitude, suggested by Davis (1993). The basic approach of the model can be summarized that attitude towards technology influences on the usage technology. In turn, effective usage of technology also influences on attitude towards technology.
Attitudes towards learning mathematics with technology
environments, offers many advantages in teaching mathematics (Baki ve Güveli, 2008). In recent years, especially after the FATIH (Movement to Improve Opportunities and Technological Improvement) project in 2010, educators and researchers have focused on the impact of technology in mathematics education (Pamuk et all., 2013). Considering the studies in this area it is observed that students' attitudes towards mathematics are investigated only, but the attitudes towards technology are relatively neglected. However, some researches have revealed that the inclusion of technology in teaching mathematics is more closely related to attitudes towards technology rather than attitudes toward mathematics (Pierce et al., 2007).
A hypothesized model for the MTAS has been proposed by Pierce et al. (2007) in a mathematics curriculum development project titled "RITEMATHS" in Australia. The RITEMATHS is an experimental mathematics curriculum development project for middle schools. In the content of the project, it is also aimed to observe the attitudinal changing of students in mathematics learning process to consider the best implementation of technology in mathematics learning environment.
The MTAS, developed by Pierce et al. (2007), is a measurement tool consisting of 20 items of 5 Likert types collected under five factors. A theoretical model has also been put forward that identifies the conceptual framework of the scale development studies. In this respect, the theoretical model is based on attitude to the use of technology to learn mathematics (MT), mathematics confidence (MC), confidence in using technology (TC), behavioral engagement (BE) and. affective engagement (AE). The scale has 5 factors aiming to measure these 5 variables. The validity of the model structure was also demonstrated by the results of another study previously conducted by Pierce and Stacey (2004).
The instrument for measuring students’ attitudes to learning mathematics with technology was adapted to Turkish in some previous studies conducted by different working groups composed of high school (Duru, Peker and Akçakın, 2010; Gürbüz, Çavuş-Erdem and Toprak, 2015) and university (Dedeoğlu, Çaylan, Takunyacı and Ergene, 2017) students. However, the lack of adaptation studies with secondary school students and the fact that the factorial structures of the Turkish form of the measurement tool differed from those of the previous studies have suggested that the adaptation study should be done again with middle school students.
2. Method
This research is a scale adaptation study, designed according to quantitative paradigm. The purpose of the study present presented in the paper is to adapt the MTAS developed into Turkish language and to determine its psychometric features such as validity and reliability. In the study, the scale adaptation procedure, recommended by Hambleton and Patsula (1999) was applied.
2.1 Participants
Analysis in the study was carried out on two different data set gathered from two distinct sample groups, composed of total 1753 middle school students graders in different schools throughout the Çanakkale Province Center. The participants were selected via convenience sampling technique. Exploratory factor analysis (EFA) was conducted on the data gathered from the first sample group, composed of 1068 students. Confirmatory factor analysis (CFA) was performed by the second group, composed of 685 students.
In the literature, it is recommended that at least 300 people should be taken as participants in factor analysis studies (Tabachnick and Fidell, 2007). In some other studies, it is stated that participation should be five or ten times the number of items in the scale (Bryman and Cramer, 2001). In the study, the entire recommended criterion is supplied as a number of participants. Demographic information about participant students in the study is given in Table 1.
Table 1. Grade and gender distribution of students
EFA CFA
Gender 5th 6th 7th 8th Total 5th 6th 7th 8th Total Girl 104 85 799 162 550 74 102 81 82 339 Boy 102 97 167 152 518 79 109 104 54 346 Total 206 182 366 314 1068 153 211 185 136 685
2.2 Instrument
2.3 Data Analysis
The original scale in English, it was already translated into Turkish (Duru et all., 2010; Gürbüz, et all., 2015). The original and translated forms are submitted to a group of experts in order to supply the concept validity of MTAS. After the arrangements were made according to the advices of the experts, the final version of the scale was administered to 1753 students in 5th, 6th, 7th and 8th classes of middle schools. Psychometric properties of MTAS were tested by confirming the construct validity and reliability. EFA and CFA were applied in the investigation of the construct validity. In addition, the Cronbach's alpha coefficients were calculated for the reliability analysis.
3. Results
3.1 Exploratory Factor Analysis (EFA) Results
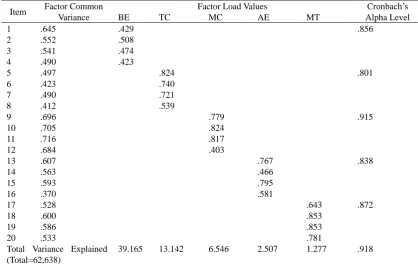
In the demonstration of the construct validity of MTAS, EFA was performed according to the recommendations in the relevant literature (Büyüköztürk, 2012). As a priory EFA Kaiser Meyer-Olkin (KMO) value which needs to be over .50, was examined. It (.939) was found significant with Bartlett Test (χ2 =12151.04, df=190, p<.001) (Hair, Black, Babin and Anderson, 2010). Based on these test results, data is considered is appropriate for the factor analysis. Because there is a correlation between the factors in the original form of MTAS, in EFA direct oblimin rotation technique was applied. As a result of EFA, presented in Table 2, the MTAS comprises 20 items and 5 factors that each factor consists of four items. The Turkish form of MTAS is identical to the original form.
Table 2. EFA results of MTAS
Item Factor Common Variance
Factor Load Values Cronbach’s
Alpha Level
BE TC MC AE MT
1 .645 .429 .856
2 .552 .508
3 .541 .474
4 .490 .423
5 .497 .824 .801
6 .423 .740
7 .490 .721
8 .412 .539
9 .696 .779 .915
10 .705 .824
11 .716 .817
12 .684 .403
13 .607 .767 .838
14 .563 .466
15 .593 .795
16 .370 .581
17 .528 .643 .872
18 .600 .853
19 .586 .853
20 .533 .781
Total Variance Explained (Total=62,638)
39.165 13.142 6.546 2.507 1.277 .918
Table 2 shows that after EFA, it is observed that The Turkish form of MTAS comprises 20 items and 5 factors. Each factor contains four items. The total variance, explained by the first factor, is 39.165. The second factor explains 13.142% of the total variance, third 6.546%, fourth 2.507%, and fifth 1.277%. The 20 items of MTAS under five factors in total explain 62.638% of the variance. Therefore, the results shows factor loadings of items in MTAS ranges from .403 to .853. Finally, while considering communalities that are accepted the indicator of the amount that each item explains the variance; common factor variance values of the MTAS’s items are ranging from .370 to .716. In the literature the recommended reference values for factor loading is minimum .40 and over. The reference value for common factor variance is recommended to be at least .30 and over (Hair et al., 2010).
Finally, the reliability coefficients of the scale are also listed in Table 2. The calculated reliability coefficient for entire scale is .918. The other coefficients obtained for five factors range between .801 and .915. It is stated that Cronbach’s alpha coefficients should be at least on the level of .70 and above (Hair et al., 2010).
3.2 Confirmatory Factor Analysis (CFA) Results
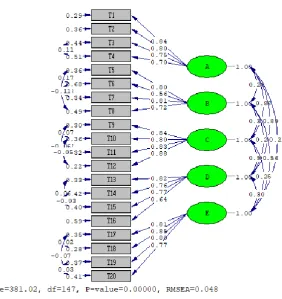
Figure 1. First-level CFA path diagram
According to the diagram in Figure 1, it is observed that item factor loads range from .56 to .88. When the fit indices of the model were taken into consideration, the calculated Chi-Square (2) value is 381.02 and degree of freedom (df) is 147. As a result, firstly the model is statistically significant (p<0.001), secondly χ2/sd ratio is 2.5919 is an indicator of perfect fit and all factor loads are obtained larger than 0.30 (Büyüköztürk, 2012). In addition, the other fit indices of the model that are obtained after the performed CFA, are listed in Table 3.
Table 3. CFA results of MTAS*
Fit index Perfect fit Acceptable fit Research findings Results
RMSEA .00 ≤ RMSEA≤ .05 .05 ≤ RMSEA≤ .10 .048 Perfect fit
GFI .95 ≤ GFI ≤ 1.00 .90 ≤ GFI ≤ .95 .95 Perfect fit
AGFI .90 ≤ AGFI ≤ 1.00 .85 ≤ AGFI ≤ .90 .92 Perfect fit
CFI .97 ≤ CFI ≤ 1.00 .95 ≤ CFI ≤ .97 .99 Perfect fit
NFI .95 ≤ NFI ≤ 1.00 .90 ≤ NFI ≤ .95 .98 Perfect fit
χ2/sd 0 ≤ χ2 /sd ≤ 3 3 ≤ χ2 /sd ≤ 4 381.02/147=2.5919 Perfect fit
*Schermelleh-Engel and Moosbrugger, (2003)
The major purpose of CFA is to examine the goodness of fit indices. In accordance with the findings presented in Table 3, all indices are in perfect fit. As a result, the factorial structure of the MTAS, obtained from EFA and from the theoretical model has been confirmed by CFA.
4. Conclusion
The major purpose of the presented study in this paper is the adaptation of the MTAS, developed by Pierce et al. (2007) into Turkish for middle school students and to determine its psychometric features such as reliability and validity. The reliability of the MTAS was determined by calculating the internal consistency coefficients. EFA and CFA were conducted in order to examine the validity of the MTAS.
ranged from .801 to .915. As a result, calculations showed that the reliability coefficients of MTAS are adequate.
According to finding of applied validity and reliability analyses, it was found that Turkish form of the MTAS has identical factorial structure to the original form of the scale. As a result, Turkish form of MTAS is a reliable and valid scale in order to measure five variables related to attitude towards mathematics and technology.
References
Allport, G. W. (1935). Attitudes. In A Handbook of Social Psychology (pp. 798-844). Worcester, MA, US: Clark University Press.
Baki, A., & Güveli, E. (2008). Evaluation of a web based mathematics teaching material on the subject of functions.
Computers & Education, 51, 854–863. https://doi.org/10.1016/j.compedu.2007.09.003
Bryman, A., & Cramer, D. (2001). Quantitative Data Analysis with SPSS Release 1o for Windows, Routledge, London. Büyüköztürk, Ş. (2012). Data Analysis Handbook for Social Sciences (2nd Edition) Ankara: Pegem Akademik Press. Davis, F. (1993). User acceptance of information technology: system characteristics, user perceptions and behavioral
impacts. International Journal of Man-Machine Studies, 38, 475–487. https://doi.org/10.1006/imms.1993.1022 Dedeoğlu, N., Çaylan, B., Takunyacı, M., & Ergene, Ö. (2017) Matematik ve Teknoloji Tutum Ölçeği (Mttö): Geçerlik
ve Güvenirlik Çalışması. International Conference on Quality in Higher Education (ICQH 2017) Özet Kitapçığı
içinde (s. 179). Sakarya: Sakarya Üniversitesi.
Di Martino, P., & Zan, R. (2010). ‘Me and maths’: Towards adefinition of attitude grounded on students’ narratives.
Journal of Mathematics Teacher Education, 13(1), 27–48. https://doi.org/10.1007/s10857-009-9134-z
Duru, A., Peker, M., & Akçakın. (2010). Lise Öğrencilerinin Bilgisayar Destekli Matematik Öğrenmeye Yönelik Tutumları [High School Students’ Attitudes Toward Computer Assisted Learning in Mathematics]. Turkish Journal
of Computer and Mathematics Education, 1(3), 264-284.
Ernest, P. (1989). The knowledge, beliefs, and attitudes of the mathematics teacher: A model. Journal of Education for
Teaching, 15(1), 13-33. https://doi.org/10.1080/0260747890150102
Gürbüz, R., Çavuş, E. Z., & Toprak, Z. (2015). Matematik ve Teknoloji Tutum Ölçeğinin Türkçeye Uyarlanması: Lise Öğrencilerinin Matematik, Teknoloji ve Tablet Kullanımına Yönelik Tutumları. II. Türk Bilgisayar ve Matematik
Eğitimi Sempozyumu Özet Kitapçığı içinde (s. 80). Adıyaman: Adıyaman Üniversitesi.
Hair, Jr, J. F., Black, W. C., Babin, B. J., & Anderson, R. E. (2010). Multivariate data analysis (7th ed.). New Jersey: Pearson Prentice Hall.
Hambleton, R. K., & Patsula, L. (1999). Increasing the validity of adapted tests: Myths to be avoided and guidelines for improving test adaptation practices. Journal of Applied Testing Technology, 1(1), 1-30.
Hannula, M. S. (2002). Attitude towards mathematics: emotions, expectations, and values. Educational Studies in
Mathematics, 49, 25-46. https://doi.org/10.1023/A:1016048823497
Ma, X., & Kishor, N. (1997). Assessing the relationship between attitute toward mathematics and achivement in mathematics: A meta-analysis. Journal for Research in Mathematics Education, 28(1), 27-47. https://doi.org/10.2307/749662
McGuire, W. J. (1985). Attitudes and attitude change. In F. Lindzey & E. Aronson (Eds.), Handbook of social
psychology (pp. 233–346). New York, NY: Random House.
McLeod, D. (1992). Research on affect in mathematics education: A reconceptualization. In D. Grows (Ed.), Handbook
of research on mathematics teaching and learning (575–596). New York: McMillan.
Pamuk, S., Çakır, R., Ergun, M., Yılmaz, H. B., & Ayas, C. (2013). Öğretmen ve öğrenci bakış açısıyla tablet pc ve etkileşimli tahta kullanımı: Fatih projesi değerlendirmesi. Kuram ve Uygulamada Eğitim Bilimleri, 13(3), 1799-1822. https://doi.org/10.12738/estp.2013.3.1734
Pierce, R., & Stacey, K. (2004). A framework for monitoring progress and planning teaching towards the effective use of computer algebra systems. International Journal of Computers for Mathematical Learning, 9, 59–93. https://doi.org/10.1023/B:IJCO.0000038246.98119.14
Pierce, R., Stacey, K., & Barkatsas, A. N. (2007). A scale for monitoring students’ attitudes to learning mathematics with technology. Computers and Education, 48(2), 285–300. https://doi.org/10.1016/j.compedu.2005.01.006
Tabachnick, B. G., & Fidell, L. S. (1996). Using multivariate statistics. New York: Harpercollins College Publishers.
Visser, P. S., & Cooper, J. (2003). Attitude change. In Hogg, M., and Cooper, J., eds., Sage Handbook of Social
Psychology. Sage Publications.
Copyrights
Copyright for this article is retained by the author(s), with first publication rights granted to the journal.