Please cite this article as: K. Khlie, A. Abouabdellah, Identification of the Patient Requirements Using Lean Six Sigma and Data Mining, International Journal of Engineering (IJE), TRANSACTIONS B: Applications Vol. 30, No. 5, (May 2017) 691-699
International Journal of Engineering
J o u r n a l H o m e p a g e : w w w . i j e . i rIdentification of the Patient Requirements Using Lean Six Sigma and Data Mining
K. Khlie*, A. Abouabdellah
Industrial Engineering Laboratory, Modelling and Optimization of Industrial and Logistical Systems (MOSIL), ENSA, Ibn Tofail University, Kenitra, Morocco
P A P E R I N F O
Paper history:
Received 29 December 2016
Received in revised form 07 February 2017 Accepted 10 March 2017
Keywords: Lean Kano Model Data Mining Six Sigma
Define Measure Analyze Improve Control
A B S T R A C T
Lean health care is one of new managing approaches putting the patient at the core of each change. Lean construction is based on visualization for understanding and prioritizing imporvments. By using only visualization techniques, so much important information could be missed. In order to prioritize and select improvements, it’s essential to integrate new analysis tools to achieve a good understanding of what the value is for the patient, analyze their requirements/expectations/needs and prioritize them in light of strong evidences and detailed measures. In that perspective, this paper intends to integrate lean thinking, data mining and six sigma improvement process methods with the goal to develop a lean health care driving methodology. The proposed methodology allows a better understanding of the patient perception of quality based on a Kano questionnaire. Questionnaire results are then analyzed using data mining tools to extract useful information. Finally, six sigma approach is followed to improve the quality of health care services and maximize the patient satisfaction. The main outcome of the study is that the first priority concerns the availability of physicians and health products, followed by the reduction of waiting time and minimization of errors related to prescriptions and diagnostics. The use of the six sigma approach on the medication circuit allows improving those three criteria.
doi: 10.5829/idosi.ije.2017.30.05b.09
1. INTRODUCTION1
Today’s challenging health care sector requires the use of new management approaches that place the patient at the core of each change. Satisfying the patient requires a good understanding of its requirements and expectations. The principal question is about the comprehension of the manner the quality is perceived among patients. For that, we interrogate patients on the importance that they attribute to different quality features in health care. Based on Kano model, this study aims to identify the most important quality attributes and classifies them according to the patient point of view. Oriented toward maximizing patient satisfaction, the six sigma approach is used to empower and improve the perceived quality. The prioritization of attributes is essential to improve the quality of care since it helps to improve the operational performance and guides the development phase of the improvement plans and assists even decision making of health care reforms.
*Corresponding Author’s Email: [email protected] (K. Khlie)
This paper is structured as follows: the first part represents the background of our study in the health care sector. The second section shows the interest of combining the three concepts (lean, six sigma and data mining). The third part represents the integrated methodology. Results are then discussed and conclusions are drawn.
2. Background of the Study
lean methodology. Therefore, the value should be determined in a fairly high level [2]. The Kano model is one of the most powerful tools of lean that helps to identify the patient needs. It’s used to understand the relationship between quality features/attributes and patient satisfaction [3]. Research in the area of health care quality considers the patient-oriented service as a fundamental factor when establishing quality monitoring programs and sustainable strategies in health care [4]. The aim of this study is to identify the key drivers and provide guidance for enhancing quality of service using the Kano model. Previous research integrates Kano with other quality management instruments to impressive qualities of health care services as QFD (quality Function Development) [5] in order to translate results into regular services planning [6], FMEA (Failure Mode and Effects Analysis) [7], CKM (costumer knowledge management) [8]. Our paper proposes an integrated methodology gathering the Kano model and data mining techniques to a better understanding of the patient needs.
2. 2. Lean and Six Sigma Lean thinking provides a total system approach and best practices but with poor analytic tools for diagnostic and improvement structures. On the other hand, six sigma offers a structured approach for improvement and powerful measurement and analysis tools with less focus on the creation of flows. Table1 gives detailed comparisons between lean and six sigma.
The development of a new methodology integrating both lean principles and six sigma approach allows identifying the priority problem and selects the best way and tools to address it.
3. MATERIALS AND METHODS
A Kano model-based questionnaire is used in a Moroccan public hospital. A total of 53 patients were questioned.
TABLE 1. Comparison between lean and six sigma
Lean Six sigma
Goal Reduces waste Reduces variability, improves the process capability
Project selection
Based on the value stream mapping
Based on statistics and strong analysis tools
Hierarchical
level Strategic relevance Operational level
Length of projects
1 week to 3
months 3 to 6 months
Work teams Involving all stakeholders
Teams guided by black and green belts resources
Vision Systemic vison Focus on the process on hand
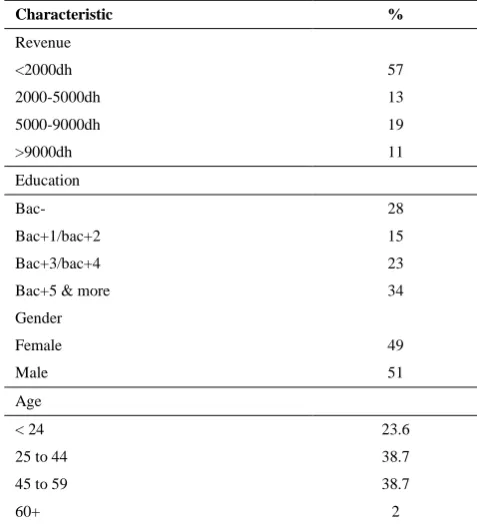
The distribution of the sample is described in Table 2. The results were analyzed using data mining techniques. Satisfaction and dissatisfaction coefficients were calculated and the impact of personal criteria (age, gender, scholar level and salary) on patient requirements was studied.
3. 1. Presentation of the Kano Model In the
past, customer satisfaction was seen as a one
dimensional construction [3]: The higher the quality of
the attribute, the higher the customer’s satisfaction and vice versa. This way of thinking changed with the introduction of Kano’s theory of attractive quality [9]: The relationship between the objective performance and customer satisfaction of a service attribute depends on how customers evaluate the service [9, 10]. This theory divides service attributes into five distinct categories: - Must be attributes (Basic): Customers take them for granted when they are fulfilled; if they are not fulfilled they may become very dissatisfied.
- One dimensional attributes (Performance): Result in customer satisfaction when fulfilled and dissatisfaction when not fulfilled.
- Attractive attributes (Excitement): Absence does not cause dissatisfaction, but achievement can lead to customer delight.
- Indifferent attributes: Absence and presence are alike and does not cause dis/satisfaction.
- Reverse attributes: Result in customer dissatisfaction when fulfilled and satisfaction when not fulfilled.
TABLE 2. Participant characteristics
Characteristic %
Revenue
<2000dh 57
2000-5000dh 13
5000-9000dh 19
>9000dh 11
Education
Bac- 28
Bac+1/bac+2 15
Bac+3/bac+4 23
Bac+5 & more 34
Gender
Female 49
Male 51
Age
< 24 23.6
25 to 44 38.7
45 to 59 38.7
The Kano model explains that the relationship between customer satisfaction and performance of a service differs between the five categories [11]. Figure 1 provides a schema synthesizing all forms of customer requirements.
3. 2. Application of the Kano Method The questionnaire aims to identify the patient perception of quality attributes. A pair of question is formulated for each quality attribute. The patient has the possibility to evaluate the question by one of the five following options: I like it that way, It must be that way, I’m neutral, I can deal with it or I dislike it that way.
A recent study in health care quality attributes divides them into seven dimensions [12]:
- Tangibility (physical facilities, equipment and appearance of personnel)
- Reliability (ability to perform the expected service dependably and accurately)
- Responsiveness (willingness to provide prompt service)
- Assurance (courtesy displayed by staff and their ability to inspire trust and confidence)
- Empathy (caring, individualized attention provided to patients by physicians and staff)
- Core medical services (the central medical aspects of the service)
-Professionalism/Competence.
The survey questionnaire we used consists of 60 questions in which 8 are open questions. Questions are integrated into four sections containing all quality dimensions mentioned above:
- Administrative services (Mode of payment, administrative procedures)
- Staff (Expertise and empathy factors)
- Physical factors (order, property, calm, availability of health products, tranquility)
- External factors (location, type of sector, prices).
Figure 1. Kano model [11]
The majority of attributes that are used for evaluating health care services concern staff.
Professional credibility, competence and
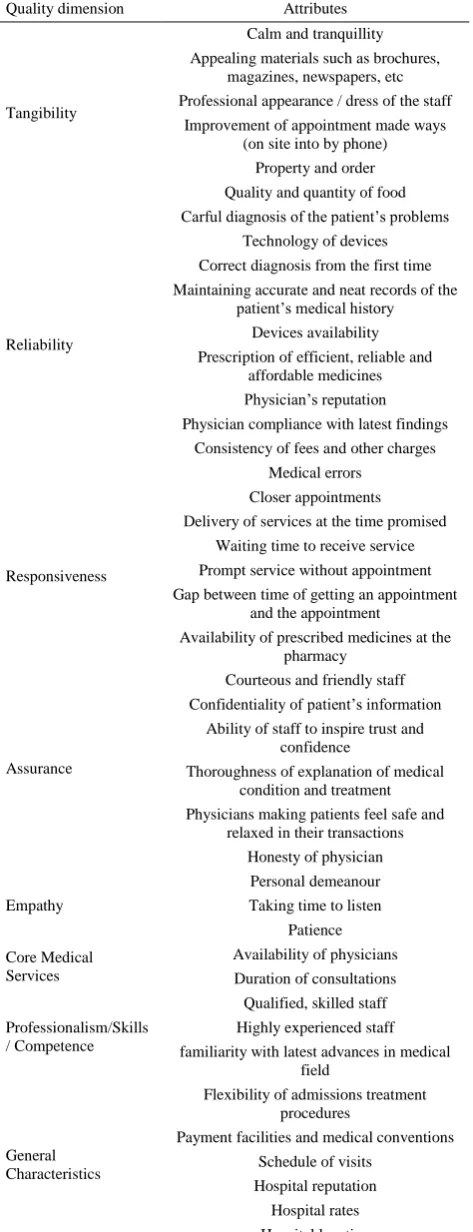
communication are significant factors for patients in the evaluation of service [13]. Physician reputation, honesty, personal attitude, courtesy of staff, careful listening of patient’s problems by the physician are also seen as important factors which can influence the patient’s perception of service quality [12]. Table 3 summarizes all quality attributes of the questionnaire for the evaluation of public health care services classified into the seven dimensions of quality [12].
3. 3. Data Mining in Health Care The health care sector generates a very huge data which still unusable. Therefore, there is a need of a powerful process to extract important information from this huge data. This process is KDD (Knowledge Discovery in Databases). Data mining is a particular step in this process that is defined as “the application of specific algorithms for extracting patterns from a set of data for prospect applications using a measure [14]. KDD is the overall process including the selection of transformation of data and also the evaluation and interpretation of data mining results. Data mining allows extracting implicit, previously unknown, and potentially useful information from data [15].
Lean is a very useful approach for processes re engineering, it allows the improvement of productivity and the efficiency of material flows within complex systems [16, 17] but it suffers from problems in data collection and poor measures of performance [10]. A good understanding of data is necessary to be able to better understand patient preferences and needs and better respond to them. In that context, clustering is used to identify clusters of patients based on their empowerment degree among cancer patients [18], or their health state among patients with ventricular arrhythmia [19].
TABLE 3. Quality dimensions and attributes of the questionnaire
Quality dimension Attributes
Tangibility
Calm and tranquillity Appealing materials such as brochures,
magazines, newspapers, etc Professional appearance / dress of the staff
Improvement of appointment made ways (on site into by phone)
Property and order Quality and quantity of food
Reliability
Carful diagnosis of the patient’s problems
Technology of devices Correct diagnosis from the first time Maintaining accurate and neat records of the
patient’s medical history Devices availability
Prescription of efficient, reliable and affordable medicines Physician’s reputation Physician compliance with latest findings
Consistency of fees and other charges
Medical errors
Responsiveness
Closer appointments Delivery of services at the time promised
Waiting time to receive service Prompt service without appointment Gap between time of getting an appointment
and the appointment
Availability of prescribed medicines at the pharmacy
Assurance
Courteous and friendly staff
Confidentiality of patient’s information Ability of staff to inspire trust and
confidence
Thoroughness of explanation of medical condition and treatment Physicians making patients feel safe and
relaxed in their transactions Honesty of physician
Empathy
Personal demeanour Taking time to listen
Patience
Core Medical Services
Availability of physicians Duration of consultations
Professionalism/Skills / Competence
Qualified, skilled staff Highly experienced staff
familiarity with latest advances in medical field
General Characteristics
Flexibility of admissions treatment procedures
Payment facilities and medical conventions Schedule of visits
Hospital reputation
Hospital rates Hospital location
By gathering lean health care principles and data mining techniques in a unique continuous improvement methodology, we're about to gather operational efficiency and well-founded managerial decisions. Our objectives are:
- Classification of features into three categories: this classification is done based on frequencies of each type of response category for all questions.
- Calculation of satisfaction and dissatisfaction coefficients: the satisfaction coefficient is calculated by adding attractive to one dimensional attributes and dividing by the total of the four categories. The dissatisfaction coefficient is calculated by adding must-be to one dimensional attributes and dividing by the total of the four categories.
4. DATA ANALYSIS
Among the answers given by patients concerning what could really make them satisfied, courteous staff is one of the most cited. Some patients express their dissatisfaction and believe that the only thing that could satisfy them in a public hospital is “leaving the hospital”. Figure 2 summarizes the perception of patients to some attributes. The most important quality attributes to patients are:
Availability: availability of physicians and health products.
Timeliness of response: patients express their desire to reduce waiting times.
Safety: minimization of errors related to prescriptions and diagnostics.
Each of these significant attributes will be discussed in what follows.
Availability:
The availability of physicians and medicines in the hospital is the first requirement of patients. They believe that the main cause of the unavailability of physicians is their unnecessary moves.
According to patients, unnecessary moves is about 56%. Availability is the reason why 55% of patients always prefer private hospitals, while 36% prefer it in some cases. For more than 21% of patients, prescribed medicines were out of stock. Medicines shortages affect health system finances by increasing the cost of delivering patient care. It also creates a high level of frustration for everyone involved, including purchasing agents, pharmacists, nurses, physicians, and patients [26].
Safety:
Patients express their dissatisfaction concerning repetitive errors made by health care professionals especially those related to the medication circuit because of their high level of criticality. In fact, prescription, dispensation and administration errors may have serious consequences such as serious injuries, disability, or death. A proper planning of medicines supply is required to minimize adverse effects on patient care and maximize its safety. According to the results of the questionnaire, 55% of patients never tolerate medical errors, and 43% tolerate them sometimes.
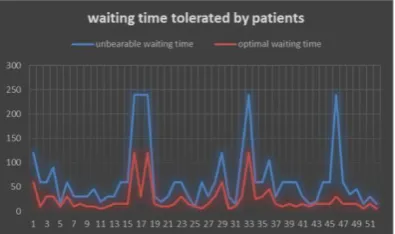
Waiting time:
Waiting time is also an important attribute for patients. The average time of waiting from which it becomes unbearable is 65 minutes. Responses are distributed between 4 hours and 15 minutes. In average, the optimal waiting time is 25 minutes. Responses are distributed between 5 minutes and 2 hours. Figure 3 summarizes the answers of patients.
According to the patients’ perception, the quality attributes chosen are classified into three categories based on their priority rate as presented in Table 4.
The priority rate is defined as the number of persons that consider it as Obligatory, Attractive or Proportional divided by the number of persons that are indifferent to its presence or consider it with an opposite counter.
Impact of personal data on the requirement degree of patients:
By clustering patient according to their degree of requirement, results show that the requirement degree is proportional to the level of studies and inversely proportional to age. Revenue and gender do not impact it.
Figure3. Optimal and unbearable waiting time
TABLE 4. Quality attributes categories
Categories Quality attributes
Very important
Elimination of medical errors
Availability of physicians
Waiting time reduction
Availability of prescribed medicines at the HP
Availability of medical equipment
Closer appointments
Less important
Property
Equipment technology
Comfort
Familiarity with latest advances
Physicians’ appearance
courtesy
Not important at all
Equipment attractiveness
Physicians’ experience
Schedule of visits
Flexibility of admissions procedures
Consultation duration
5. SIX SIGMA FOR QUALITY IMPROVEMENT
This part uses six sigma improvement process tools within the medication circuit in the hospital with the aim of reducing waiting times for both patients and physicians, increasing the availability of physicians and health products and minimizing medical errors.
Medication errors could occur during any of the four steps of the medication circuit: from prescription, dispensation, passing through administration until the follow-up and review step. The reduction of errors is the key for the patient safety and minimization of costs. For that, our study aims to reduce medical errors that occur in the medication circuit using the DMAIC methodology. It is composed of five main steps. Each letter of the acronym D.M.A.I.C represents the initial of the principal function of the correspondent step.
D. Define: this step consists of the definition of the perimeter of the problem, the expected results, the required resources and any other details.
M. Measure: in this step, data is collected, the performance and its evaluation are measured and the priorities to improve are identified.
A. Analyze: this step aims to understand the problem, use analytic and statistical tools to identify its causes.
this step. It consists of maintaining the results and ensuring continuous improvements in order to further improve and avoid backwards.
5. 1. Definition of the Perimeter of the Study
The measurement process will be limited to the medication circuit. For that, it would be useful to start with a simple modeling of this circuit. It is composed of four main steps as summarized in Figure 4.
5. 2. Measurement:
5. 2. 1. Errors Epidemiology According to a study conducted within a hospital center, potential errors of the prescription step are [27]:
Deficiencies in terms of medicinal knowledge (64%)
Lack of knowledge about the patient (15%)
Mental slip (9%)
Transcription (5%)
In what concerns the dispensation step, there are four main errors, as follows [28]:
Label errors (80%)
Inappropriate quantity (7%)
False medication (6%)
False dose (6%)
The majority of errors notifications are issued from administration step. It results essentially from two main causes [29]:
Injection of the inappropriate drug (69%)
Injection of an incorrect dose (26%).
In the last step of the medication circuit, there are three potential risks:
Lack of identification of the cause of the error resulting in a difficulty to resolve it.
Inappropriate surveillance (periodicity, material)
lack of traceability of the expected effects and medicinal errors.
Figure 4. Drugs circuit at the hospital
In order to understand the repartition of errors during the medication circuit in a hospital, patient, health care professionals including physicians, nurses and pharmacists were interviewed about the frequency of errors in each step of the circuit. Table 5 represents the results of percentages given by those stakeholders concerning errors in each step of the circuit.
5. 2. 2. Calculation of the Sigma Level In the main of correcting errors of the medication circuit and improving its capability, it’s necessary to measure the sigma level. The six sigma method uses the ratio between the number of medical errors and the number of medical errors opportunities. This ratio is defined as follows:
The ratio of Medical Errors (EM)= number of ME/ number of ME opportunities. This ratio allows the calculation of the sigma level of the medication circuit at the hospital.
The hospital in question counts about 360 medical errors per year. Based on the percentages of errors (per step of the medication circuit) given in Table 5, we count 128.41 prescription errors, 52.81 dispensation errors, 130.79 administration errors and 47.99 follow-up and review errors. Those values represent the numerators of the sigma level. For the denominators, it’s necessary to calculate the number of medical errors opportunities. In 2015, the hospital counted 16 332 hospitalized patients. The average length of stay is 13.02 days [30]. According to an investigation on the prescription and utilization of drugs in Morocco, the average number of prescribed medications per ordinance is 3.27. This number corresponds to the impression of the majority of physicians (62.9%) for whom the number of necessary medication per patient is 3 [31]. The number of prescription medical errors is calculated according to the following formula:
Number of opportunities of ME in prescription= number of potential types of errors * number of admissions* average number of orders per patient making a total of 130 656 (2*4*16 332).
For the dispensation step, the number of opportunities is the product of the average number of orders per patient, the number of potential types of errors during the dispensation and the number of admissions making a total of 130 656 (2*4*77047)
TABLE 5. Percentages of medical errors of the four steps of
the medication circuit Presc-ription
Dispen-sation
Adminis-tration
Follow-up
Patients 32 10 42 16
Health care
professionals 39 12 37 12
Managers 36 22 30 12
In the administration step, the average number of administrations per patient is 4 times per day. The number of opportunities is calculated as follows: the number of administrations per day per patient* average length of stay* number of admissions*number of potential types of administration errors making a total of 5103423.4 (4*3*13.02*16 332*2).
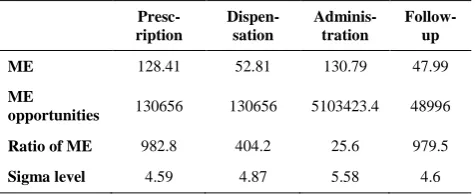
For the last step, the number of opportunities is the product of admissions* number of potential errors of the follow-up and review step making a total of 48996 (3*16 332). Table 6 summarizes the results of ME, opportunities of ME, the ratio of ME and the sigma level for each step of the medication circuit.
5. 3. Analysis Even if the administration step has the biggest number of errors, it has the best sigma level. That’s because the number of opportunities of ME in this step is very high. The sigma levels of the prescription and follow-up steps are the lowest and more efforts must be done in this area to improve them. The average sigma level of the medication circuit is 4.91. A secure medication circuit ensures that the right patient will receive the right medication at the right route with the right dose at the right moment.
In the measurement step, we identified several forms of errors that occur the most during the medication circuit. Some of the main causes of those errors are:
Lack of respect of laws and standards,
The blame culture causing significant harm on the system improvement and prevention of future errors.
Lack of resources made available to the health care professionals.
Lack of communication between the hospital entities.
Excessive confidence on health care professionals and patient’s physical state.
The following step proposes solutions to minimize ME and outlines the results of their implementation.
5. 4. Improvement and Control In the literature, several procedures and tools exist for the securement of the medication circuit. Results of research data that are specifically related to the implementation of those procedures are very satisfactory.
TABLE 6. Sigma levels for the medication circuit’s steps
Presc-ription
Dispen-sation
Adminis-tration
Follow-up
ME 128.41 52.81 130.79 47.99
ME
opportunities 130656 130656 5103423.4 48996
Ratio of ME 982.8 404.2 25.6 979.5
Sigma level 4.59 4.87 5.58 4.6
The use of barcode readers is one of the most effective methods [32]. In fact, the administration of drugs must be assisted by the reading by barcode at the patient’s bedside reduces 67% of dispensation errors, 51% of administration errors and 100% of follow-up errors. The use of lean maintenance improves the reliability of medical equipment and greatly reduces waiting times [33].
The computerization of prescriptions reduces 55% of prescriptions errors. The labeling of preparations is also considered as one of the most important tools to minimize prescription administration errors especially those due to the preparation of doses to administrate. The standardization of labeling and preparation of medication allows avoiding several types of preparation errors. It’s also advised to involve effectively the patient into the improvement approach in order to increase its security and improve its satisfaction. Placing pharmacists into health care services is also considered as an important initiative to take in order to minimize prescription errors.
By the introduction of computerized prescriptions and barcodes readers, the sigma level will be vastly improved. Table 7 summarizes the new sigma levels after the implementation of computerized prescriptions and barcodes readers.
The new average sigma level of the medication circuit is 5.475. That results are an increase of 0.565. The new sigma level corresponds to 40 ME per million. Compared to 386 medical errors per million (sigma level=4.91), those improvements will allow a reduction of 346 medical errors per million.
6. CONCLUSION
Lean health care is a fundamental approach to minimize non added value activities. It’s important to patients only if it’s based on a well-founded study of their requirements and priorities. Data mining techniques are very useful in questionnaire results analysis. It allows us understand what patients need from public hospitals and how they perceive health care quality attributes.
Lean efforts must be focused on the very important category of quality attributes to meet patient requirements. Among the most important ones are the safety of the patient, the availability of physicians and medicines and finally the reduction of waiting times.
TABLE 7. Sigma levels after the improvements
Presc-ription
Dispen-sation
Adminis-tration
Follow-up
Ratio of ME 442.3 133.4 12.54 0
The introduction of six sigma will bring more precise and very detailed measurements. Relying on the patient requirements -identified using the integration of lean and data mining- the six sigma allows a better understanding of the problems and barriers preventing from the achievement of the required quality, their causes and effects and it could be used as a basis and guide of the lean health care improvements.
The perspective of this work deals with the integration of more actors of the hospital system as the physicians, pharmacists, nurses and managers in the identification of the quality attributes in order to obtain an integrated model of quality that satisfy all the main stakeholders of the hospital.
7. REFERENCES
1. Khaoula, K. and Abdellah, A., "A methodology of lean implementation in hospitals", International Journal of Applied Engineering and Research, Vol. 10, No. 19, (2015), 40461-40467.
2. Poppendieck, M., "Principles of lean thinking", IT Management Select, Vol. 18, No., (2011), 1-7.
3. Sauerwein, E., Bailom, F., Matzler, K. and Hinterhuber, H.H., "The kano model: How to delight your customers", in International Working Seminar on Production Economics, Innsbruck. Vol. 1, (1996), 313-327.
4. Cheraghi-Sohi, S., Hole, A.R., Mead, N., McDonald, R., Whalley, D., Bower, P. and Roland, M., "What patients want from primary care consultations: A discrete choice experiment to identify patients’ priorities", The Annals of Family Medicine, Vol. 6, No. 2, (2008), 107-115.
5. Matzler, K. and Hinterhuber, H.H., "How to make product development projects more successful by integrating kano's model of customer satisfaction into quality function deployment", Technovation, Vol. 18, No. 1, (1998), 25-38.
6. Tontini, G., "Integrating the kano model and qfd for designing new products", Total Quality Management, Vol. 18, No. 6, (2007), 599-612.
7. Shahin, A., "Integration of fmea and the kano model: An exploratory examination", International Journal of Quality & Reliability Management, Vol. 21, No. 7, (2004), 731-746. 8. Chen, Y.-H. and Su, C.-T., "A kano-ckm model for customer
knowledge discovery", Total Quality Management & Business Excellence, Vol. 17, No. 5, (2006), 589-608.
9. Kano, N., "Attractive quality and must-be quality", Hinshitsu (Quality, The Journal of Japanese Society for Quality Control), Vol. 14, No., (1984), 39-48.
10. Kano, N., "Life cycle and creation of attractive quality", in The 4th QMOD Conference, Linkoeping, Sweden, (2001).
11. Tsiotsou, R.H., Ratten, V., Högström, C., Rosner, M. and Gustafsson, A., "How to create attractive and unique customer experiences: An application of kano's theory of attractive quality to recreational tourism", Marketing Intelligence & Planning, Vol. 28, No. 4, (2010), 385-402.
12. Ramsaran-Fowdar, R.R., "Identifying health care quality attributes", Journal of Health and Human Services Administration, (2005), 428-443.
13. Brown, S.W. and Swartz, T.A., "A gap analysis of professional service quality", The Journal of Marketing, (1989), 92-98.
14. Darvishi, A. and Hassanpour, H., "A geometric view of similarity measures in data mining", International Journal of Engineering-Transactions C: Aspects, Vol. 28, No. 12, (2015), 1728.
15. Witten, I.H., Frank, E., Hall, M.A. and Pal, C.J., "Data mining: Practical machine learning tools and techniques, Morgan Kaufmann, (2016).
16. Khlie, K. and Abouabdellah, A., "A study on the performance of the pharmacy information system within the moroccan hospital sector", in Logistics Operations Management (GOL), 2016 3rd International Conference on, IEEE., (2016), 1-7.
17. Khlie, K., Serrou, D. and Abouabdellah, A., "The impact of lean-logistics and the information system on the information flow management within the healthcare supply chain", in Intelligent Systems: Theories and Applications (SITA), 2016 11th International Conference on, IEEE., (2016), 1-5.
18. Abouabdellah, A. and Cherkaoui, A., "Decision support system for predicting the degree of a cancer patient's empowerment", Journal of Theoretical & Applied Information Technology, Vol. 60, No. 3, (2014).
19. Lin, A., Lenert, L.A., Hlatky, M.A., McDonald, K.M., Olshen, R.A. and Hornberger, J., "Clustering and the design of preference-assessment surveys in healthcare", Health Services Research, Vol. 34, No. 5 Pt 1, (1999), 1033-1040.
20. Wallstrom, G.L. and Hogan, W.R., "Unsupervised clustering of over-the-counter healthcare products into product categories", Journal of Biomedical Informatics, Vol. 40, No. 6, (2007), 642-648.
21. Jacques, J., Delerue, D., Jourdan, L. and Dhaenens, C., "Extension des criteres d’inclusions dans les essais cliniques a l’aide de methodes d’optimisation", in ROADEF 2011: 12e congres annuel de la Societe française de Recherche Operationnelle et d'Aide a la Decision., (2011).
22. Hamidi, H. and Daraei, A., "Analysis of pre-processing and post-processing methods and using data mining to diagnose heart diseases", International Journal of Engineering-Transactions A: Basics, Vol. 29, No. 7, (2016), 921-930. 23. Shaeiri, Z. and Ghaderi, R., "Modification of the fast global
k-means using a fuzzy relation with application in microarray data analysis", International Journal of Engineering-Transactions C: Aspects, Vol. 25, No. 4, (2012), 283-290.
24. Milne, R., Drummond, M. and Renoux, P., "Predicting paper making defects on-line using data mining", Knowledge-Based Systems, Vol. 11, No. 5, (1998), 331-338.
25. Baek, J.-G., Kim, C.-O. and Kim, S.S., "Online learning of the cause-and-effect knowledge of a manufacturing process", International Journal of Production Research, Vol. 40, No. 14, (2002), 3275-3290.
26. Cohen, M., "Institute of safe medication practices", Medication Safety Alert [newsletter], Vol. 21, (2002).
27. Bobb, A., Gleason, K., Husch, M., Feinglass, J., Yarnold, P.R. and Noskin, G.A., "The epidemiology of prescribing errors: The potential impact of computerized prescriber order entry", Archives of Internal Medicine, Vol. 164, No. 7, (2004), 785-792.
28. Flynn, E.A., Barker, K.N., Gibson, J.T., Pearson, R.E., Berger, B.A. and Smith, L.A., "Impact of interruptions and distractions on dispensing errors in an ambulatory care pharmacy", American Journal of Health System Pharmacy, Vol. 56, (1999), 1319-1325.
29. Rivière, A. and Piriou, V., "Erreurs d’administration des médicaments: A-t-on progressé?", Le Praticien en Anesthésie Réanimation, Vol. 17, No. 1, (2013), 58-65.
31. Simon, N., Hakkou, F., Minani, M., Jasson, M. and Diquet, B., "Drug prescription and utilization in morocco", Therapie, Vol. 53, No. 2, (1997), 113-120.
32. Poon, E.G., Keohane, C.A., Yoon, C.S., Ditmore, M., Bane, A., Levtzion-Korach, O., Moniz, T., Rothschild, J.M., Kachalia, A.B. and Hayes, J., "Effect of bar-code technology on the safety
of medication administration", New England Journal of Medicine, Vol. 362, No. 18, (2010), 1698-1707.
33. Serrou, D., Khlie, K. and Abouabdellah, A., "Improvement of the lean-maintenance by hospital logistics", in Information Science and Technology (CiSt), 4th IEEE International Colloquium on, IEEE., (2016), 19-24.
Identification of the Patient Requirements Using Lean Six Sigma and Data Mining
K. Khlie, A. Abouabdellah
Industrial Engineering Laboratory, Modelling and Optimization of Industrial and Logistical Systems (MOSIL), ENSA, Ibn Tofail University, Kenitra, Morocco
P A P E R I N F O
Paper history:
Received 29 December 2016
Received in revised form 07 February 2017 Accepted 10 March 2017
Keywords: Lean Kano Model Data Mining Six Sigma
Define Measure Analyze Improve Control
ديكچ ه تبقارم اه ی تشادهب ی بان یکی ور زا یاهدرکی دم تیری دج دی هک تسا ب رامی ار غت ره هتسه رد ریی رارق یم دهد تخاس . و زاس بان رب ساسا مسجت یرصب ارب ی و کرد دوبهب ولوا تی اه تسا هدش هداهن انب نکت زا هدافتسا اب .
کی اه ی مسجت هب اهنت یی سب مهم تاعلاطا ، یرای
م ی ر تسد زا دناوت دو
ولوا روظنم هب . تی دنب ی باختنا و اهدوبهب ، تسا مزلا رازبا یاه زجت هی لحت و لی دج دی ماغدا رامیب یارب هک هچنآ زا یبوخ کرد هب ات دنوش نا
،دیسر تسا شزرااب ن
اهیدنمزای /تاراظتنا / تابلاطم
و درک زیلانآ ار اهنآ وق دهاوش وترپ رد
ی و قد تامادقا ار اهنآ قی ولوا تی دنب ی .درک ا رد نی د ،هاگدی ا نی هب دراد رظن رد هلاقم
ماغدا هداد ،بان رکفت واک
ی ارف شور و دنی س شش دوبهب امگی
هعسوت فده اب کی
تشادهب تبقارم شور ی بان دزادرپب . پ شور یداهنشی م هزاجا ی رتهب کرد ات دهد ی زا یهاگآ ب رامی ک زا تیفی ساسا رب کی وناک همانشسرپ میشاب هتشاد اتن . جی همانشسرپ هداد رازبا زا هدافتسا اب نآ زا سپ اه ک
یوا یم لیلحت و هیزجت ات دوش
فم تاعلاطا دی جارختسا دوش اهن رد . ،تی
ور درکی س شش امگی ک دوبهب لابند هب تیفی تبقارم تامدخ اه ی تشادهب ی اضر ندناسر رثکادح هب و تی ب رامی تن .تسا هجی لصا ی پ ا شهوژ نی ولوا هک تسا تی
ندوب سرتسد رد هب طوبرم لوا پ
تلاوصحم و ناکشز ،هدوب یتشادهب
نآ لابند هب
اهاطخ ندناسر لقادح هب و نامز شهاک ی
خشت و هخسن هب طوبرم صی
دنتسه ور زا هدافتسا . درکی س شش امگی رد لکیس ینامرد م هزاجا ی ا ات دهد نی عم هس رای دوبهب .دنبای
![Figure 1. Kano model [11]](https://thumb-us.123doks.com/thumbv2/123dok_us/208865.2015250/3.595.62.290.555.722/figure-kano-model.webp)