DOI: 10.9781/ijimai.2017.441 Abstract — Oceanic and coastal radars operation is affected
because the targets information is received mixed with and undesired contribution called sea clutter. Specifically, the popular CA-CFAR processor is incapable of maintaining its design false alarm probability when facing clutter with statistical variations. In opposition to the classic alternative suggesting the use of a fixed adjustment factor, the authors propose a modification of the CA-CFAR scheme where the factor is constantly corrected according on the background signal statistical changes. Mathematically translated as a variation in the shape parameter of the clutter distribution, the background signal changes were simulated through the Weibull, Log-Normal and K distributions, deriving expressions which allow choosing an appropriate factor for each possible statistical state. The investigation contributes to the improvement of radar detection by suggesting the application of an adaptive scheme which assumes the clutter shape parameter is known a priori. The offered mathematical expressions are valid for three false alarm probabilities and several windows sizes, covering also a wide range of clutter conditions.
Keywords — Radar Clutter, CFAR, False Alarm Probability, Radar Detectors Performance.
I. I
ntroductIonA
radar is a device that emits electromagnetic waves and receives the echo resulting from their interaction with nearby objects [1]. The echoes received from targets of interest are interpreted as useful signal, while those originated from the reflection of the emission on other entities are considered as a distortion and called clutter [2].When operating in coastal and offshore environments, the distortion signal often comes from the sea surface and is thereby called sea clutter. Given the variability of the sea surface, and the influence of others factors, the sea clutter usually introduces an important interference in the detection [3].
The Weibull [4, 5], Log-Normal [6, 7] and K [8-10] distributions are commonly used for sea clutter modeling. They display heavy tails for certain configurations of their respective parameters, according to that observed in radar readings.
CFAR (Constant False Alarm Rate) processors are widely applied for eliminating the effects of the clutter, being the CA-CFAR (Cell Averaging-CFAR) the classical alternative [11]. This scheme constantly moves a reference window across the coverage area for calculating the average of a small region. Then, it decides if the cell at the center of the window is a target by comparing its magnitude with a threshold calculated from the estimated average [12].
When the CA-CFAR mistakenly classifies a cell with clutter as a target, it is said that a false alarm has occurred. Indeed, the false alarm probability ( ) is one of the fundamental parameters of a radar detector
[13]. Therefore, the CA-CFAR includes an adjustment factor ( ) that allows establishing the false alarm probability at a predefined level.
In the traditional operation mode, the adjustment factor is kept constant the entire operation period [14]. This approach provides good results under the assumption that the clutter statistics will remain unaffected. However, when variations occur in the statistics, it becomes necessary to correct the adjustment factor as it was demonstrated in [15]. Otherwise, the operational false alarm probability will deviate from the intended design value.
As a solution to this problem, the authors of the current paper obtained mathematical expressions that allow making the necessary correction in the adjustment factor for a wide range of shape parameters for the Weibull, Log-Normal and K distributions. The results were obtained after processing several millions samples and performing curve fitting procedures. The offered expressions are valid for the false alarm probabilities of , and and provide an estimation of the factor regardless of the CA-CFAR sliding window size. The shape parameter of the statistical distributions was assumed to be known in advance, which is acceptable given the accurate methods proposed in [16-18].
The found expressions provide a new alternative for solving a problem ignored by most common CFAR implementations that usually concentrate on modifying the method for estimating the background average [19-22]. This paper focuses on canceling the effect of the clutter slow statistical variations instead of developing techniques for processing non-homogeneities.
The classical solution for this problem was described in [23] and it proposes the use of an empiric formula based on environmental conditions. However, the drawbacks of this approach were pointed out also in [23], where it was explained that the progress is yet reduced because the formulas does not take into account the wind speed and the sea state, two conditions of proven influence on the features of the measurements. The approximation followed in the current paper ignores the complexity introduced by the environmental variables and focuses on the processing of the received samples as a direct approach to the correction of the adjustment factor.
The paper proceeds as follows. The second section, called “Materials and Methods” presents the Probability Density Functions (PDF) of the Weibull, Log-Normal and K models. In the same section, the executed algorithm is described. Subsequently, the results are presented and commented in “Results and Discussion”, including the found mathematical expressions from the curve and surface fittings which generalize the obtained outcomes. Finally, in “Conclusions and Future Research” the main contributions of the study are summarized and recommendations are given for ways to continue the investigation.
II. M
AterIAlsAndM
ethodsThe probability density functions employed in this project are the Weibull (1), the Log-Normal (2) and the K (3). All of them have
CA-CFAR Adjustment Factor Correction with a priori
Knowledge of the Clutter Distribution Shape Parameter
José Raúl Machado Fernández, Shirley Torres Martínez, Jesús de la Concepción Bacallao Vidal
extensive validation and were categorized as classical distributions in [24].
The K distribution is the more widely accepted model for high resolution sea clutter observed at low grazing angles [23]. The Weibull distribution is a very versatile model that has been applied to ground [25], weather [7] and ice clutter [26]; in addition, in [4] it was selected as the best model fitting sea clutter data. Lastly, the Log-Normal distribution tends to fit data for particular situations such as samples corresponding to HH polarization [27], in the assessment of the clutter spatial distribution [28], and for cells containing mixed target and clutter reflections [4, 7].
(1)
(2)
(3)
In expression (1), is the Weibull PDF whereas and are scale and shape parameters respectively. Together, in (2) and (3) and are the Log-Normal and K PDFs, whereas are the scale parameters and are the shape parameters. In all cases, the was utilized as the independent variable. Auxiliary expressions such as the CDF (Cumulative Distribution Function) and the moment generating function can be found in [29-32].
A. Description of the Experiments
The basic experiment was carried out to simulate the response of a CA-CFAR to one million independent sliding windows filled with clutter samples. The total number of involved samples depended on the window size; for example, when a 64 reference cells window was simulated, there were 65 samples in each essay, which made a total of 65 million samples for the whole experiment.
In the first iteration, a small adjustment factor such as
was chosen. This value provoked the occurrence of many false alarms, that is, a high number of clutter samples were misclassified as targets. Then, the procedure was repeated increasing the in each new iteration until the factor that produced a was found with less than a deviation. The same process led to the finding of the factors that
guaranteed the occurrence of and .
The three values extracted from the above algorithm are only valid for the distribution obeyed by the processed samples. Therefore, if the first sequence corresponded to the Weibull model, then the steps had to be repeated for the Log-Normal and K as well.
In addition, three factors are not enough for each distribution because they only represent the CA-CFAR response to a given shape parameter. The authors chose 19 different parameters from the Weibull, Log-Normal and K distributions and re-executed the procedure with each one. The shape parameters were taken from intervals validated in several studies. For the Weibull case, it was used:
[4, 33, 34]; for the Log-Normal case: [7, 25, 27, 35], and for the K distribution: [34-36]. The reader should note that the scale parameter has no influence in the detection mechanism [15].
Although it includes the handling of a large number of samples,
the previously described algorithm is not yet complete. It needs to be repeated for different sliding window dimensions. The authors initially used a size of 64 cells and then recalculated the s for 32, 16 and 8 cells in the sliding window.
Once completed, the experiments yielded 228 values per distribution, for a total of 684 figures. These numbers can be placed on a table for searching according to the specifications of a given design. However, to facilitate the implementation of the results, the authors performed a curve fitting procedure that allowed synthesizing the findings into three mathematical expressions per distribution. Each expression belongs to one of the three addressed false alarm probabilities and allows the direct entry of the window size and the shape parameter, returning the value to be applied.
III. r
esultsAndd
IscussIonThe current section presents the results of the experiments. It begins by describing the influence of each simulation variable on the CA-CFAR adjustment factor. Subsequently, the curve and surface fittings that enabled the generation of the mathematical expressions are discussed. The section concludes by characterizing the deviations introduced by the expressions, and by discussing the application of the paper.
A.
Influence of the variables on the CA-CFAR factor
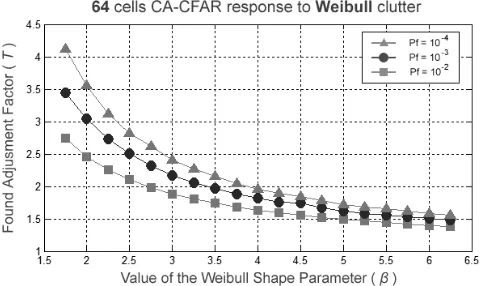
Fig. 1 plots the adjustment factors estimated for guaranteeing the
false alarm probabilities of , and
for 19 different occurrences of the Weibull shape parameter. The information corresponds to that observed for a 64 cells CA-CFAR.
Fig. 1. Adjustment factors found by processing Weibull clutter with a 64 cells CA-CFAR.
As it can be seen, the reduction of the false alarm probability causes the adjustment factor to rise. This represents a logical behavior according on the effect of on the detection threshold. A high factor causes the subsequent elevation of the threshold which provokes the occurrence of fewer false alarms, since it is less likely that a sample will exceed the defined level.
The effect of the variation of over is also visible in Fig. 1. The Weibull distribution exhibits heavier tails for the lower figures of the shape parameter, forcing the increase of the adjustment factor. It can be also noted that as the shape parameter increases, it losses influence on the selection of , that is, there is little difference between consecutive
values for .
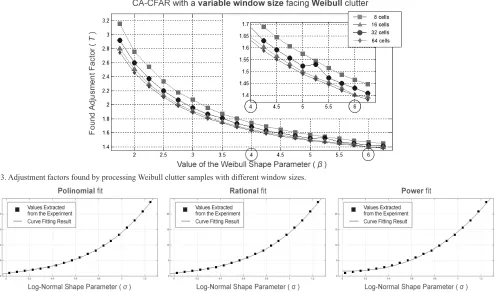
of the shape parameter over is even higher for the K distribution. The opposite happens in the Log-Normal case (Fig. 2 right) where the increase between consecutive values is remarkable for the higher s.
Fig. 2 plots the performed estimates for a 32 cells processor and variations of the K and Log-Normal shape parameters. Note that what was observed in Fig. 1 regarding the relationship between the false alarm probability and also applies to these charts.
Moreover, Fig. 3 displays the effect of modifying the size of the sliding window on the adjustment factor selection. The reader may notice that the graph placed in the upper right corner is a zoomed view
of the behavior in the region.
After processing Weibull samples with CA-CFAR schemes whose windows sizes were changed, the need to increase with the decrease of the number of cells in the window became obvious (see Fig. 3). A system with fewer cells for computing the background mean will produce less accurate threshold estimations. Accordingly, the processor
will require a higher adjustment factor to maintain its design . Here ends the description of the influence of the different simulation variables on the outcomes. The behavior described for the presented examples generalizes that observed in all trials.
B.
Curve and surface fittings
In order to concentrate the information gathered in all the experiments, curve and surface fittings were conducted. Fig. 4 shows some of the curve fits made for the factors obtained from Log-Normal distributed samples.
The following fits were tested for each distribution: polynomial from first to eighth order; rational from first to fifth order both in the numerator and in the denominator; and power fits. It was found that the rational fit provided the best results, accurately matching the shape parameters relation with increase. Weibull and K distributions were fitted with a second degree polynomial in the numerator and a Fig. 2. Adjustment factors extracted from the response of a 32 cells CA-CFAR to K and Log-Normal clutter.
Fig. 3. Adjustment factors found by processing Weibull clutter samples with different window sizes.
first degree in the denominator. On the other hand, the Log-Normal distribution was fitted with a first degree polynomial in the numerator and a second degree in the denominator.
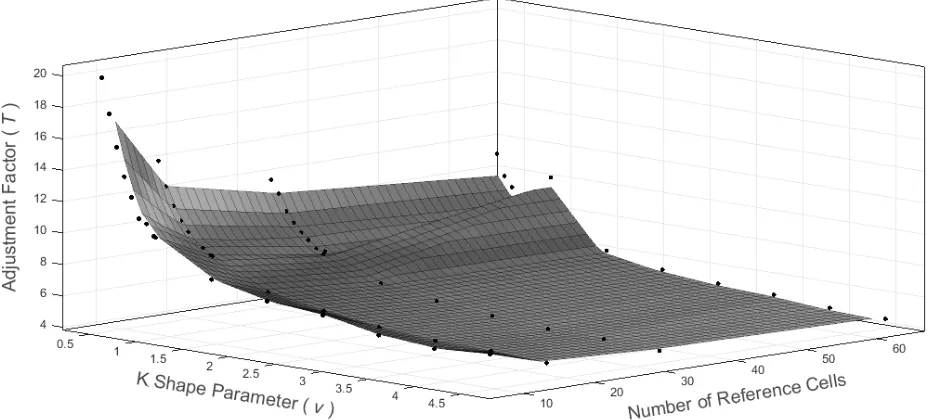
After completing the curve fittings, the authors proceeded to execute surface fittings which included the influence of the window size on the selection of the value. A representation of the problem at hand is offered in Fig. 5 where a three-dimensional surface relating with the shape parameter of the K distribution and the number of cells is presented. Expressions obtained from the surface fitting are given in Table 1 that includes nine formulas for different false alarm probabilities and distributions, together with their respective values of RMSE (Root Mean Squared Error). As it can be seen, an exponential term that takes into account the contribution of the number of cells in the window was added in all cases.
C.
Evaluating the quality of the fit
The quality of the fit was measured by generating new independent sample sets with a similar structure to those employed in the initial simulations. Then, the sets were processed using the values extracted from the formulae provided in Table I. The measured values that were extracted from these experiments proved that the expressions guarantee an average deviation of a 32,3% for the Weibull distribution, of a 30,4% for the Log-Normal case and of a 37,66% for the K model.
The same experiment was reproduced using expressions obtained from the curve fittings instead of those from the surface fittings. The average deviation reduced to a 12,1% for the Weibull distribution, a 17,4% for the Log-Normal and a 15,85% for the K distribution when applying formulae from Tables II, III and IV. This indicated that the surface fit was unable to correctly adapt to the data at hand without losing precision. The drawback of using the curve fit is that it produces 36 expressions instead of the 9 displayed in Table 1.
Then, a selection have to be made according on the characteristics of the implementation at hand. If a fixed window size is used in the receiver, then a curve fit expression can be used for an improved precision. On the other hand, if the window size is not known in advance, or if it may vary given certain situations, a surface fitting expression will provide a good overall performance. Besides, expressions from
Table I also allow estimating the values for window sizes different from 64, 32, 16 and 8.
tAble I. expressIonsobtAInedfroMthecurvefIttIngsforestIMAtIng usIng theshApepArAMeterfroMthe WeIbull, log-norMAlAnd K dIstrIbutIonsAnd
theWIndoWsIze .
Expressions found through the curve fitting procedure RMSE K Distribution
-
-1,36
6,641
12,67
Log-Normal Distribution
-
-0,4308
1,564
3,435
Weibull Distribution
-
-0,04264
0,1898
0,1581
tAble II. expressIonsobtAInedfroMthecurvefIttIngsforestIMAtIng usIng theshApepArAMeterfroMthe K dIstrIbutIonAndtheWIndoWsIze .
Expressions found through the curve fitting procedure (A; B; C; D)
tAble III. expressIonsobtAInedfroMthecurvefIttIngsforestIMAtIng usIngtheshApepArAMeterfroMthe log-norMAldIstrIbutIonAndthe
WIndoWsIze .
Expressions found through the curve fitting procedure (A; B; C; D)
tAble Iv. expressIonsobtAInedfroMthecurvefIttIngsforestIMAtIng usIngtheshApepArAMeterfroMthe WeIbulldIstrIbutIonAndtheWIndoW
sIze .
Expressions found through the curve fitting procedure (A; B; C; D)
D. Application and assessment of the results
The current research led to the creation of nine mathematical expressions that allow selecting optimal CA-CFAR adjustment factors for maintaining the false alarm probabilities of , and for any window size between 8 and 64. The offered formulae take into account the contribution of the shape parameter of the Weibull, Log-Normal and K distributions on the selection of the CA-CFAR factor, as well as the influence of the window size of the processor itself.
The research assumed the shape parameter was known a priori for all distributions. Its main application is in the improvement of the NATE-CFAR detector presented in [17, 37]. This detector uses an enhanced neuronal parameter estimation technique to obtain a statistical characterization of clutter related distributions such as the Weibull [16], K [18] and Pareto [38]. The current contribution allows the expansion of the NATE method to a CA-CFAR with different numbers of cells in the sliding window; the previous NATE implementation was only suitable for 64 cells. Moreover, this research is particularly useful in the adaptation to statistical clutter changes of CFAR mechanisms that modify the size of the window such as the CI-CFAR [39] or TL-CFAR [40].
Iv. c
onclusIonsAndf
uturer
eseArchAfter processing several million computer-generated samples corresponding to Weibull, Log-Normal and K distributions, the authors were able to create mathematical expressions relating the shape parameter of each distribution with the CA-CFAR adjustment factor for several sliding window sizes. By using the values extracted from the expressions for correcting the adjustment factor, a cell averaging processor can guarantee its false alarm probability will only deviate a 33,45% from the value conceived in the design even when the clutter exhibits statistical variations and the size of the sliding window varies from 8 to 64 cells. The system requires a priori knowledge of the shape parameter of the clutter distribution; therefore the formulae are to be used together with other previously presented mechanisms that include the estimation of the parameters.
The authors will focus next on searching a method for generalizing the results for false alarm probabilities lower than . The reproduction of the study for the popular OS-CFAR processor is also a future goal.
r
eferences[1] W. L. Melvin and J. A. Scheer, Principles of Modern Radar, Vol III Radar
Applications: Scitech Publishing, 2014.
[2] H. Meikle, Modern Radar Systems, 2nd Edition: Artech House 2008. [3] T. Oluwale Oyedokun, “Sea Clutter Simulation”, Master of Science in
Engineering, Department of Electrical Engineering, University of Cape Town, 2012.
[4] S. Ishii, S. Sayama, and K. Mizutani, “Effect of Changes in Sea-Surface State on Statistical Characteristics of Sea Clutter with X-band Radar”,
Wireless Engineering and Technology, 2(3), pp. 175-183, 2011.
[5] Y. Dong, “Distribution of X-Band High Resolution and High Grazing Angle Sea Clutter”, Technical Report DSTO-RR-0316, Electronic Warfare and Radar Division, Defence Science and Technology Organization, Edinburgh, South Australia, 2006.
[6] J. Z. Yim, C.-R. Chou, and W.-K. Wong, “A Study of the Statistics of Sea Clutter in the Northern Coast of Taiwan”, in Proceedings of the
Seventeenth International Offshore and Polar Engineering Conference,
Lisbon, Portugal, pp. 1-6, 2007.
[7] S. Sayama and S. Ishii, “Suppression of Log-Normal Distributed Weather Clutter Observed by an S-Band Radar”, Wireless Engineering and
Technology, 4(3), pp. 125-133, 2013.
[8] Z. Zhijian, X. Ruilai, H. Yong, and G. Jian, “New Nonparametric Detectors under K-Distributed Sea Clutter in Radar Applications”, in
IEEE 2011 CIE International Conference on Radar, pp. 1752-1755, 2011.
[9] X. Meng, G. Feng, H. Xue, and Z. He, “Wideband Radar Target Detection Theory in Coherent K Distributed Clutter”, Research Journal of Applied
Sciences, Engineering and Technology, 5(5), pp. 1528-1532, 2013.
[10] G. Tanriverdi, “Arma Model Based Clutter Estimation and its Effect on Clutter Supression Algorithms”, Master of Science in Electrical and Electronics Engineering, The graduate School of Natural and Applied Sciences, 2012.
[11] J. C. Bacallao Vidal, “Un modelo Teórico de la Técnica DRACEC. Metodología del Proceso de Adaptación al Fondo”, Doctor en Ciencias Técnicas, Instituto Técnico Militar “José Martí”, La Habana, Cuba, 2003. [12] J. R. Machado Fernández and R. C. Sánchez Rams, “Implementación
de un Detector de Promediación de Clutter (CA-CFAR) usando VHDL (accepted)”, Telem@tica, 2016.
[13] M. A. Richards, J. A. Scheer, and W. A. Holm, Principles of Modern
Radar Vol I Basic Principles: Scitech Publishing, 2010.
[14] R. C. Sánchez Rams, “Implementación del detector CA-CFAR en VHDL para crear un PC-Radar Cubano usando FPGA”, Ing. en Telecomunicaciones y Electrónica, Departamento de Telecomunicaciones y Telemática, Facultad de Ingeniería Eléctrica, Instituto Superior Politécnico José Antonio Echeverría (ISPJAE), La Habana, Cuba, 2014. [15] J. R. Machado Fernández and J. C. Bacallao Vidal, “MATE-CFAR:
Ambiente de Pruebas para Detectores CFAR en MATLAB”, Telem@tica,
13(3), pp. 86-98, 2014.
[16] J. R. Machado Fernández, J. C. Bacallao Vidal, and N. Chávez Ferry, “A Neural Network Approach to Weibull Distributed Sea Clutter Parameter’s Estimation”, Inteligencia Artificial, 18(56), pp. 3-13, 2015.
[17] J. R. Machado Fernández and J. C. Bacallao Vidal, “Log-Normal clutter- Method of Moments - Cell Averaging - Constant False Alarm Rate (LN-MoM-CA-CFAR) Detector (bajo revisión)”, Ingeniería e Investigación,
Colombia, 2016.
[18] J. R. Machado Fernández and J. C. Bacallao Vidal, “Improved Shape Parameter Estimation in K Clutter with Neural Networks and Deep Learning”, International Journal of Interactive Multimedia and Artificial
Intelligence, 3(7), pp. 96-103, 2016.
[19] D. Ivkovic, M. Andric, and B. zrnic, “False Alarm Analysis of the CATM-CFAR in Presence of Clutter Edge”, International Journal of Engineering
and Innovative Technology (IJEIT), 23(1), pp. 66-72, 2014.
[20] D. S. Ranjan and H. K. Moorthy, “Development of Adaptive Algorithm for CFAR in non-homogenous environment”, International Journal of
Engineering and Innovative Technology (IJEIT), 3(1), 2013.
[21] W. K. Abd-Ali and N. Abd-Ullah, “Evaluation of AND-CFAR and OR-CFAR Processors under Different Clutter Models”, Eng. & Tech. Journal,
31(5), pp. 964-975, 2013.
[22] J.-W. Shin, Y.-K. Seo, D.-W. Do, S.-M. Choi, and H.-N. Kim, “Modified Variability-Index CFAR Detection Robust to Heterogeneous Environment”, presented at the International Conference on Systems and Electronic Engineering, Phuket (Thailand), 2012.
[23] K. Ward, R. Tough, and S. Watts, Sea Clutter Scattering, the K Distribution
and Radar Performance, 2nd Edition, London, United Kingdom: The
Institution of Engineering and Technology, 2013.
[24] J. R. Machado Fernández and A. Bueno González, “Clasificación del Clutter Marino utilizando Redes Neuronales Artificiales”, Grupo de Radares, Departamento de Telecomunicaciones y Telemática, Instituto Superior Politécnico José Antonio Echeverría (ISPJAE), Habana, Cuba, 2012.
[25] S. Sayama and M. Sekine, “Weibull, Log-Weibull and K-Distributed Ground Clutter Modelling Analyzed by AIC”, IEEE Transactions on
Aerospace and Electronic Systems, 37(3), 2001.
[26] R. Vicen Bueno, M. Rosa Zurera, M. P. Jarabo Amores, and D. de la Mata Moya, “Coherent Detection of Swerling 0 Targets in Sea-Ice Weibull-Distributed Clutter Using Neural Networks”, IEEE Transactions on
Instrumentation and Measurement, 59(12), 2010.
[27] A. Farina, F. Gini, M. V. Greco, and L. Verrazzani, “High Resolution Sea Clutter Data: Statistical Analysis of Recorded Live Data”, IEE
Proceedings on Radar, Sonar and Navigation, 144(3), pp. 121-130, 1997.
[28] Y. Dong, “Clutter Spatial Distribution and New Approaches of Parameter Estimation for Weibull and K-Distributions”, DSTO-RR-0274, DSTO Systems Sciences Labpratory, Edingburgh South Asutralia, 2004. [29] A. N. O’Connor, Probability Distributions Used in Reliability
Engineering: University of Maryland, 2011.
[30] M. P. McLaughlin, Compendium of Common Probability Distributions, 2014.
[31] J. R. Machado Fernández and J. C. Bacallao Vidal, “Modelación de la Distribución K en MATLAB para Aplicaciones de Radar (aceptado para publicación)”, Revista de Ingeniería Electrónica, Automática y
Comunicaciones (RIELAC), 2016.
[32] J. R. Machado Fernández, “Modelación de las Distribuciones Weibull y Log-Normal para Aplicaciones de Radar (aceptado para publicación)”,
Ciencias Holguín, 2016.
[33] S. Sayama and S. Ishii, “Amplitude Statistics of Sea Clutter by MDL Principle”, IEEJ Transactions Fundamentals and Materials, 132(10), pp. 886-892, 2011.
[34] I. Antipov, “Statistical Analysis of Northern Australian Coastline Sea Clutter Data”, Surveillance Systems Division, Electronics and Surveillance Research Laboratory, Edinburgh, South Australia, 2001. [35] M. Greco, F. Bordoni, and F. Gini, “X-Band Sea-Clutter nonstationarity:
Influence of Long Waves,” IEEE Journal of Oceanic Engineering, 29(2), 2004.
[36] S. Sayama, S. Ishii, and M. Sekine, “Amplitude Statistics of Sea Clutter Observed by L-band Radar”, IEEE Trans-actions on Fundamentals and
Material, 126(6), pp. 438-442, 2006.
Redes Neuronales Artificiales”, presented at the VIII Congreso Internacional de Telemática y Telecomunicaciones, Convención Científica de Ingeniería y Arquitectura ‘16, Palacio de las Convenciones, La Habana, Cuba, 2016.
[38] J. R. Machado Fernández and J. C. Bacallao Vidal, “Improved Shape Parameter Estimation in Pareto Distributed Clutter with Neural Networks (accepted)”, International Journal of Artificial Intelligence and Interactive
Multimedia, 3(9), 2016.
[39] J. H. Kim and M. R. Bell, “A computationally efficient CFAR algorithm based on a goodness-of-fit test for piecewise homogeneous environments”,
IEEE Transactions on Aerospace and Electronic Systems, 49(3), pp.
1519-1535, 2013.
[40] P. P. Gandhi and S. A. Kassam, “Two level CFAR detector (TL-CFAR) Analysis of CFAR processors in Homogeneous Background”, IEEE
Transactions on Aerospace and Electronic Systems, 24(4), pp. 427-445,
1988.
[41] J. R. Machado Fernández, “Estimation of the Relation between Weibull Distributed Sea clutter and the CA-CFAR Scale Factor”, Journal of
Tropical Engineering, 25(2), pp. 19-28, 2015.
[42] J. R. Machado Fernández, “CA-CFAR Scale Factor Optimal Selection for Several Probabilities of False Alarm under Log-Normal Slowly Variable Clutter (under revision)”, Ingeniería y Desarrollo, Colombia, 2015. [43] J. R. Machado Fernández and J. C. Bacallao Vidal, “Optimal Selection of
the CA-CFAR Adjustment Factor for K Distributed Amplitude Samples with a Fluctuating Shape Parameter (Accepted)”, Nova Scientia, 2016. [44] J. R. Machado Fernández and J. C. Bacallao Vidal, “Estimation of the
Optimal CA-CFAR Threshold Multiplier in Pareto Clutter with Known Parameters (under revision)”, Revista Entramado, 2016.
José Raúl Machado Fernández received his Telecommunications and Electronics Engineering Degree from the Instituto Superior José Antonio Echeverría (ISPJAE-CUJAE) in 2012. He is currently a Ph.D. student at the same institution. His research topics include teledetection, digital signal processing, sea clutter
modeling and the application of artificial intelligence for
solving diverse engineering problems.
Shirley Torres Martínez received his Telecommunications and Electronics Engineering Degree from the Instituto Superior José Antonio Echeverría (ISPJAE-CUJAE) in 2016. Her research interests include the performance of CFAR processors and the creation of enhanced digital detection proposals.