P
EDIATRICS
Dec 1997VOL. 100 NO. 6
zzz zzz zzz zzz zz
Annual Summary of Vital Statistics—1996
Bernard Guyer, MD, MPH*; Joyce A. Martin, MPH‡; Marian F. MacDorman, PhD‡; Robert N. Anderson, PhD‡; and Donna M. Strobino, PhD*
ABSTRACT. Several recent trends in the vital statistics of the United States continued in 1996, including an increase in life expectancy and declines in infant mortal-ity, births to teenage mothers, age-adjusted death rates, and death rates for children and adolescents.
In 1996, there were an estimated 3 914 953 births in the United States. The preliminary birth rate remained un-changed at 14.8 births per 1000 population, and the fer-tility rate, births per 1000 women 15 to 44 years of age, was essentially the same at 65.7. Fertility rates rose slightly for most racial and ethnic groups except black women, for whom the rate hit a historic low of 70.8. Overall, fertility remains particularly high for Hispanic women, although there is considerable variation within this heterogenous group. For the fifth consecutive year, birth rates dropped for teenagers. Birth rates for women
>30 years of age continued to increase. The birth rate for
unmarried women declined 1% in 1996 to 44.6 births per 1000 unmarried women, continuing the decline noted in 1995 for the first time in 2 decades.
The percentage of women who began prenatal care in the first trimester rose in 1996 to 81.8%, whereas the percentage with late (third trimester) or no care dropped to 4.1%. The rise in timely prenatal care was greatest for black and Hispanic women.
The percentage of low birth weight (LBW) infants reached 7.4% in 1996, its highest level since 1975. The very low birth weight rate remained unchanged at 1.4%. The rise in LBW occurred primarily among white women, whereas the LBW rate for black women dropped to 13.0%, the lowest rate reported since 1987. The rise among white women is only partially a result of increases in multiple births, be-cause LBW rates have also risen among white singleton births. The multiple birth ratio rose again in 1996 by 2%, as it has since 1980. The rise was particularly large for higher-order multiple births.
Infant mortality reached an all time low level of 7.2 deaths per 1000 births, based on preliminary 1996 data. Neonatal and postneonatal rates declined, as did rates for both black and white infants. National birth weight spe-cific mortality rates are reported here for the first time. In 1995, 63% of infant deaths occurred to the 7.3% of the population that was born LBW. The four leading cause of infant death were congenital anomalies, disorders relat-ing to short gestation and unspecified birth weight, sud-den infant death syndrome, and respiratory distress syn-drome, accounting for more than half of infant deaths in 1996. Despite the declines in infant mortality, the United States continues to rank poorly in international compar-isons of infant mortality.
Expectation of life at birth reached a new high in 1996 of 76.1 years for all gender and race groups combined. Age-adjusted mortality rates declined in 1996 for dis-eases of the heart, malignant neoplasms, cerebrovascular diseases, accidents and adverse effects, chronic liver dis-ease and cirrhosis, and suicide. They rose, as in the past several years, for chronic obstructive pulmonary dis-eases, diabetes mellitus, and pneumonia and influenza. For the first time since human immunodeficiency virus infection was created as a special cause-of-death category in 1987, death rates for human immunodeficiency virus infection declined from 15.6 in 1995 to 11.6 in 1996. The homicide rate also declined, as it has since 1991.
Death rates for children between 1 and 19 years of age declined in 1996, with an estimated 29 183 deaths to chil-dren. Unintentional injury mortality has dropped by
;50% among children and adolescents since 1979, al-though it remains the leading cause of death for all age groups of children from 1 to 19 years. Homicide was the fourth leading cause of death for children 1 to 4 and 5 to 9 years of age, the third leading cause for children 10 to 14, and the second leading cause for 15 to 19 year olds. Pediatrics1997;100:905–918;birth, death, infant mortality, low birth weight.
ABBREVIATIONS. IMR, infant mortality rate; HIV, human immu-nodeficiency virus; NCHS, National Center for Health Statistics; LBW, low birth weight; VLBW, very low birth weight; NMR, neonatal mortality rate; PNMR, postneonatal mortality rate; SIDS, sudden infant death syndrome.
From the *Department of Maternal and Child Health, Johns Hopkins School of Hygiene and Public Health, Baltimore, Maryland; and the ‡Division of Vital Statistics, National Center for Health Statistics, Centers for Disease Control and Prevention, Hyattsville, Maryland.
Received for publication Oct 1, 1997; accepted Oct 1, 1997.
Reprint requests to (B.G.) Johns Hopkins School of Hygiene and Public Health, 624 N Broadway, Baltimore, MD 21205.
M
uch of the information presented in this report of vital statistics for 1996 is good news. The infant mortality rate (IMR) for the United States continued to decline in 1996 to the lowest level ever recorded, life expectancy at birth reached an all time high, the rate of births to teen mothers has decreased for the fifth consecutive year, use of early prenatal care continued to increase for all groups of women, the birth rate for unmarried women declined slightly, the death rate from human immunodeficiency virus (HIV) infection decreased sharply, and deaths among children and adolescents from injuries including homicides decreased.The sources of data for this report were discussed in last year’s paper.1Preliminary data shown for 1996
are based on a substantial sample of records that are weighted to independent control counts of births, infant deaths, and total deaths2reported to the
Na-tional Center for Health Statistics (NCHS). Final data are shown for 1995 and earlier years. Because more detailed data are available in the final files for 1995 than in the preliminary files for 1996, some of the detailed analyses of birth and death patterns that we present here focus on the 1995 data. Wherever pos-sible, comparisons are made between final 1995 and preliminary 1996 data. Final data for 1996, based on complete birth and death files, may differ from pre-liminary estimates presented here, but we expect the differences to be small.
We include for the first time in this report infor-mation from NCHS’s Linked Birth/Infant Death Data Set—1995 Period Data.3 In this dataset, the
death certificate is linked with the corresponding birth certificate for each infant who died in 1995 in the United States. The purpose of this linkage is to use the many additional variables available from the birth certificate to better interpret infant mortality patterns. From this dataset, we present 1995 IMRs by detailed birth weight categories. As requested by some readers, more detailed information is being provided on the causes of childhood death from injuries, particularly those resulting from bicycle and pedestrian injury and from firearms.
Readers will note that we have eliminated the reports on marriages and divorces; readers who wish
to obtain this information should consult the follow-ing publication:Births, Marriages, Divorces, and Deaths for 1996.4
NATURAL INCREASE
An estimated 1 592 688 persons were added to the US population in 1996 as a result of natural increase, the excess of births over deaths (Table 1). The rate of natural increase was 6.0 per 1000 population, the same as the 1995 rate.
BIRTHS
There were an estimated 3 914 953 births in the United States in 1996, a slight increase (,1%) over the number reported in 1995 (Table 1). The prelimi-nary birth rate in 1996 was unchanged at 14.8 births per 1000 total population. The fertility rate, defined as the number of births per 1000 women 15 to 44 years of age, was 65.7, nearly the same as the rate in 1995. The differences in these three measures of childbearing between 1995 and 1996 are the smallest recorded in almost 50 years and suggest an easing of the downward trend in childbearing observed since 1991.5
Geographic Variation
The preliminary number of births for 1996 in-creased in 28 states, declined in 21 states and the District of Columbia, and was the same in 1 state. Fertility rates rose in 26 states, declined in 22 states and the District of Columbia, and were unchanged in 2 states. Table 2 shows the number of births for each state for 1996 by maternal race and Hispanic origin, and birth and fertility rates by state for 1995 and 1996.
Births to mothers of Hispanic, American Indian, and Asian or Pacific Islander origin tend to be highly concentrated geographically. In 1996, as in recent years, more than 3⁄4 of all Hispanic births were to
residents of six states (California, Texas, New York, Florida, Illinois, and Arizona). A total of 65% of Asian or Pacific Islander births were to residents of California, New York, Hawaii, Texas, Illinois, and Washington; and half of all births to American
In-TABLE 1. Vital Statistics of the United States, Selected Years*
Item Number Rate
1996† 1995‡ 1994‡ 1996† 1995‡ 1994‡ 1990 1980 1950 1915§
Live births 3 914 953 3 899 589 3 952 767 14.8 14.8 15.2 16.7 15.9 24.1 29.5
Fertility rate 65.7 65.6 66.7 70.9 68.4 106.2 125.0
Deaths 2 322 265 2 312 132 2 278 994 8.8 8.8 8.8 8.6 8.8 9.6 13.2
Age-adjusted rate 4.9 5.0 5.1 5.2 5.9 8.4 14.4
Natural increase 1 592 688 1 587 457 1 673 773 6.0 6.0 6.4 8.1 7.1 14.5 16.3
Infant mortality 28 237 29 583 31 710 7.2 7.6 8.0 9.2 12.6 29.2 99.9
Population base (in thousands) 265 284 262 755 260 341 248 710 226 546 150 697 100 549
* Data from the National Center for Health Statistics2,18,5and the US Bureau of the Census.6,7,42Rates per 1000 population except for fertility, which is per 1000 women 15– 44, and infant mortality, which is per 1000 live births.
† Preliminary data.2 ‡ Final data.18,5
§ Birth rate adjusted to include states not in registration area, (10 states and the District of Columbia when started in 1915). Death rate is for death registration area. Infant mortality rate is for birth registration area.43
TABLE 2. Live Births by Race and Hispanic Origin of Mother: United States, Each State, Puerto Rico, Virgin Islands, and Guam, Preliminary 1996, and Birth and Fertility Rates, Final 1995 and Preliminary 1996.
Area All Races Number Birth Rate* Fertility Rate*
White Black American Indian†
Asian or Pacific Islander
Hispanic‡ 1996 1995 1996 1995
United States§ 3 914 953 3 113 014 596 039 38 456 167 444 697 829 14.8 14.8 65.7 65.6
Alabama 61 477 40 943 19 833 124 577 937 14.4 14.2 63.1 61.9
Alaska 10 161 6930 425 2405 400 673 16.7 17.0 72.6 73.2
Arizona 79 590 69 869 2447 5770 1504 29 217 18.0 17.2 81.4 79.5
Arkansas 36 418 27 915 7921 244 338 1315 14.5 14.2 67.2 65.0
California 539 789 440 213 37 695 3462 58 420 251 123 16.9 17.5 74.8 76.6
Colorado 55 840 51 100 2579 587 1575 12 380 14.6 14.5 63.6 62.5
Connecticut 44 312 37 755 5224 106 1227 5614 13.5 13.5 61.5 61.0
Delaware 10 243 7620 2391 17 215 666 14.1 14.3 60.3 61.2
District of Columbia 8336 2062 6123 4 147 772 15.3 16.3 61.9 65.3
Florida 189 458 142 670 42 288 631 3869 35 708 13.2 13.3 64.6 64.9
Georgia 114 848 73 762 38 777 195 2115 6312 15.6 15.6 64.9 64.5
Hawaii 18 334 4790 508 183 12 853 2151 15.5 15.7 72.2 72.2
Idaho 19 059 18 446 76 290 247 2220 16.0 15.5 72.9 70.5
Illinois 184 369 141 603 36 499 225 6043 33 040 15.6 15.7 69.5 69.3
Indiana 83 303 73 237 9024 122 920 3036 14.3 14.3 62.6 62.2
Iowa 37 120 35 125 1047 200 748 1481 13.0 13.0 60.5 59.9
Kansas 39 734 35 518 3006 315 894 3504 15.4 14.5 70.5 66.1
Kentucky 52 632 47 243 4862 77 449 558 13.6 13.6 59.3 59.0
Louisiana 66 178 37 983 26 860 253 1083 1288 15.2 15.1 66.1 65.2
Maine 13 775 13 461 85 84 145 115 11.1 11.2 49.5 49.7
Maryland 69 696 44 763 22 349 167 2417 3146 13.7 14.4 58.6 60.6
Massachusetts 80 457 69 418 7329 162 3548 7737 13.2 13.4 57.2 57.9
Michigan 137 471 109 200 24 873 837 2561 5197 14.3 14.1 63.0 61.3
Minnesota 63 779 57 003 3034 1065 2677 2287 13.7 13.7 60.6 60.5
Mississippi 41 662 21 801 19 288 197 376 283 15.3 15.3 66.7 66.5
Missouri 73 782 61 277 11 091 270 1143 1516 13.8 13.7 62.1 61.5
Montana 10 707 9390 37 1173 108 299 12.2 12.8 57.7 60.2
Nebraska 23 321 21 373 1203 331 413 1866 14.1 14.2 64.3 64.5
Nevada 26 034 22 262 1972 419 1381 6946 16.2 16.4 75.2 75.2
New Hampshire 14 548 14 252 112 23 161 232 12.5 12.8 53.4 54.2
New Jersey 113 902 86 407 20 101 228 7166 19 458 14.3 14.5 64.6 64.8
New Mexico 27 235 23 193 467 3184 391 13 250 15.9 16.0 71.7 71.6
New York 271 458 197 275 55 805 632 17 747 53 024 14.9 15.0 66.5 66.1
North Carolina 105 741 74 710 27 462 1571 1999 5500 14.4 14.1 63.7 61.7
North Dakota 8358 7416 87 752 103 137 13.0 13.2 60.6 61.3
Ohio 152 664 128 739 21 705 260 1959 2992 13.7 13.8 60.7 61.0
Oklahoma 46 209 36 642 4486 4303 778 2882 14.0 13.9 65.0 64.3
Oregon 43 677 40 456 893 673 1655 5464 13.6 13.6 62.7 62.2
Pennsylvania 149 962 125 639 20 791 222 3310 6811 12.4 12.6 57.6 57.8
Rhode Island 12 514 11 049 931 137 396 1633 12.6 12.9 56.3 57.3
South Carolina 50 807 32 197 17 861 114 635 960 13.7 13.9 59.2 59.3
South Dakota 10 475 8662 83 1635 96 146 14.3 14.4 66.6 66.9
Tennessee 73 779 56 539 16 029 191 1020 1425 13.9 13.9 60.9 60.6
Texas 327 163 278 760 38 708 823 8872 140 539 17.1 17.2 74.3 74.5
Utah 41 388 39 291 331 626 1140 3865 20.7 20.3 87.6 86.2
Vermont 6745 6666 17 9 53 39 11.5 11.6 50.1 50.2
Virginia 92 400 67 359 20 920 172 3949 5158 13.8 14.0 58.5 58.6
Washington 79 959 69 329 3187 1913 5529 9183 14.5 14.2 63.6 62.1
West Virginia 20 704 19 808 744 10 141 122 11.3 11.6 52.4 52.7
Wisconsin 67 094 57 936 6425 846 1887 3099 13.0 13.2 58.2 58.8
Wyoming 6285 5956 49 218 62 523 13.1 13.0 59.8 59.3
Puerto Rico 63 108 58 106 5002 — — — 16.7 17.0 70.8 72.2
Virgin Islands 1905 350 1503 46 6 321 — — — —
Guam 4266 601 76 22 3566 53 — — — —
* Birth rates per 1000 total population; fertility rates per 1000 women 15 to 44 years old. † Includes births to Aleuts and Eskimos.
‡ Persons of Hispanic origin may be of any race.
§ Excludes data for Puerto Rico, Virgin Islands, and Guam. —, Data not available.
dian women were to residents of five states (Arizona, Oklahoma, California, New Mexico, and Alaska).
Racial and Ethnic Composition
The fertility levels of all racial and ethnic groups have generally declined during the 1990s, but pre-liminary data for 1996 suggest a deviation in the downward trend for some groups. Fertility rates rose or were fairly level in 1996 compared with 1995 among white (64.7), American Indian (69.8), and Asian or Pacific Islander (66.6) women, but the rate continued to drop among black mothers to a historic low of 70.8. Fertility among black mothers has dropped 18% since 1990 (from 86.8). A slight decline (,1%) was also reported for Hispanic mothers (104.4).
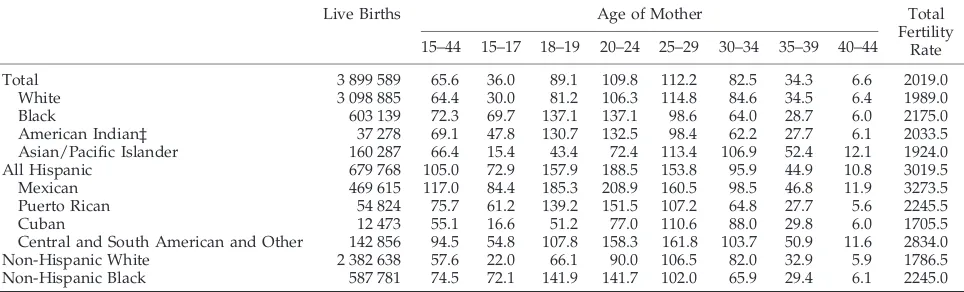
Fertility rates differ among racial and ethnic groups and particularly among Hispanic subgroups (Table 3). Fertility among Hispanic women overall continues to be higher than that of the other racial or ethnic groups for whom rates can be computed. The category of Hispanic women, however, includes Mexican women with the highest reported fertility (117.0) and Cuban women with the lowest (55.1) rate. Primarily because of the higher fertility of Hispanic mothers compared with non-Hispanic mothers, and a rise in the proportion of Hispanic women in their childbearing years, the percentage of all births that are of Hispanic origin rose from 14.5% in 1990 to 17.8% in 1996.6,7
Trends in Age-specific Birth Rates
Teen Childbearing
Preliminary 1996 data indicate that teenage child-bearing fell 4% to 54.7 births per 1000 females 15 to 19 years of age, the fifth consecutive year of decline in the teen birth rate, with a total drop of 12% since 1991 (Table 4). A recent study of teen birth rates between 1991 and 1995 indicates that the decline is widespread throughout the United States, occurring in all 50 states and the District of Columbia.8 The
1996 teen birth rate is still higher, however, than rates reported between 1976 and 1988.
The preliminary 1996 birth rate for white teenagers 15 to 19 years of age decreased 3% to 48.4, with a larger decline among younger teens 15 to 17 years of age. The rate for black teens 15 to 19 years fell 5% to 91.7 and included a 7% drop for younger black women 15 to 17 years of age. Since 1991, the fertility rate for black teens 15 to 19 years of age has fallen 21% (from 115.5).
The rate for Hispanic teens 15 to 19 years of age also fell 5% between 1995 and 1996, from 106.7 to 101.6 per 1000. Unlike that of white and black teens however, childbearing among Hispanic teens has not declined consistently in recent years; and 1996 marks the first substantial decline since data for this group have been available.
Although the teenage population in the United States grew in 1996, the decline in the teen birth rate resulted in a slight drop in the total number of births to teen mothers (from 499 873 to 494 272 births to 15 to 19 year olds) and a decline in the proportion of all births that were to teen mothers (13.1% to 12.9%). This drop is noteworthy; had the teen birth rate not fallen from the 1991 level, there would have been at least an additional 67 000 births to teenage mothers in 1996.
Childbearing for Women$20 Years of Age
Birth rates for women 20 to 24 and 25 to 29 years of age, the principal childbearing years, had declined in the first half of the 1990s, but rose in 1996 by 1% and 2% to 111.1 and 113.9 per 1000, respectively.
Birth rates also rose among women 30 to 34 and 35 to 39 years of age by 2% and 3%, respectively, in 1996, to 84.5 and 35.4 per 1000. Rates among these age groups had been rising through the 1990s, al-though the pace of increase has slowed. Birth rates for women 30 to 34, and especially for those 35 to 39 years of age, have risen substantially since the late 1970s (by 46% and 86%, respectively, since 1978) and are the highest observed in 3 decades. The birth rate for women 40 to 44 years of age also continued to increase for 1996, rising from 6.6 to 6.8, and was higher than any year since 1971.
TABLE 3. Live Births, Age-specific Birth Rates*, and Total Fertility Rates† by Race and Hispanic Origin of Mother, Final Natality Data, United States, 1995
Live Births Age of Mother Total
Fertility Rate 15–44 15–17 18–19 20–24 25–29 30–34 35–39 40–44
Total 3 899 589 65.6 36.0 89.1 109.8 112.2 82.5 34.3 6.6 2019.0
White 3 098 885 64.4 30.0 81.2 106.3 114.8 84.6 34.5 6.4 1989.0
Black 603 139 72.3 69.7 137.1 137.1 98.6 64.0 28.7 6.0 2175.0
American Indian‡ 37 278 69.1 47.8 130.7 132.5 98.4 62.2 27.7 6.1 2033.5
Asian/Pacific Islander 160 287 66.4 15.4 43.4 72.4 113.4 106.9 52.4 12.1 1924.0
All Hispanic 679 768 105.0 72.9 157.9 188.5 153.8 95.9 44.9 10.8 3019.5
Mexican 469 615 117.0 84.4 185.3 208.9 160.5 98.5 46.8 11.9 3273.5
Puerto Rican 54 824 75.7 61.2 139.2 151.5 107.2 64.8 27.7 5.6 2245.5
Cuban 12 473 55.1 16.6 51.2 77.0 110.6 88.0 29.8 6.0 1705.5
Central and South American and Other 142 856 94.5 54.8 107.8 158.3 161.8 103.7 50.9 11.6 2834.0 Non-Hispanic White 2 382 638 57.6 22.0 66.1 90.0 106.5 82.0 32.9 5.9 1786.5 Non-Hispanic Black 587 781 74.5 72.1 141.9 141.7 102.0 65.9 29.4 6.1 2245.0
* Rates per 1000 women in age-specific group.
† Sum of age-specific birth rates times 5 divided by 1000. ‡ Includes births to Aleuts and Eskimos.
Unmarried Mothers
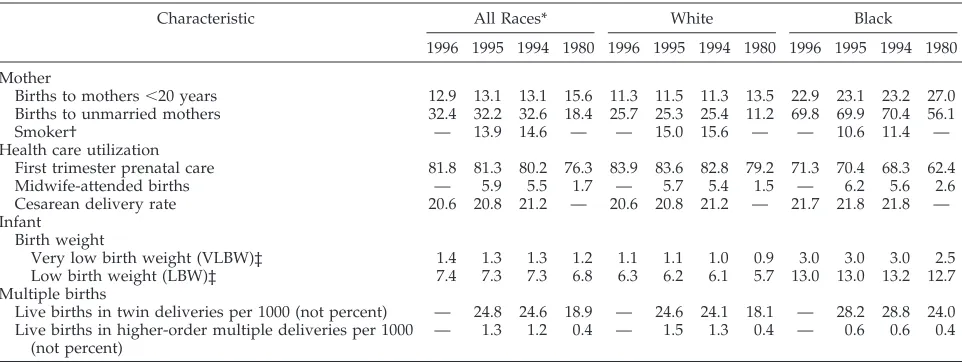
The preliminary birth rate in 1996 for unmarried women declined 1% to 44.6 births per 1000 unmar-ried women, reflecting the larger increase in the number of unmarried women relative to the number of births to unmarried women. This rate had de-clined for the first time in nearly 2 decades between 1994 and 1995 from 46.9 to 45.1. The percentage of all births to unmarried women rose slightly in 1996, however, to 32.4%, and the number of births to un-married women increased 1% to 1 267 383. The per-centage of births to unmarried women rose for whites, but it declined slightly for black women in 1996.
Smoking During Pregnancy
Smoking during pregnancy declined 5% to 13.9% of mothers who gave birth in 1995 (Table 5). (Data on tobacco use are not available for 1996.) Since infor-mation on tobacco use during pregnancy first be-came available from birth certificate data in 1989, the proportion of women who are reported to smoke
during pregnancy has fallen 29% (from 19.5%), as has the number of cigarettes consumed by smokers. Smoking levels declined for mothers $20 years of age in 1995 but rose slightly for teenagers 15 to 19 years of age. The percentage of black teenagers who smoked rose 6% to 5.3% but remained much lower than that for white teenagers (21.9%). Smoking dur-ing pregnancy has long been linked to adverse preg-nancy outcome and is considered as a major known modifiable risk factor for low birth weight (LBW) and infant death.9
Prenatal Care
The percentage of mothers who began care in the first trimester of pregnancy continued to rise based on preliminary 1996 data, climbing to 81.8% (Table 5). Prenatal care use improved rapidly during the 1970s, was generally unchanged during the 1980s, but has risen steadily during the 1990s (from 75.5% in 1989). Concurrently, the percentage of mothers with late care (beginning in the third trimester) or no care has dropped from 6.4% to 4.1% between 1989
TABLE 4. Birth Rates for Teenagers by Age, Race, and Hispanic Origin of Mother: United States, Final 1990 –1995 and Preliminary 1996
Year 15–19 Years 15–17 Years 18–19 Years
All Races White Black Hispanic* All Races White Black Hispanic* All Races White Black Hispanic*
1996 54.7 48.4 91.7 101.6 34.0 28.6 64.9 68.9 86.5 78.8 133.0 150.7
1995 56.8 50.1 96.1 106.7 36.0 30.0 69.7 72.9 89.1 81.2 137.1 157.9
1994 58.9 51.1 104.5 107.7 37.6 30.7 76.3 74.0 91.5 82.1 148.3 158.0
1993 59.6 51.1 108.6 106.8 37.8 30.3 79.8 71.7 92.1 82.1 151.9 159.1
1992 60.7 51.8 112.4 107.1 37.8 30.1 81.3 71.4 94.5 83.8 157.9 159.7
1991† 62.1 52.8 115.5 106.7 38.7 30.7 84.1 70.6 94.4 83.5 158.6 158.5
1990† 59.9 50.8 112.8 100.3 37.5 29.5 82.3 65.9 88.6 78.0 152.9 147.7
Percent change, 1991–1996 2
12 28 221 25 212 27 223 22 28 26 216 25
* Persons of Hispanic origin may be of any race.
† Excludes data for New Hampshire, which did not require reporting of Hispanic origin of mother. Note: Rates per 1000 women in specified group.
TABLE 5. Percent of Births with Selected Characteristics, by Race of Mother: United States, Final Data 1980, 1994 –1995, Preliminary 1996
Characteristic All Races* White Black
1996 1995 1994 1980 1996 1995 1994 1980 1996 1995 1994 1980
Mother
Births to mothers,20 years 12.9 13.1 13.1 15.6 11.3 11.5 11.3 13.5 22.9 23.1 23.2 27.0 Births to unmarried mothers 32.4 32.2 32.6 18.4 25.7 25.3 25.4 11.2 69.8 69.9 70.4 56.1
Smoker† — 13.9 14.6 — — 15.0 15.6 — — 10.6 11.4 —
Health care utilization
First trimester prenatal care 81.8 81.3 80.2 76.3 83.9 83.6 82.8 79.2 71.3 70.4 68.3 62.4
Midwife-attended births — 5.9 5.5 1.7 — 5.7 5.4 1.5 — 6.2 5.6 2.6
Cesarean delivery rate 20.6 20.8 21.2 — 20.6 20.8 21.2 — 21.7 21.8 21.8 —
Infant Birth weight
Very low birth weight (VLBW)‡ 1.4 1.3 1.3 1.2 1.1 1.1 1.0 0.9 3.0 3.0 3.0 2.5 Low birth weight (LBW)‡ 7.4 7.3 7.3 6.8 6.3 6.2 6.1 5.7 13.0 13.0 13.2 12.7 Multiple births
Live births in twin deliveries per 1000 (not percent) — 24.8 24.6 18.9 — 24.6 24.1 18.1 — 28.2 28.8 24.0 Live births in higher-order multiple deliveries per 1000
(not percent)
— 1.3 1.2 0.4 — 1.5 1.3 0.4 — 0.6 0.6 0.4
* Includes races other than white and black.
† Excludes data for California, Indiana, New York, (but includes New York City), and South Dakota, which did not require reporting of tobacco use.
‡ VLBW, Birth weight of,1500 g (3 lb, 4 oz), and LBW is birth weight of,2500 g (5 lb, 8 oz).
and 1996. Early, comprehensive prenatal care can promote healthier pregnancies by detecting and managing preexisting medical conditions and pro-viding health behavior advice.10
Between 1995 and 1996, increases in first trimester care were observed among white (from 83.6% to 83.9%), black (from 70.4% to 71.3%), and Hispanic mothers (from 70.8% to 71.9%). Since 1989, the per-centage of black mothers with first trimester care has risen 19% (from 60.0%), and the level of late or no care has dropped from 11.9% to 7.4%. Improvement is even more marked among Hispanic mothers; timely care has climbed 21% (from 59.5%), and the percentage of mothers with late or no care plum-meted from 13.0% to 6.8%. The gains for black and Hispanic mothers have occurred among all age groups.
Cesarean Delivery
Preliminary 1996 data indicate that the percentage of births delivered by cesarean delivery declined slightly to 20.6%, from 20.8% in 1995. This rate has fallen steadily from 22.8% in 1989 when information on the method of delivery first became available from birth certificate data (Table 5). Most of the current year decline is attributable to an increase in the rate of vaginal births after previous cesarean, which rose from 27.5% to 28.4% between 1995 and 1996. The primary cesarean rate (first cesarean per 100 live births to women who have not had a previ-ous cesarean) declined only slightly from 14.7% to 14.6% in this period. Since 1989, the vaginal births after previous cesarean rate has risen 50% (from 18.9%), and the primary cesarean rate has declined 9% (from 16.1%). Results of a recent study indicate that most of the progress in reducing cesarean rates between 1991 and 1995 has been for non-Hispanic white mothers and, to a lesser extent, for Hispanic mothers.11
Multiple Births
The multiple birth ratio rose again in 1995 by 2%, to 26.1 per 1000 births. (Preliminary 1996 data for multiple births are not available.) This ratio (defined as the number of births in multiple deliveries per 1000 live births) has risen by an average of 2% each year since 1980 (Table 5). The number of births in multiple deliveries increased only slightly to 101 709 from 101 658 for 1994. There was a small dip in the total number of twin births as a result of a 7% drop in the number of twins born to black mothers; the number of twins born to white mothers rose 1%. Since 1980, the number of twin births has risen by 42% (from 68 339), and the number of higher-order multiple births by 272% (from 1337).12,13 Births in
order multiple deliveries (triplets and higher-order multiple births) rose 8% to 4973 births for 1995, and included 4551 triplet, 365 quadruplet, and 57 quintuplet or greater multiples.
The higher-order multiple birth ratio climbed 10% between 1994 and 1995, from 116.2 to 127.5 per 100 000. This ratio has doubled since 1989, tripled since the early 1980s, and quadrupled since the early 1970s.13To illustrate this growth in another way, 1 of
every 785 births was a triplet in 1995 compared with only 1 of 3500 births in the early 1970s. About one third of the rise in the ratio since 1980 has been estimated to be the result of shifts in the maternal age distribution to older ages (multiple births are more common among older mothers) and the remaining two thirds, a result of increases in the use of fertility-enhancing therapies.13,14
Twins, triplets, and higher-order multiple births are much more vulnerable to early death and long-term disability than singletons, and risk rises with increasing plurality.15More than 50% of all twins and
90% of triplets are LBW (,2500 g) compared with 6% of singleton births. Moreover, twins are 5 times, and triplets 13 times more likely to die within the first year of life.3
Birth Weight
The percent of LBW infants (,2500 g) rose to 7.4% in 1996, the highest level reported since 1975. The LBW rate declined during the 1970s and early 1980s, but has risen 10% since 1984 (from 6.7%). The percent of very low birth weight (VLBW) infants (,1500 g) was essentially unchanged at 1.4% (Table 5).
LBW increased among births to white mothers for the fourth consecutive year, to 6.3% in 1996, and has risen from 5.7% since 1990. All of the current year rise was for mothers$20 years of age. The propor-tion of VLBW white births was 1.08%, the highest level reported since at least 1970. Some of this in-crease in LBW can be attributed to the rising propor-tion of multiple births among white mothers, but in more recent years, LBW for white singletons has also risen (from 4.7% in 1992 to 5.0% in 1995).
Among births to black mothers, LBW fell to the lowest rate reported since 1987 (13.0%), continuing the downward trend noted since 1992. The level of VLBW among black births has been essentially static at 3.0% since the late 1980s.
The LBW percent is highest for the youngest and oldest mothers, with a slightly elevated risk for mothers $40 years of age. When only singleton births for 1995 are examined, however, the LBW percent was 10% higher for mothers,20 years of age than for those$40 years of age (multiple births are more common among older mothers). Recent studies suggest that the elevated LBW rate of younger moth-ers may be related to the preponderance of teenage
mothers who are from disadvantaged
back-grounds.16,17
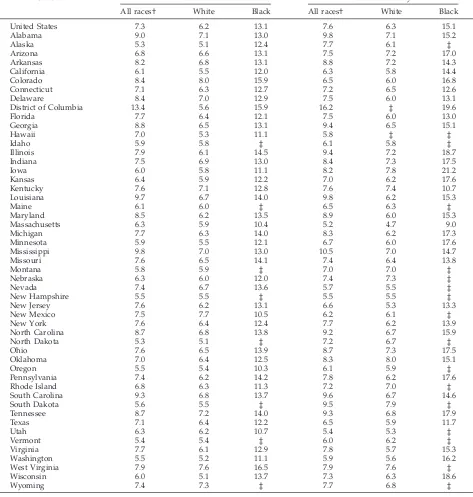
LBW percentages vary widely by state (Table 6). For 1995, ratios for infants born to white mothers ranged from 5.1% for Alaska, North Dakota, and Wisconsin to 8.0% and 7.7% in Colorado and New Mexico. Among the reporting areas with 1000 or more black infants, LBW percents for black infants ranged from 10.4% for Massachusetts to 15.9% for the District of Columbia and Colorado.
INFANT MORTALITY
the United States.18Neonatal mortality rates (NMRs;
infant deaths ,28 days) and postneonatal mortality rates (PNMRs; infant deaths 28 days through 11 months) also declined, as did rates for both white and black infants.
Infant mortality in the United States has declined by.60% since 1970 (Table 7, Figure ). For the early part of this period, the NMR declined more rapidly than the PNMR, although the PNMR has declined more rapidly than the NMR since 1989. The decline in the perinatal mortality rate (number of fetal deaths
at 28 weeks gestation or more plus number of infant deaths at ,7 days of age per 1000 live births plus fetal deaths) has closely paralleled the decline in the NMR.19
Racial differences in the IMR remain a major na-tional concern. Although all race groups have expe-rienced declines in IMR, the relative difference in rates between black and white newborns has in-creased (Table 7). Higher neonatal mortality among black births largely reflects their higher percentage of LBW and VLBW births. Although various
hypothe-TABLE 6. Infant Mortality Rates and Percent of LBW by Race for the United States and Each State, 1995
State LBW* Infant Mortality
All races† White Black All races† White Black
United States 7.3 6.2 13.1 7.6 6.3 15.1
Alabama 9.0 7.1 13.0 9.8 7.1 15.2
Alaska 5.3 5.1 12.4 7.7 6.1 ‡
Arizona 6.8 6.6 13.1 7.5 7.2 17.0
Arkansas 8.2 6.8 13.1 8.8 7.2 14.3
California 6.1 5.5 12.0 6.3 5.8 14.4
Colorado 8.4 8.0 15.9 6.5 6.0 16.8
Connecticut 7.1 6.3 12.7 7.2 6.5 12.6
Delaware 8.4 7.0 12.9 7.5 6.0 13.1
District of Columbia 13.4 5.6 15.9 16.2 ‡ 19.6
Florida 7.7 6.4 12.1 7.5 6.0 13.0
Georgia 8.8 6.5 13.1 9.4 6.5 15.1
Hawaii 7.0 5.3 11.1 5.8 ‡ ‡
Idaho 5.9 5.8 ‡ 6.1 5.8 ‡
Illinois 7.9 6.1 14.5 9.4 7.2 18.7
Indiana 7.5 6.9 13.0 8.4 7.3 17.5
Iowa 6.0 5.8 11.1 8.2 7.8 21.2
Kansas 6.4 5.9 12.2 7.0 6.2 17.6
Kentucky 7.6 7.1 12.8 7.6 7.4 10.7
Louisiana 9.7 6.7 14.0 9.8 6.2 15.3
Maine 6.1 6.0 ‡ 6.5 6.3 ‡
Maryland 8.5 6.2 13.5 8.9 6.0 15.3
Massachusetts 6.3 5.9 10.4 5.2 4.7 9.0
Michigan 7.7 6.3 14.0 8.3 6.2 17.3
Minnesota 5.9 5.5 12.1 6.7 6.0 17.6
Mississippi 9.8 7.0 13.0 10.5 7.0 14.7
Missouri 7.6 6.5 14.1 7.4 6.4 13.8
Montana 5.8 5.9 ‡ 7.0 7.0 ‡
Nebraska 6.3 6.0 12.0 7.4 7.3 ‡
Nevada 7.4 6.7 13.6 5.7 5.5 ‡
New Hampshire 5.5 5.5 ‡ 5.5 5.5 ‡
New Jersey 7.6 6.2 13.1 6.6 5.3 13.3
New Mexico 7.5 7.7 10.5 6.2 6.1 ‡
New York 7.6 6.4 12.4 7.7 6.2 13.9
North Carolina 8.7 6.8 13.8 9.2 6.7 15.9
North Dakota 5.3 5.1 ‡ 7.2 6.7 ‡
Ohio 7.6 6.5 13.9 8.7 7.3 17.5
Oklahoma 7.0 6.4 12.5 8.3 8.0 15.1
Oregon 5.5 5.4 10.3 6.1 5.9 ‡
Pennsylvania 7.4 6.2 14.2 7.8 6.2 17.6
Rhode Island 6.8 6.3 11.3 7.2 7.0 ‡
South Carolina 9.3 6.8 13.7 9.6 6.7 14.6
South Dakota 5.6 5.5 ‡ 9.5 7.9 ‡
Tennessee 8.7 7.2 14.0 9.3 6.8 17.9
Texas 7.1 6.4 12.2 6.5 5.9 11.7
Utah 6.3 6.2 10.7 5.4 5.3 ‡
Vermont 5.4 5.4 ‡ 6.0 6.2 ‡
Virginia 7.7 6.1 12.9 7.8 5.7 15.3
Washington 5.5 5.2 11.1 5.9 5.6 16.2
West Virginia 7.9 7.6 16.5 7.9 7.6 ‡
Wisconsin 6.0 5.1 13.7 7.3 6.3 18.6
Wyoming 7.4 7.3 ‡ 7.7 6.8 ‡
* Percent of births less than 2500 grams. † Includes races other than white and black.
‡ Figure does not meet standards of reliability or precision.
ses have been advanced to explain these differenc-es,20,21 the large race disparity in LBW and VLBW
presents continued challenges for researchers and health care providers.
Birth Weight-Specific Infant Mortality
Birth weight is one of the important predictors of infant mortality. The IMR for a given population can be partitioned into two key components: the birth weight distribution and birth weight-specific mortal-ity rates (the death rate for infants at a given weight). The IMR decreases when either the percentage of LBW births decreases or the birth weight-specific mortality rates decrease. The percentage of LBW and VLBW births declined slightly from the 1970s to the mid 1980s but has increased steadily since then (Fig-ure). Thus, virtually all of the decline in infant mor-tality since 1970 has been attributable to declines in
birth weight-specific IMR, and not to the prevention of LBW.22 These declines have been attributed
pri-marily to improvements in obstetric and neonatal care. However, we have been unsuccessful in the United States in reducing the number of preterm and LBW deliveries, even though prevention efforts have the potential to save many more infant lives and reduce subsequent morbidity than additional im-provements in neonatal care.23
In 1995, 63% of all infant deaths occurred to the 7.3% of infants born at LBW.3 More than 9 of 10
infants with birth weights,500 g die within the first year of life—most within the first few days of life (Table 8). An infant’s chances of survival increase rapidly thereafter with increasing birth weight. At birth weights of 1250 to 1499 g, ;95 of 100 babies now survive the first year of life. IMRs are lowest for white infants at birth weights of 4000 to 4499 g and
TABLE 7. Infant, Neonatal, Postneonatal, and Perinatal Mortality Rates by Race of Mother, United States, Selected Years
1996* 1995 1970 Percent Change 1970–1996
Infant mortality rate†‡ 7.2 7.6 20.0 264.0
White 6.0 6.3 17.6 265.9
Black 14.2 15.1 33.3 257.4
Black:white ratio 2.4 2.4 1.9
Neonatal mortality rate†‡ 4.7 4.9 15.1 268.9
White 3.9 4.1 13.7 271.5
Black 9.2 9.8 23.2 260.3
Black:white ratio 2.4 2.4 1.7
Postneonatal mortality rate†‡ 2.5 2.7 4.9 249.0
White 2.1 2.2 4.0 247.5
Black 5.0 5.3 10.1 250.5
Black:white ratio 2.4 2.4 2.5
Perinatal mortality rate†§ — 7.6 23.0 267.0\
White — 6.5 20.9 268.9\
Black — 13.8 34.9 260.5\
Black:white ratio — 2.1 1.7
* Preliminary data.
† Includes races other than white and black. ‡ Rate per 1000 live births.
§ Number of fetal deaths at$28 weeks of gestation plus number of infant deaths at,7 days of age per 1000 live births plus fetal deaths. \Percent change is from 1970 to 1995 because preliminary 1996 data are not available.
Source: National Center for Health Statistics, National Vital Statistics System, 1970 –1996.
for black infants at birth weights of 3500 to 3999 g, with small increases among the heaviest infants. IMRs are lower for black than for white infants for individual birth weight categories ,2500 g, but are higher at birth weights of$2500 g. In contrast, IMRs are slightly higher for black infants for the broad birth weight categories of,1500 g and,2500 g. The birth weight distribution for black infants has a much higher proportion of births at extremely LBWs, and this has influenced the IMRs for these broad birth weight groupings.
From 1985 to 1995, IMRs declined by 50% to 56% for infants weighing 750 to 1499 g at birth and by 35% to 39% for infants with birth weights between 1500 and 2499 g. IMRs declined by 31% for infants at birth weights of 500 to 749 g, and coincidentally, for those weighing$2500 g. In contrast, mortality rates for infants born at,500 g declined by ,2% during the decade, reflecting the limited success of intensive efforts made to save these very small infants. For the few infants who do survive at these LVBWs, many suffer lifetime disabilities such as blindness, mental
TABLE 8. Infant and Neonatal Mortality Rates by Birth Weight and Race of Mother, United States, 1995
Birth Weight (grams) Infant Mortality Rates Neonatal Mortality Rates
All Races* White Black All Races* White Black
Total 7.6 6.3 14.6† 4.9 4.1 9.6†
,2500 65.5 60.4 80.5 53.1 49.7 64.2
,1500 271.4 263.1 289.6 240.0 235.6 252.0
,500 905.1 912.1 896.4 890.1 896.6 882.2
500–749 531.9 549.4 504.0 471.7 495.4 436.2
750–999 184.2 194.7 165.1 142.3 159.6 112.1
1000–1249 86.5 91.9 75.4 61.8 69.3 46.5
1250–1499 55.3 56.1 49.2 39.8 42.4 30.7
1500–1999 33.5 33.5 32.8 21.4 22.5 17.7
2000–2499 13.7 13.8 13.6 7.0 7.7 5.4
25001 3.0 2.7 4.6 1.1 1.1 1.3
2500–2999 5.5 5.3 6.3 2.3 2.4 2.1
3000–3499 2.9 2.7 4.1 1.0 1.0 1.0
3500–3999 2.0 1.8 3.5 0.7 0.7 0.9
4000–4499 1.8 1.6 4.4 0.7 0.7 1.6
45001 2.8 2.6 ‡ 1.3 1.2 ‡
* Includes races other than white and black.
† Infant and neonatal mortality rates by race from the linked birth/infant death dataset differ slightly from those based on unlinked data (Tables 6, 7), because the linked file uses the self-reported race of mother from the birth certificate, whereas the unlinked data uses the race of child as reported by the funeral director.
‡ Figure does not meet standards of reliability or precision.
Source: National Center for Health Statistics, Linked Birth/Infant Death Data Set—1995 Period Data.
Note: Not stated birth weight was imputed when period of gestation was known and proportionally distributed when period of gestation was unknown.
TABLE 9. Infant Deaths and Infant Mortality Rates for the 10 Leading Causes of Infant Death in 1996: United States, 1979, 1995, and 1996
Cause of Death Rank* 1996 1995 1979 Percent Change
1979–1996 Number Percent Rate† Number Percent Rate† Number Percent Rate†
All causes — 28 245 100.0 721.5 29 583 100.0 758.6 45 665 100.0 1306.8 244.8 Congenital anomalies (740–759) 1 6463 22.9 165.1 6554 22.2 168.1 8923 19.5 255.4 235.4 Disorders relating to short gestation and
unspecified low birth weight (765)
2 3706 13.1 94.7 3933 13.3 100.9 3495 7.7 100.0 25.3
SIDS (798.0) 3 2906 10.3 74.2 3397 11.5 87.1 5279 11.6 151.1 250.9
Respiratory distress syndrome (769) 4 1368 4.8 34.9 1454 4.9 37.3 5458 12.0 156.2 277.7 Newborn affected by maternal
complications of pregnancy (761)
5 1212 4.3 31.0 1309 4.4 33.6 1621 3.5 46.4 233.2
Newborn affected by complications of placenta, cord, and membranes (762)
6 892 3.2 22.8 962 3.3 24.7 970 2.1 27.8 218.0
Accidents and adverse effects (E800–E949) 7 772 2.7 19.7 787 2.7 20.2 1080 2.4 30.9 236.2 Infections specific to the perinatal period
(771)
8 747 2.6 19.1 788 2.7 20.2 981 2.1 28.1 232.0
Pneumonia and influenza (480–487) 9 485 1.7 12.4 492 1.7 12.6 1129 2.5 32.3 261.6 Intrauterine hypoxia and birth asphyxia
(768)
10 429 1.5 11.0 475 1.6 12.2 1393 3.1 39.9 272.4
* Rank based on number of deaths. † Rate per 100 000 live births.
retardation, and neurologic disorders, necessitating increased levels of medical and parental care.24 –26
Leading Causes of Infant Death
The 10 leading causes of infant death are shown in Table 9. Since 1979, causes of death in the United States have been classified according to the Interna-tional Classification of Diseases, 9th rev.27In 1996, more
than half of all infant deaths were attributable to the four leading causes of infant death: congenital anom-alies, disorders relating to short gestation and un-specified LBW, sudden infant death syndrome (SIDS), and respiratory distress syndrome. IMRs from congenital anomalies have declined by 35% from 1979 to 1996. However this decline has been less than that for infant mortality as a whole. SIDS rates have fallen by 38% since 1992 when the American Academy of Pediatrics issued a recommendation to reduce the risk of SIDS by placing infants on their backs or sides to sleep.28 –30IMRs for respiratory
dis-tress syndrome have declined by .60% since 1989 when new medical treatments for this condition be-came widely available.31–33Infant mortality for
disor-ders related to short gestation and unspecified LBW, the second leading cause of infant death, exhibited the smallest decline since 1979 of any of the 10 lead-ing causes of death. As discussed above, the preven-tion of LBW and preterm delivery is one of the most significant challenges facing the medical profession in the next decade.
Geographic Variation
Among all states in 1995, Massachusetts and Utah (Table 6) had the lowest IMR (5.2 and 5.4, respective-ly). Although the highest rate was noted for the District of Columbia, it is more appropriately
com-parable with rates for other large US cities because of the high concentrations of high-risk women in these areas. Eighteen states have already met the Year 2000 infant mortality health objective of an overall IMR
#7.0.
Differences in IMRs by state reflect in part differ-ences in the racial and socioeconomic composition of the population of states and regions of the country. Also, caution must be exercised in comparing IMRs among states as differences, although seemingly large, may not be statistically significant.
INTERNATIONAL COMPARISONS OF INFANT MORTALITY
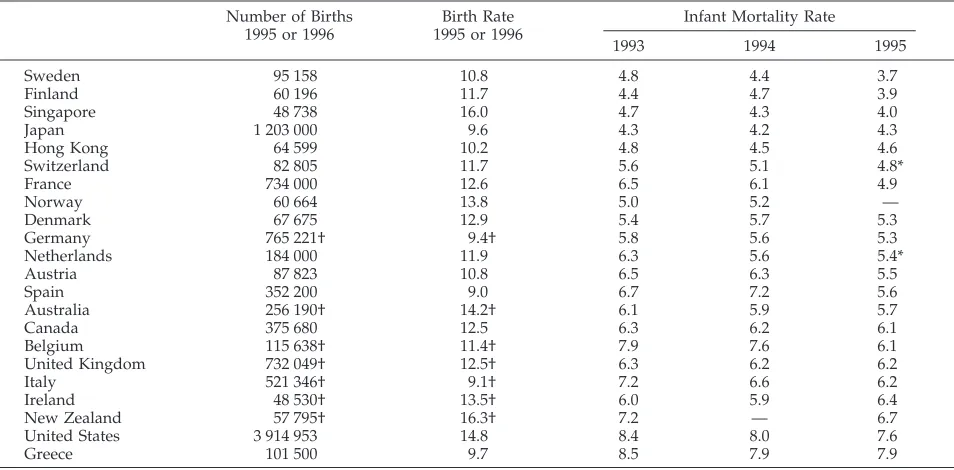
Table 10 shows IMRs for countries with at least 2.5 million population, with rates equal to or less than the US rate in recent years based on relatively com-plete data. Although the IMR has decreased in recent years, the United States continues to be in a less than enviable position relative to the other industrialized countries; indeed, the US rate is higher than for all other countries listed in the Table except Greece. However, once again, we caution readers about over-emphasizing the position of the United States in infant mortality because of the difficulty in obtaining accurate (and comparable) data for infant deaths even for developed countries.
As we noted last year, there are a number of pos-sible reasons why the United States IMR remains higher than that for many other developed countries. One reason stems from reporting differences across countries related to the definition of a live birth, the timing of when births are reported, and the practices surrounding the reporting of stillbirths in a coun-try.34 –37 The magnitude of the effect of these
report-ing differences on the comparability of rates is
un-TABLE 10. Live Births and Birth Rates for 1995 or 1996 and Infant Mortality Rates for 1993, 1994, and 1995 for Countries of 2 500 000 Population and With Infant Mortality Rates Equal to or Less Than the United States in 1993, 1994, or 1995
Number of Births 1995 or 1996
Birth Rate 1995 or 1996
Infant Mortality Rate
1993 1994 1995
Sweden 95 158 10.8 4.8 4.4 3.7
Finland 60 196 11.7 4.4 4.7 3.9
Singapore 48 738 16.0 4.7 4.3 4.0
Japan 1 203 000 9.6 4.3 4.2 4.3
Hong Kong 64 599 10.2 4.8 4.5 4.6
Switzerland 82 805 11.7 5.6 5.1 4.8*
France 734 000 12.6 6.5 6.1 4.9
Norway 60 664 13.8 5.0 5.2 —
Denmark 67 675 12.9 5.4 5.7 5.3
Germany 765 221† 9.4† 5.8 5.6 5.3
Netherlands 184 000 11.9 6.3 5.6 5.4*
Austria 87 823 10.8 6.5 6.3 5.5
Spain 352 200 9.0 6.7 7.2 5.6
Australia 256 190† 14.2† 6.1 5.9 5.7
Canada 375 680 12.5 6.3 6.2 6.1
Belgium 115 638† 11.4† 7.9 7.6 6.1
United Kingdom 732 049† 12.5† 6.3 6.2 6.2
Italy 521 346† 9.1† 7.2 6.6 6.2
Ireland 48 530† 13.5† 6.0 5.9 6.4
New Zealand 57 795† 16.3† 7.2 — 6.7
United States 3 914 953 14.8 8.4 8.0 7.6
Greece 101 500 9.7 8.5 7.9 7.9
* Rate reported is for 1996; no 1995 rate was located. † Figures are for 1995.
known. Nevertheless, even if reporting conventions were similar, it is likely that the US rate would still remain higher than the rate for many other countries because of the high percentage of LBW, particularly VLBW, births that occur in this country relative to other developed countries.34,38
DEATHS
There were an estimated 2 322 265 deaths in the United States in 1996 (Table 1), 0.4% higher than the number for 1995 and the highest number ever re-ported. The preliminary death rate for 1996, how-ever, was 875.4 deaths per 100 000 population, slightly lower than the final 1995 rate of 880.0. The
preliminary age-adjusted death rate for 1996 was 493.6 deaths per 100 000 US standard population.2
This rate was 2% lower than the final 1995 age-adjusted death rate of 503.9 and was a record low for the United States.18Age-adjusted death rates are
bet-ter indicators than crude death rates for showing changes in mortality risk over time, because they control for variations in the age composition of the population.
Expectation of Life
The expectation of life at birth for a given year represents the average number of years that a group of infants would be expected to live if, throughout
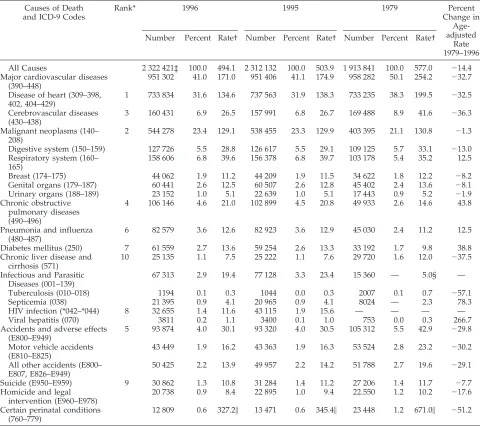
TABLE 11. Mortality From Selected Causes of Death: United States, 1979, 1995, and 1996 Causes of Death
and ICD-9 Codes
Rank* 1996 1995 1979 Percent
Change in Age-adjusted
Rate 1979–1996 Number Percent Rate† Number Percent Rate† Number Percent Rate†
All Causes 2 322 421‡ 100.0 494.1 2 312 132 100.0 503.9 1 913 841 100.0 577.0 214.4 Major cardiovascular diseases
(390–448)
951 302 41.0 171.0 951 406 41.1 174.9 958 282 50.1 254.2 232.7
Disease of heart (309–398, 402, 404–429)
1 733 834 31.6 134.6 737 563 31.9 138.3 733 235 38.3 199.5 232.5
Cerebrovascular diseases (430–438)
3 160 431 6.9 26.5 157 991 6.8 26.7 169 488 8.9 41.6 236.3
Malignant neoplasms (140– 208)
2 544 278 23.4 129.1 538 455 23.3 129.9 403 395 21.1 130.8 21.3
Digestive system (150–159) 127 726 5.5 28.8 126 617 5.5 29.1 109 125 5.7 33.1 213.0 Respiratory system (160–
165)
158 606 6.8 39.6 156 378 6.8 39.7 103 178 5.4 35.2 12.5
Breast (174–175) 44 062 1.9 11.2 44 209 1.9 11.5 34 622 1.8 12.2 28.2
Genital organs (179–187) 60 441 2.6 12.5 60 507 2.6 12.8 45 402 2.4 13.6 28.1 Urinary organs (188–189) 23 152 1.0 5.1 22 639 1.0 5.1 17 443 0.9 5.2 21.9 Chronic obstructive
pulmonary diseases (490–496)
4 106 146 4.6 21.0 102 899 4.5 20.8 49 933 2.6 14.6 43.8
Pneumonia and influenza (480–487)
6 82 579 3.6 12.6 82 923 3.6 12.9 45 030 2.4 11.2 12.5
Diabetes mellitus (250) 7 61 559 2.7 13.6 59 254 2.6 13.3 33 192 1.7 9.8 38.8 Chronic liver disease and
cirrhosis (571)
10 25 135 1.1 7.5 25 222 1.1 7.6 29 720 1.6 12.0 237.5
Infectious and Parasitic Diseases (001–139)
67 313 2.9 19.4 77 128 3.3 23.4 15 360 — 5.0§ —
Tuberculosis (010–018) 1194 0.1 0.3 1044 0.0 0.3 2007 0.1 0.7 257.1
Septicemia (038) 21 395 0.9 4.1 20 965 0.9 4.1 8024 — 2.3 78.3
HIV infection (*042–*044) 8 32 655 1.4 11.6 43 115 1.9 15.6 — — — —
Viral hepatitis (070) 3811 0.2 1.1 3400 0.1 1.0 753 0.0 0.3 266.7
Accidents and adverse effects (E800–E949)
5 93 874 4.0 30.1 93 320 4.0 30.5 105 312 5.5 42.9 229.8
Motor vehicle accidents (E810–E825)
43 449 1.9 16.2 43 363 1.9 16.3 53 524 2.8 23.2 230.2
All other accidents (E800– E807, E826–E949)
50 425 2.2 13.9 49 957 2.2 14.2 51 788 2.7 19.6 229.1
Suicide (E950–E959) 9 30 862 1.3 10.8 31 284 1.4 11.2 27 206 1.4 11.7 27.7 Homicide and legal
intervention (E960–E978)
20 738 0.9 8.4 22 895 1.0 9.4 22.550 1.2 10.2 217.6
Certain perinatal conditions (760–779)
12 809 0.6 327.2\ 13 471 0.6 345.4\ 23 448 1.2 671.0\ 251.2
Note: 1996 data are preliminary; 1995 and 1979 data are final.
* Rank based on 1996 data. For an explanation of ranking procedures, see Technical Appendix in Vital Statistics of the United States. II. Mortality. Pt A (published annually).
† Age-adjusted death rate per 100 000 US standard population.
‡ Two separate sets of weights were applied to mortality records: one for demographic and one for cause-of-death data, resulting in slight inconsistencies in the number of deaths between Tables I and II.
§ Excludes HIV infection.
\Because deaths from this cause occur primarily among infants, infant mortality rates attributable to this cause are shown. —, Comparable data not available for this period.
their lifetime, they were to experience the age-spe-cific death rates prevailing during the year of their birth. Based on preliminary data for 1996, the expec-tation of life at birth reached a new record high of 76.1 years, an increase of 0.3 years from the previous year. In 1996, life expectancy at birth was 73.8 years for white males, 79.6 years for white females, 66.1 years for black males, and 74.2 years for black fe-males. Life expectancy increased from the previous year by 0.9 year for black males, 0.4 year for white males, and 0.3 year for black females. Life expectancy for white females did not change from 1995.
Causes of Death
The 10 leading causes of death accounted for 81% of all deaths in the United States in 1996 (Table 11). Although their order has varied somewhat, these causes have generally been the same since 1984. Age-adjusted death rates were lower in 1996 than in 1995 for HIV infection, diseases of the heart, malignant neoplasms (cancer), cerebrovascular diseases, acci-dents and adverse effects (including deaths attribut-able to motor vehicles), chronic liver disease and cirrhosis, and suicide. Age-adjusted rates have in-creased since 1979 for a few leading causes of death. Including a 44% increase in deaths attributable to chronic obstructive pulmonary diseases, a 39% in-crease for diabetes mellitus, and a 12.5% inin-crease for pneumonia and influenza.
HIV Infection and Other Infectious Diseases
In 1987, a special cause-of-death category was cre-ated to uniquely classify deaths attributable to HIV infection.39From 1987 to 1994, the age-adjusted death
rate for HIV infection nearly tripled from 5.5 to 15.4. Between 1994 and 1995, there was a leveling off of this steep upward trend,18and between 1995 to 1996,
the age-adjusted death rate for HIV infection showed a sharp 26% decline from 15.6 to 11.6. This marks the first year that there has been a decline in HIV mor-tality and indicates significant progress in the battle against this deadly disease.
Although they account for a relatively small per-centage of all deaths (2.9% in 1996), the number of deaths attributable to infectious diseases has in-creased substantially since 1979. Although a large proportion of this increase since 1987 is attributable to increases in HIV infection, increases in other in-fectious diseases also contributed. In particular, the age-adjusted death rate for septicemia increased by 78.3% from 1979 to 1996, and the rate for viral hep-atitis more than tripled during the same period.
Homicide
The age-adjusted death rate for homicide and legal intervention declined by 11% from 9.4 in 1995 to 8.4 in 1996, marking a 23% decline since 1991. These declines are particularly noteworthy for the male population, for which mortality declined by 10% be-tween 1995 and 1996 and by 21% since 1991.
Deaths Among Children
In 1996, an estimated 29 183 children and adoles-cents between 1 and 19 years died in the United
States based on preliminary data (Table 12). The death rate for children 1 to 4 years old in 1996 was 38.3 per 100 000 population, 6% lower than the rate of 40.6 in 1995. The respective death rates for chil-dren and teens also declined by 5%, from 25.5 in 1995 to 24.3 in 1996 and from 83.5 in 1995 to 79.2 in 1996. However, for children 5 to 9 years of age, the death rate rose slightly from 19.7 in 1995 to 19.8 in 1996, an increase that was not statistically significant. Since 1979, death rates have declined by 40% for children 1 to 4 years old, by 36% for children 5 to 9 years old, by 24% for children 10 to 14 years old, and by 20% for teens 15 to 19 years of age.
Although childhood mortality has declined substan-tially, a large proportion of these deaths continue to occur as a result of preventable injuries.40Deaths
attrib-utable to accidents (unintentional injury), homicide, and suicide comprised the majority (63%) of all child-hood deaths based on preliminary data from 1996. The leading cause of death in 1996 among children in all age groups is unintentional injury.
For children 1 to 4 years of age, unintentional injuries accounted for 36% of all deaths; injuries re-lated to motor vehicles, drowning, and fire and burns were the most common and together ac-counted for 79% of all unintentional injury deaths in the age group. Since 1979, unintentional injury deaths have declined by 48% in this age group. An estimated 395 children 1 to 4 years old died from homicide, making homicide the fourth leading cause of death in this age group. Death rates for homicide increased for this age group between 1979 and 1994, but they have dropped 13% since 1994.
For children 5 to 9 years old, unintentional injuries accounted for nearly 43% of all deaths in 1996. The injury deaths occurring in this age group were pri-marily attributable to motor vehicles (including pe-destrian and bicycle-related), drowning, and fire and burns, accounting for 82% of all unintentional injury and 35% of total deaths. The death rate attributable to unintentional injuries for children 5 to 9 years old has declined by nearly 50% from 16.4 in 1979 to 8.5 in 1996. Homicide was the fourth leading cause of death among 5- to 9-year-old children and account for nearly 5% of all deaths.
Unintentional injuries represented 41% of all deaths to children 10 to 14 years of age in 1996. Motor vehicles (including pedestrian and bicycle-related) accounted for 58% of all unintentional inju-ries and nearly 25% of all deaths in this age group. The death rate attributable to unintentional injuries for these children has declined by 40% since 1979. Homicide was the third leading cause of death for children 10 to 14 years of age. Although the death rate for homicide in this age group increased by 50% since 1979, it decreased by 14% from 1995 to 1996. The death rate for firearm-related homicide more than doubled between 1979 and 1996, but has also decreased by 19% since 1995. Suicide was the fourth leading cause of death among 10- to 14-year-old children, accounting for an estimated 300 deaths in 1996. The suicide rate in this age group doubled from 0.8 in 1979 to 1.6 in 1996.
inju-ries accounted for 46% of all deaths in 1996, and 79% of these deaths occurred as the result of motor vehi-cles (including pedestrian and bicycle-related). The unintentional injury death rate for teens has dropped by almost 40% since 1979. Homicide was the second leading cause of death among teens 15 to 19 years of
age, accounting for 20% of all deaths. An estimated 2888 teens were victims of homicide in 1996. The teen homicide rate increased by 51% from 1979 to 1996, but decreased 15% between 1995 and 1996. A total of 85% of all teen deaths attributable to homicide were firearm-related. An estimated, 1801 teens 15 to 19
TABLE 12. Deaths and Death Rates for the Five Leading Causes of Childhood Death in Specified Age Groups in 1996: United States, 1979, 1995, and 1996
Cause of Death and Age Rank* 1996 1995 1979 Percent
Change 1979–1996 Number Percent Rate† Number Percent Rate† Number Percent Rate†
1–4 years
All causes — 5947 100.0 38.3 6393 100.0 40.6 8108 100.0 64.2 240.3
Accidents and adverse effects (E800–E949) 1 2155 36.2 13.9 2280 35.7 14.5 3349 41.3 26.5 247.5 Motor vehicle accidents (E810–E825) — 834 14.0 5.4 825 12.9 5.2 1239 15.3 9.8 242.9
Pedestrian (E810–E825:.7) — 348 5.9 2.2 341 5.3 2.2 676 8.3 5.3 258.5
Bicycle (E810–E825:.6) — 7 0.1 * 10 0.2 * 16 0.2 *
All other accidents (E800–E807, E826–E829) — 1321 22.2 8.5 1455 22.8 9.2 2110 26.0 16.7 249.4 Congenital anomalies (740–759) 2 633 10.6 4.1 695 10.9 4.4 1021 12.6 8.1 249.4 Malignant neoplasms (140–208) 3 440 7.4 2.8 488 7.6 3.1 578 7.1 4.6 239.1 Homicide and legal intervention
(E960–E978)
4 395 6.6 2.6 452 7.1 2.9 314 3.9 2.5 4.0
Firearm related (E965.0–E965.4; E970) — 62 1.0 0.4 74 1.2 0.5 42 0.5 0.3 33.3 Diseases of heart (390–398, 402, 404–429) 5 207 3.5 1.3 251 3.9 1.6 265 3.3 2.1 238.1 5–9 years
All causes — 3858 100.0 19.8 3780 100.0 19.7 5278 100.0 31.1 236.3
Accidents and adverse effects (E800–E949) 1 1652 42.8 8.5 1612 42.6 8.4 2707 51.3 16.0 246.9 Motor vehicle accidents (E810–E825) — 909 23.6 4.7 907 24.0 4.7 1445 27.4 8.5 247.7
Pedestrian (E810–E825:.7) — 295 7.6 1.5 307 8.1 1.6 742 14.1 4.4 265.9
Bicycle (E810–E825:.6) — 91 2.4 0.5 100 2.6 0.5 167 3.2 1.0 250.0
All other accidents (E800–E807, E826–E829) — 742 19.2 3.8 705 18.7 3.7 1262 23.9 7.4 248.6 Malignant neoplasms (140–208) 2 522 13.5 2.7 523 13.8 2.7 791 15.0 4.7 242.6 Congenital anomalies (740–759) 3 245 6.4 1.3 242 6.4 1.3 289 5.5 1.7 223.5 Homicide and legal intervention
(E960–E978)
4 174 4.5 0.9 157 4.2 0.8 165 3.1 1.0 210.0
Firearm related (E965.0–E965.4; E970) — 65 1.7 0.3 70 1.9 0.4 67 1.3 0.4 225.0 Diseases of heart (390–398, 402, 404–429) 5 126 3.3 0.7 130 3.4 0.7 119 2.3 0.7 — 10–14 years
All causes — 4607 100.0 24.3 4816 100.0 25.5 5868 100.0 31.8 223.6
Accidents and adverse effects (E800–E949) 1 1870 40.6 9.9 1932 40.1 10.2 2982 50.8 16.2 238.9 Motor vehicle accidents (E810–E825) — 1093 23.7 5.8 1148 23.8 6.1 1507 25.7 8.2 229.3
Pedestrian (E810–E825:.7) — 230 5.0 1.2 272 5.6 1.4 389 6.6 2.1 242.9
Bicycle (E810–E825:.6) — 121 2.6 0.6 127 2.6 0.7 270 4.6 1.5 260.0
All other accidents (E800–E807, E826–E829) — 777 16.9 4.1 784 16.3 4.1 1475 25.1 8.0 248.8 Malignant neoplasms (140–208) 2 513 11.1 2.7 503 10.4 2.7 761 13.0 4.1 234.1 Homicide and legal intervention
(E960–E978)
3 339 7.4 1.8 405 8.4 2.1 229‡ 3.9 1.2 50.0
Firearm related (E965.0–E965.4; E970) — 250 5.4 1.3 311 6.5 1.6 119 2.0 0.6 116.7
Suicide (E950–E959) 4 300 6.5 1.6 330 6.9 1.7 151 2.6 0.8 100.0
Firearm related (E955.0–E955.4) — 159 3.5 0.8 183 3.8 1.0 84 1.4 0.5 60.0
Diseases of heart (390–398, 402, 404–429) 5 215 4.7 1.1 164§ 3.4 0.9 170 2.9 0.9 22.2 15–19 years
All causes — 14 771 100.0 79.2 15 089 100.0 83.5 21 085 100.0 98.8 219.8
Accidents and adverse effects (E800–E949) 1 6846 46.3 36.7 6623 43.9 36.7 12 689 60.2 59.4 238.2 Motor vehicle accidents (E810–E825) — 5386 36.5 28.9 5168 34.3 28.6 9519 45.1 44.6 235.2
Pedestrian (E810–E825:.7) — 293 2.0 1.6 321 2.1 1.8 799 3.8 3.7 256.8
Bicycle (E810–E825:6) — 67 0.5 0.4 63 0.4 0.3 152 0.7 0.7 242.9
All other accidents (E800–E807, E826–E829) — 1460 9.9 7.8 1455 9.6 8.1 3170 15.0 14.8 247.8 Homicide and legal intervention
(E960–E978)
2 2888 19.6 15.5 3292 21.8 18.2 2191 10.4 10.3 50.5
Firearm related (E965.0–E965.4; E970) — 2461 16.7 13.2 2817 18.7 15.6 1416 6.7 6.9 91.3
Suicide (E950–E959) 3 1801 12.2 9.7 1890 12.5 10.5 1788 8.5 8.4 15.5
Firearm related (E965.0–E965.4; E970) — 1148 7.8 6.2 1266 8.4 7.0 1136 5.4 5.3 17.0 Malignant neoplasms (140–208) 4 683 4.6 3.7 691 4.6 3.8 1141 5.4 5.3 230.2 Diseases of heart (390–398, 402, 404–429) 5 384 2.6 2.1 399 2.6 2.2 395 1.9 1.9 10.5
* Rank based on number of deaths.
† Rate per 100 000 population in specified group.
‡ In 1979, congenital anomalies was the third leading cause of death for children 10 –14 years old, with a total of 289 deaths and a death rate of 1.6. Homicide was ranked the fourth, suicide sixth, and diseases of the heart fifth.
§ In 1995, congenital anomalies was the fifth leading cause of death for children 10 –14 years old, with a total of 207 deaths and a death rate of 1.1; diseases of heart was ranked sixth.
years of age committed suicide in 1996. Suicide was the third leading cause of death in this age group and accounted for 12% of all deaths.
In summary, unintentional injury mortality for chil-dren and teenagers has dropped substantially (nearly 50%) since 1979. These declines are at least in part attributable to injury prevention measures such as mandatory car seat requirements and smoke alarms and sprinkler systems in homes and schools.41
Never-theless, despite current efforts, unintentional injuries continue to be the leading cause of death for children of all ages. Additional prevention efforts are still needed. In contrast, although some decline occurred be-tween 1995 and 1996, homicide and suicide mortality overall and that attributable to firearms, have gener-ally increased since 1979, particularly for children 10 to 14 years old and teens 15 to 19 years old. Hope-fully, the more recent declines in homicide and sui-cide signal the beginning of a long-term reversal in homicide and suicide mortality among children.
ACKNOWLEDGMENTS
We thank Jean Sack, Librarian, Department of Population Dynam-ics, Johns Hopkins School of Public Health; and Gareth Jones of the Information Office at UNICEF, New York, for the international data on infant mortality. We also thank Tom Dunn for content review; and Stephanie Ventura and Mary Anne Freedman, the Director of the Division of Vital Statistics, NCHS, for supporting this effort and reviewing the manuscript. Finally, we thank Becky Newcomer for her administrative support and preparation of the manuscript.
REFERENCES
1. Guyer B, Strobino DM, Ventura SJ, MacDorman M, Martin JA. Annual Summary of Vital Statistics—1995.Pediatrics. 1996;98:1007–1019 2. Ventura SJ, Peters KD, Martin JA, Maurer JD.Births and Deaths: United
States, 1996. Monthly vital statistics report. Vol 46, No 1, Suppl 2. Hyattsville, MD: National Center for Health Statistics; 1997
3. National Center for Health Statistics. Linked Birth/Infant Death Data Set—1995 Period Data. Hyattsville, MD: Public Use Data Tape Documentation; September 1997
4. National Center for Health Statistics.Births, Marriages, Divorces, and Deaths for 1996. Monthly vital statistics report. Vol 45, No 12. Hyatts-ville, MD: US Public Health Service; 1997
5. Ventura SJ, Martin JA, Curtin SC, Mathews TJ.Report of Final Natality Statistics 1995. Monthly vital statistics report. Vol 45, No 11, Suppl. Hyattsville, MD: National Center for Health Statistics; 1997
6. Deardorff KE, Montgomery P, Hollmann FW.U.S. Population Estimates by Age, Sex, Race, and Hispanic Origin: 1990 to 1995. Washington, DC: US Bureau of the Census, PPL-41; 1996
7. Deardorff KE, Hollmann FW. U.S.Population Estimates by Age, Sex, Race, and Hispanic Origin: 1990 to 1996. Washington, DC: US Bureau of the Census, PPL-57; 1997
8. Centers for Disease Control and Prevention. State-specific birth rates for teenagers—United States.MMWR.1997;46:837– 842
9. Kleinman JC, Madans JH. The effects of maternal smoking, physical stature, and educational attainment on the incidence of low birthweight.
Am J Epidemiol. 1985;121:843– 855
10. Strobino D, O’Campo P, Schoendorf K, et al. A strategic framework for infant mortality reduction: implementing “healthy start.” Milbank Q. 1995;73:507–533
11. Curtin Sally.Rates of Cesarean Birth and Vaginal Birth After Previous Cesarean, 1991–95. Monthly vital statistics report. Vol 45, No 11, Suppl 3. Hyattsville, MD: National Center for Health Statistics; 1997
12. Centers for Disease Control and Prevention. State-specific variation in rates of twin births—United States, 1992–1994.MMWR.1997;46:121–125 13. Martin JA, MacDorman MF, Mathews TJ. Triplet and other higher-order multiple births, trends and outcomes, 1971–1994. National Center for Health Statistics.Vital Health Stat.1997;57:21
14. Wilcox LS, Kiely JL, Melvin CL, Martin MC. Assisted reproductive technologies: estimates of their contribution to multiple births and newborn hospital days in the United States.Fertil Steril. 1996;65:361–366 15. Keith LG, Papiernik E, Keith DM, Luke B, eds.Multiple Pregnancy:
Epidemiology, Gestation, and Perinatal Outcome. New York, NY: Parthenon Publishing Group; 1995
16. Geronimus A, Korenman S. Maternal youth or family background? On the health disadvantages of infants with teenage mothers.Am J Epide-miol.1993;134:213–225
17. Strobino DM, Ensminger ME, Kim YJ, Nanda J. Mechanisms for mater-nal age differences in birth weight.Am J Epidemiol.1995;142:504 –514 18. Anderson RN, Kochanek KD, Murphy SL.Report of Final Mortality
Statistics, 1995. Monthly vital statistics report. Vol 45, No 11, Supple-ment 2; 1997
19. National Center for Health Statistics.Vital Statistics of the United States. II. Mortality, Pt A. Washington, DC: US Public Health Service 20. Blackmore CA, Ferre CD, Rowley DL, Hogue CJ, Gaiter J, Atrash H. Is
race a risk factor or a risk marker for preterm delivery?Ethnicity Dis.
1993;3:372–377
21. Goldenberg RL, Klebanoff MA, Nugent R, Krohn MA, Hillier S, Andrews WW. Bacterial colonization of the vagina during pregnancy in four ethnic groups.Am J Obstet Gynecol.1996;174:1618 –1621 22. Kleinman JC, Fowler MG, Kessel SS. Comparison of infant mortality
among twins and singletons: United States, 1960 and 1983.Am J Epide-miol. 1991;133:133–143
23. Iyasu S, Rowley DL, Becerra JE, Hogue CJ. Impact of very low birthweight on the black–white infant mortality gap.Am J Prev Med. 1992;8:271–277 24. Overpeck MD, Moss AJ, Hoffman HJ, Hendershot GE. A comparison of
the childhood health status of normal birth weight and low birth weight infants.Public Health Rep.1989;104:58 –70
25. Stanley FJ. Survival and cerebral palsy in low birth weight infants: implications for perinatal care.Paediatr Perinat Epidemiol.1992;6:298 –310 26. Roussounis SH, Hobley PA, Dear PR. Five year follow-up of very low birth weight infants: neurological and psychological outcome. Child Care Health Dev.1993;19:426 – 434
27. World Health Organization.Manual of the International Statistical Classi-fication of Diseases, Injuries and Causes of Death, Based on the Recommen-dations of the Ninth Revision Conference: 1975. Geneva, Switzerland: World Health Organization; 1977
28. American Academy of Pediatrics, Task Force on Infant Positioning and SIDS. Positioning and SIDS.Pediatrics. 1992;87:1120 –1126
29. Willinger M, Hoffman HJ, Hartford RB. Infant sleep position and risk for sudden infant death syndrome.Pediatrics. 1994;93:814 – 819 30. Gibson E, Cullen JA, Spinner S, Rankin K, Spitzer A. Infant sleep
position following new AAP guidelines.Pediatrics. 1995;96:69 –72 31. Schwartz RM, Luby AM, Scanlon JW, Kellogg RJ. Effect of surfactant on
morbidity, mortality, and resource use in newborn infants weighing 500 to 1500 g.N Engl J Med.1994;330:1476 –1480
32. Hamvas A, Wise PH, Yang RK, et al. The influence of the wider use of surfactant therapy on neonatal mortality among blacks and whites.
N Engl J Med.1996;334:1635–1640
33. Modanlou HD, Beharry K, Padilla G, Iriye B. Combined effects of antenatal corticosteroids and surfactant supplementation on the out-come of very low birth weight infants.J Perinatol.1996;16:421– 428 34. Liu K, Moon M, Sulvetta M, Chawala J. International infant mortality
rankings: a look behind the numbers.Health Care Financing Rev.1992; 13:4105– 4118
35. Sepkowitz S. International rankings of infant mortality and the United States’ Vital Statistics Natality Data Collecting System—failures and success.Int J Epidemiol. 1995;24:3583–3588
36. Haub C, Yanagishita M. Infant mortality: who’s number one?Popul Today. 1991;19:36 –38
37. Fenton AL, Field DJ, Mason E, et al. Attitudes to viability of preterm infants and their effect on figures for perinatal mortality.Br Med J.
1990;300:434 – 436
38. Guyer B, Wallach LA, Rosen SL. Birth-weight-standardized neonatal mortality rates and the prevention of low birth weight: how does Massachusetts compare to Sweden?N Engl J Med.1982;306:1230 –1233 39. National Center for Health Statistics. Technical Appendix. In:Vital Statistics of the United States, 1987. Vol II. Mortality, Pt A.Washington, DC: US Public Health Service
40. Rivara FP, Grossman DC. Prevention of traumatic deaths to children in the United States: how far have we come and where do we need to go?
Pediatrics.1996;97:791–797
41. American Academy of Pediatrics, Committee on Injury and Poison Prevention. Efforts to reduce the toll of injuries in childhood require expanded research.Pediatrics.1996;97:765–768
42. Deardorff KE, Hollmann FW, Montgomery P.U.S. Population Estimates by Age, Sex, Race, and Hispanic Origin: 1990 to 1994.Washington, DC: US Bureau of the Census, PPL-21; 1995
DOI: 10.1542/peds.100.6.905
1997;100;905
Pediatrics
Donna M. Strobino
Bernard Guyer, Joyce A. Martin, Marian F. MacDorman, Robert N. Anderson and
1996
−−
Annual Summary of Vital Statistics
Services
Updated Information &
http://pediatrics.aappublications.org/content/100/6/905 including high resolution figures, can be found at:
References
http://pediatrics.aappublications.org/content/100/6/905#BIBL This article cites 30 articles, 7 of which you can access for free at:
Subspecialty Collections
_management_sub
http://www.aappublications.org/cgi/collection/administration:practice
Administration/Practice Management
following collection(s):
This article, along with others on similar topics, appears in the
Permissions & Licensing
http://www.aappublications.org/site/misc/Permissions.xhtml in its entirety can be found online at:
Information about reproducing this article in parts (figures, tables) or
Reprints
DOI: 10.1542/peds.100.6.905
1997;100;905
Pediatrics
Donna M. Strobino
Bernard Guyer, Joyce A. Martin, Marian F. MacDorman, Robert N. Anderson and
1996
−−
Annual Summary of Vital Statistics
http://pediatrics.aappublications.org/content/100/6/905
located on the World Wide Web at:
The online version of this article, along with updated information and services, is
by the American Academy of Pediatrics. All rights reserved. Print ISSN: 1073-0397.