Research on Automatic Identification Technique
of CT Image in Lung
Zhijie Zhao1,2, Cong Ren1,2, Huadong Sun1,2, Zhipeng Fan1,2, and
Ze Gao1,2
1 School of Computer and Information Engineering, Harbin University of Commerce, Harbin, 150028, China,
[email protected], [email protected], [email protected], [email protected], [email protected]
2 Key Laboratory of Electronic Commerce and Information Processing of Heilongjiang Province
Abstract. Lung cancer has become the world's human cancer disease in the "first killer." In this paper, three aspects of lung CT images were treated. Firstly, based on the CT image preprocessing, the lung parenchyma was segmented by random walk algorithm and the ROI was extracted from the pulmonary parenchyma; Secondly, the 10-dimensional feature vectors of pulmonary nodule ROI were extracted by the gray level co-occurrence matrix algorithm; Finally, support vector machine as a classifier is to identify the pulmonary nodules and the accuracy rate is more than 94%. The experimental results show that the study of automatic CT image recognition can provide some data reference for doctors and play a supporting role in the course of treatment.
Keywords: CT image, image segmentation, ROI extraction, feature extraction, support vector machine.
1.
Introduction
According to the survey research shows that cancer has become a major problem affecting human health in the world. Among all types of cancer, lung cancer mortality is higher than other types of cancer mortality. The 2015 global cancer statistics [1] was published in journal of the CA on February 4, 2015. It is expected that in 2012, about 820 million patients worldwide died of cancer, and 14.1 million new cases were found in cancer cases, and there are more cancer patients and cancer deaths in developing countries than in developed countries. At present, lung cancer is the leading cause of death in male patients. In recent years, due to the extreme pollution of the city, a substantial increase in smoking population, lung cancer early difficult to be found by doctors and late difficult to be cured and other factors, the incidence of lung cancer in the population is increasing year by year.
characteristics, but also fast to deteriorate; (2) because the early symptoms of lung cancer are not very significant, it is easy to not be found that more than 80% of the sick people have been diagnosed with the condition of the disease in the advanced stage of lung cancer; (3) the current imaging diagnosis relies mainly on the completion of manual reading, however, the increasing image data also poses a great challenge to manual reading. In order to provide effective diagnostic information for doctors, intelligent image processing technology is becoming more and more important [3-5]. Computer aided diagnosis, which is based on machine learning and image processing technology, has gradually become a hotspot in the field of medicine [6]. Computer aided diagnosis based on machine learning mainly includes four aspects: image preprocessing; image segmentation and region of interest (ROI) extraction; feature extraction; selection and classification.
At present, the study of automatic CT images in the lungs has been paid more and more attention. The method of artificial intelligence to identify pulmonary nodules has played a vital role in the medical field. The 96 shape features were extracted by Kim B. C., Yu S. S. and Suk H. I. [7], including the standard deviation, perimeter, circle diameter, area of malignant nodules and benign nodules. The shape feature extracted from the region of interest form a matrix, and classified by SVM. The accuracy rate is 95.5% and the specificity is 94.4%. The 200 depth features extracted from the LIDC database in a 5-layer denoising encoder were extracted by Kumar D., Wong A. and Clausi D. A. [8], which was divided into benign pulmonary nodules and malignant pulmonary nodules using decision trees, the average accuracy and sensitivity were 75.01% and 83.35%. Ashis Kumar Dhara, Anirvan Dutta and Sudipta Mukhopadhyay et al. [9] proposed an effective classification program to distinguish between benign and malignant pulmonary nodules, which are classified by shape, edge and texture to assist radiologists Diagnosis of lung cancer and improve the accuracy of classification.
2.
Segmentation of Pulmonary Parenchyma in CT Images Based on
Random Walk Algorithm
2.1. Selection of Seed Spots
In the random walk algorithm [11], the selection of seed points is of the utmost importance. In this experiment, we set the seed point as follows: one class called foreground seed, it refers to the seed point labeled in the pulmonary parenchyma; the other class is called the background seed point, it refers to all the areas except the pulmonary parenchyma , Including the heart, trachea, thorax and background areas. This method of using the artificial interaction of lung CT images of the pulmonary parenchyma segmentation method solves the complex problem of segmentation, and improves the accuracy of the segmentation.
Seed points of interactive setting and usage method:
① Setting the foreground seed color is blue, the background seed color is red;
②The left mouse button clicked is selected as the seed point of the selected
foreground, the right key clicked is the seed point of the selected background, and any other key clicked is selected as the end seed point, and the subsequent program is run;
③ The position of foreground seed point was 1, and the position of background seed
point was 0;
④ For the edge depression and the accuracy of segmentation, it is necessary to set the
seed points several times.
2.2. Calculation of Foreground Probability
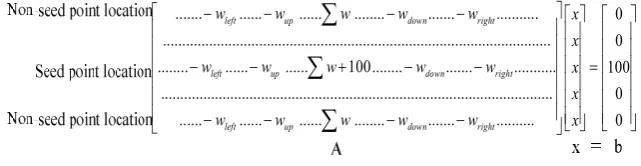
U Onoma D P, Ruan S, Gardin I, et al. [12] studied the 3D random walk based segmentation for lung tumor delineation in PET image. The idea of random walk algorithm, proposed by Grady L [13], is that the probability of each point is the weighted average of the corresponding probability of the surrounding four
neighborhoods. The calculation process is shown in Fig.1: that is, for any point i,
Probability is p(i), wleft is the weight between i point and its left neighborhood point, and
p(i)left is the foreground probability of the left neighborhood of point i, that is (wleft + wup
+ wright + wdown) p(i) = wleft p(i)left + wup p(i)up + wright p(i)right + wdown p(i)down. Where wleft is
equal toeIiIleft so each point is the foreground probability: X=A\b
... ... ... ... ... ... ... ... ... ...
left up down right
left up
w w w w w
w w . 100... ... ... ... ... ... ... ... ...
down rightleft up down
w w w
w w w w
0 0 100 0 ... 0
right
x x x x
w x
2.3. Extraction of ROI in Lung
Through the preprocessing of CT images and segmentation of lung parenchyma, CT images have high recognition degree, and the experienced doctors can directly identify lung nodules. As the complex shape of the pulmonary nodules, texture features and other factors, so the early pulmonary nodules are difficult to be detected by doctors, there will be misdiagnosis and missed diagnosis of the phenomenon. Therefore, it is necessary to further analyze and deal with the lung parenchyma segmented.
Extraction of ROI from the lung parenchyma can make a more accurate judgment of the pulmonary nodules. The method of extracting ROI by artificial method is used to process the samples of lung parenchyma segmented, which reduces the computational complexity of the ROI texture feature, and the normalized pixel of the region of interest is 128 × 128.
3.
Texture Feature Extraction of CT Image in Lung Based on Gray
Level Co-occurrence Matrix
P Yang et al. [14] used gray co-occurrence matrix to extract features. The paper based on the gray level co-occurrence matrix algorithm analyzes the texture feature of ROI of lung CT images, the basic idea: the first the ROI extracted from lung parenchyma above is determined, and then a gray level co-occurrence matrix which has various gray level distribution information is established, and finally the texture feature parameters based on the matrix is extracted. Experimental results show that the algorithm is fast and effective.
3.1. Texture Features of Gray Level Co-occurrence Matrix
Walaa [15] studied content based medical image retrieval with texture content using gray level occurrence matrix and K-means clustering algorithms. The gray level co-occurrence matrix reflects the information of the image gray level distribution, which includes the synthetic of direction, local field and amplitude of variation. It refers to the
probability of the occurrence of pixels with gray values g1 and g2 in the direction of with
a distance of d, and the probability is denoted as P(g1, g2, d, θ).The elements in the
co-occurrence matrix P[16, 17] are defined as formulas (1):
1 2
1 1
2 2
1 1
1
2 2
2
# , , , | , & , , ; ,
#
x y x y S f x y g f x y g
P g g d
S
(1)
Where g1 and g2 are gray values and S is the sum of the pixel pairs.
We can see from formula (1) that theP is normalized, in which the total number of
pairs of pixels on the numerator is composed of pixel pairs with gray values g1 and
g2From the definition of the gray level co-occurrence matrix, there are four main
variables affecting the computational complexity, N is the size of the image, L is the
Angular Second Moment W1
1 2
2
1 1, 2; ,
g g
W
P g g d (2)The Angular Second Moment [15, 18-19] reflects the uniformity and smoothness of
the image distribution. When all P(g1, g2, d, θ) are equal or concentrated in the vicinity
of the main diagonal, W1 reaches the minimum, and the image is the smoothest.
Contrast W2
1 2
2
2 1 2 1, 2; ,
g g
W
g g P g g d (3)The Contrast [15, 18-19] reflects the amount of change in the local gray scale of the image, that is, the clarity of the image. When the small values in P(g1, g2, d, θ) are
mainly concentrated in the vicinity of the main diagonal of the matrix, the larger the
value of W2 is, the greater the contrast of the pixels in the image is.
Inverse Difference Moment W3
1 2 1 2 3 2 1 2 , ; , 1 g gP g g d
W
g g
(4)The uniformity can be regarded as the reciprocal of the Contrast to a certain extent.
The closer the elements in the co-occurrence matrix P(g1, g2, d, θ )are, the more similar
they are, and the value of W3 becomes larger and larger.
Entropy W4
1 2
4 1, 2; , lg 1, 2; ,
g g
W
P g g d P g g d (5)The Entropy [15, 18-21] reflects the inhomogeneity of texture, and if the probability of gray pairs between the pairs of pixels in the co-occurrence matrix is the same, then the entropy reaches the maximum.
Correlation W5
1 2
1 2 1 2
5
, ; , x y
g g
x y
g g P g g d W
(6)Where
x,
y,
x,
yare defined as:
1 2
1 1, 2: , x
g g
g P g g d
(7)
2 1
2 1, 2: ,
y
g g
g P g g d
(8)
1 2
2 2
1 1, 2: ,
x x
g g
g P g g d
(9)
2 1
2 2
2 1, 2: ,
y y
g g
g P g g d
(10)3.2. Analysis and Extraction of CT Image Texture Features in Lung
We know that there are four main variables affecting the computational complexity in
the gray level co-occurrence matrix algorithm, namely, image size N, gray level L,
distance d and direction θ. This algorithm analyzes the texture features of pulmonary
nodules in lung CT images, and the following four variables are analyzed as follows.
Selection of image size N: The image is too small will lose part of the texture
information, the image is too large to lead to storage and calculation is too large. In this paper, the size of the region of interest is set to N = 128 × 128, and then the ROI region is transformed by some algorithm and the gray level of the region of interest is reduced to L = 16.
Selection of distance d: In the rough texture, the gray level co-occurrence matrix
algorithm changes slowly under the influence of distance; in fine texture, the gray level co-occurrence matrix algorithm changes faster under the influence of distance. Experiments show that the distance d = 1 will get better results.
Selection of direction θ: The texture of the image has certain directionality, and the
texture information of different co-occurrence matrix generated by different images is also different. A large number of experiments show that some texture information is incomplete, mainly because of the loss or abandonment of a direction of texture information, and generally use 0°, 45°, 90° and 135° directions to calculate the eigenvalues.
In this paper, based on the gray level co-occurrence matrix, the feature of the region of interest in the lung CT image is extracted. The extraction process is as follows:
① Read the region of interest;
② The gray level co-occurrence matrix of region of interest in 0°,45°,90° and 135°
directions is calculated and normalized;
③ The normalized values in the direction of 0°, 45°, 90° and 135° are averaged;
④ Ten texture features of the mean and standard deviation of the Angular Second
Moment W1, the mean and standard deviation of the Contrast W2, the mean and standard
deviation of the Inverse Difference Moment W3, the mean and standard deviation of the
Sum of Entropy W4, and the mean and standard deviation of the Correlation W5 are
calculated.
⑤ Save the eigenvalues to the database;
⑥ Calculate the next region of interest and return ①.
4.
Recognition of Pulmonary Nodules Based on SVM
choosing the appropriate kernel function and setting the optimal parameters is an important factor that directly affects the classification result. According to the result of the feature extraction, the linear kernel function is selected as the kernel function.
5.
Experimental Results Analysis
5.1. Experimental Environment and Data
(1) Experimental environment: Matlab R2016b, LibSVM, Windows10 operating system.
(2) Experimental data:
Data source: 200 lung CT images marked by a doctor were used as experimental samples, of which 100 were pulmonary nodules and 100 were normal lungs.
Data preprocessing: because of the noise and artifacts of CT image, the first the image of CT image was denoised and enhanced, and the CT image information became clear and clear; then the size of CT image is normalized to 256 x 256. Finally, the 200 CT images were analyzed for pulmonary parenchyma, ROI extraction, feature extraction and SVM identification.
5.2. CT Image of Pulmonary Parenchymal Segmentation and ROI Extraction
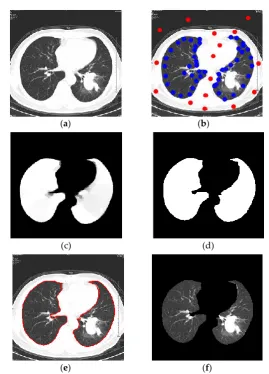
Segmentation of pulmonary parenchyma in CT images is one of the important methods to deal with medical images. In this paper, the pulmonary parenchyma is segmented based on random walk algorithm, and the segmentation process is shown in Fig.2.
(a) (b)
(c) (d)
(e) (f)
Fig. 2. This is pulmonary parenchymal segmentation process. (a) Original image; (b) Selection of seed point; (c) Calculation of foreground probability; (d) Binary segmentation results; (e) Segmentation boundary; (f) Segmentation result
(a)
(b)
Fig. 3. This is partial lung CT images of ROI. (a) Pulmonary nodular CT image; (b) Normal lung CT image
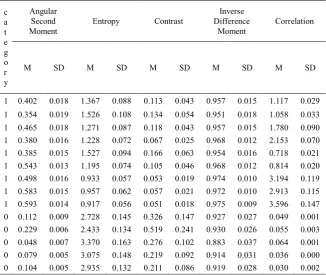
Table 1. This is Partial sample texture feature extraction data (M – mean, SD – standard deviation)
c a t e g o r y
Angular Second Moment
Entropy Contrast
Inverse Difference
Moment
Correlation
M SD M SD M SD M SD M SD
0 0.149 0.010 2.421 0.090 0.228 0.061 0.896 0.024 0.148 0.006 0 0.107 0.005 2.955 0.145 0.251 0.109 0.917 0.030 0.029 0.003 0 0.237 0.011 2.290 0.120 0.270 0.101 0.914 0.027 0.098 0.002 0 0.130 0.010 2.663 0.146 0.361 0.153 0.907 0.031 0.056 0.001 0 0.156 0.006 2.475 0.108 0.131 0.050 0.943 0.021 0.070 0.007
5.3. Analysis of Texture Feature Extraction
The ROI was extracted from the segmented pulmonary parenchyma, and 200 samples with pulmonary nodules and normal lung tissue were obtained. The gray level co-occurrence matrix algorithm was used to extract the texture features of the samples from the pulmonary nodules and the normal lung tissue. Ten eigenvalues were calculated,
which were the mean and standard deviation of the Angular Second Moment W1, the
mean and standard deviation of the Contrast W2, the mean and standard deviation of the
Inverse Difference Moment W3, the mean and standard deviation of the Entropy W4, and
the mean and standard deviation of the Correlation W5. In the category, 1 indicates
pulmonary nodules, 0 indicates normal lung tissue, and part of the sample data is shown in Table1.
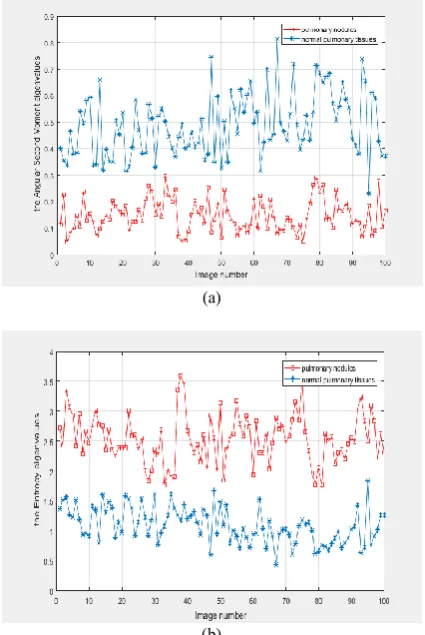
According to the data extracted from the texture features, 100 CT images with pulmonary nodules and 100 normal lung tissues were randomly selected. The eigenvalues of the Angular Second Moment and the Entropy were compared as shown in Fig.4. The feature curves of the Contrast and the Inverse Difference Moment are similar to those of the Entropy. Extraction of normal tissue and nodular features of the difference is more obvious.
(a)
(b)
Fig. 4. (a) Comparison of the Angular Second Moment eigenvalues of CT images in pulmonary nodules and normal pulmonary tissues; (b) Comparison of the Entropy eigenvalues of CT images in pulmonary nodules and normal pulmonary tissues
5.4. Analysis of SVM Recognition Results
In this paper, support vector machine is used to classify pulmonary nodules, in which the kernel function is a linear kernel function. In the 3.2 section, ten dimensional feature vectors extracted from the region of interest of lung nodules are classified by support vector machine. After many experiments, the accuracy of recognition results is 94%, which proves the validity of the method. Therefore, the 2D training data were drawn showplot in MATLAB R2016b, the experimental results are shown in Fig.5 and Table 2.
paper, not only ensuring the integrity, accuracy and robustness of segmentation, but also improving the accuracy of classification.
Fig. 5. This is classification results of pulmonary nodules
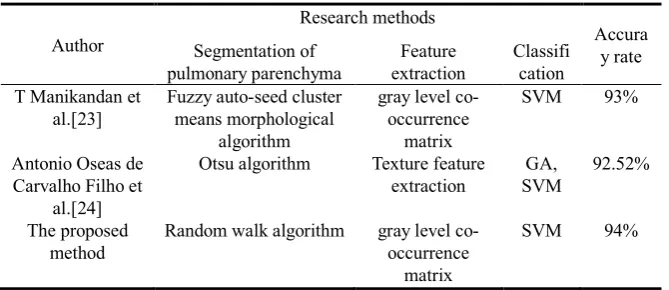
Table 2. This is Comparison based on SVM classification method
Author
Research methods
Accura y rate Segmentation of
pulmonary parenchyma
Feature extraction
Classifi cation T Manikandan et
al.[23]
Fuzzy auto-seed cluster means morphological
algorithm
gray level co-occurrence
matrix
SVM 93%
Antonio Oseas de Carvalho Filho et
al.[24]
Otsu algorithm Texture feature
extraction
GA, SVM
92.52%
The proposed method
Random walk algorithm gray level
co-occurrence matrix
SVM 94%
6.
Conclusions
and standard deviation of the Angular Second Moment, the mean and standard deviation of the Contrast, the mean and standard deviation of the Inverse Difference Moment, the mean and standard deviation of the Entropy, and the mean and standard deviation of the Correlation, which are constructed a ten-dimensional feature vectors and finally formed a 200 × 10 matrix. Finally, the support vector machine algorithm is used to recognize pulmonary nodules. After many times of debugging and optimization, the recognition accuracy has reached above 94%. This method can help clinicians make diagnostic decisions quickly, accurately and efficiently.
Acknowledgments. This work is supported by the Harbin Science and Technology Bureau outstanding subject leader fund project (Project No.: 2017RAXXJ055), Harbin University of Commerce 2018 Graduate innovation research project (Project No.:YJSCX2018-526HSD), Harbin University of Commerce 2017 Graduate innovation research project (Project No.:YJSCX2017-441HSD) and 2016 young creative talent support project of Harbin University of Commerce (Project No.:2016QN051), Heilongjiang Provincial Fundamental Scientific Research Business Research Project (Project No.: 17XN003).
References
1. Torre L., Bray F., Siegel R., et al. Global cancer statistics, 2012: Global Cancer Statistics, 2012. Ca A Cancer Journal for Clinicians, Vol. 65, No. 2, 87-108. (2015)
2. Kwak E. L., Bang Y. J., Camidge D. R., et al. Anaplastic Lymphoma Kinase Inhibition in Non–Small-Cell Lung Cancer. New England Journal of Medicine, Vol. 363, No. 18, 1693-1703. (2010)
3. Al M. B., Brennan P. C., Mello-Thoms C. A review of lung cancer screening and the role of computer-aided detection. Clinical Radiology, Vol. 72, No. 6. (2017)
4. Liu S., Pan Z., Song H. Digital image watermarking method based on DCT and fractal encoding. Iet Image Processing, Vol. 11, No. 10, 815-821.(2017)
5. Liu S., Pan Z., Cheng X. A Novel Fast Fractal Image Compression Method based on Distance Clustering in High Dimensional Sphere Surface. Fractals-complex Geometry Patterns & Scaling in Nature & Society, Vol. 25, No. 23, 1740004. (2017)
6. Doi K. Computer-aided diagnosis in medical imaging: historical review, current status and future potential. Computerized Medical Imaging & Graphics, Vol. 31, No. 5, 198-211. (2007)
7. Kim B. C., Yu S. S., Suk H. I. Deep feature learning for pulmonary nodule classification in a lung CT. International Winter Conference on Brain-Computer Interface. IEEE, 1-3. (2016) 8. Kumar D., Wong A., Clausi D. A. Lung Nodule Classification Using Deep Features in CT
Images. Conference on Computer and Robot Vision. IEEE Computer Society, 133-138. (2015)
9. Dhara A. K., Mukhopadhyay S., Dutta A., et al. A Combination of Shape and Texture Features for Classification of Pulmonary Nodules in Lung CT Images. Journal of Digital Imaging, Vol. 29, No. 4, 466-475. (2016)
10. Ozen Y., Kose C. Segmentation of lung CT images with random walk algorithm. Signal Processing and Communications Applications Conference. IEEE, 2206-2208. (2014) 11. Wang B., Xiaomeng G. U., Yang Y., et al. Automated lung segmentation for chest CT
images based on Random Walk algorithm. Journal of Computer Applications. (2015) 12. Onoma D. P., Ruan S., Gardin I., et al. 3D random walk based segmentation for lung tumor
13. Grady L. Random Walks for Image Segmentation. IEEE Trans.pattern Anal.mach.intell, Vol. 28, No. 11, 1768-1783. (2006)
14. Yang P., Yang G. Feature extraction using dual-tree complex wavelet transform and gray level co-occurrence matrix. Neurocomputing, Vol. 197, No. C, 212-220. (2016)
15. Walaa. Content Based Medical Image Retrieval with Texture Content Using Gray Level Co-occurrence Matrix and K-Means Clustering Algorithms. Journal of Computer Science, Vol. 8, No. 7, 1070-1076. (2012)
16. Haralick R. M. Shanmugam K., Dinstein I. Textural Features for Image Classification. Systems Man & Cybernetics IEEE Transactions on, Vol. 3, No. 6, 610-621. (1973) 17. Partio M., Cramariuc B., Gabbouj M., et al. Rock texture retrieval using gray level
co-occurrence matrix. Proc of Nordic Signal Processing Symposium Norsig Norway. (2002) 18. Park M., Wilson L. S., Wilson L. S. Detection of abnormal texture in chest X-rays with
reduction of ribs. Pan-Sydney Area Workshop on Visual Information Processing. Australian Computer Society, Inc. 71-74. (2004)
19. Yin D., Pan J., Chen P., et al. Medical Image Categorization Based on Gaussian Mixture Model. International Conference on Biomedical Engineering and Informatics. IEEE, 128-131. (2008)
20. Liu S., Lu M., Liu G., et al. A Novel Distance Matric: Generalized Relative Entropy. (2017) 21. Liu S., Fu W., He L., et al. Distribution of primary additional errors in fractal encoding
method. Multimedia Tools and Applications, Vol. 76, No. 4, 5787-5802. (2017)
22. Rendon-Gonzalez E., Ponomaryov V. Automatic Lung nodule segmentation and classification in CT images based on SVM. International Kharkiv Symposium on Physics and Engineering of Microwaves, Millimeter and Submillimeter Waves. IEEE, 1-4. (2016) 23. Manikandan T., Bharathi N. Lung Cancer Detection Using Fuzzy Auto-Seed Cluster Means
Morphological Segmentation and SVM Classifier. Plenum Press. (2016)
24. Ao D. C. F., Silva A. C., Cardoso d P. A., et al. Computer-Aided Diagnosis of Lung Nodules in Computed Tomography by Using Phylogenetic Diversity, Genetic Algorithm, and SVM. Journal of Digital Imaging, Vol. 30, No. 6, 812-822. (2017)
Zhijie Zhao He was born in Harbin, China, in 1963. He is currently a professor at the School of Computer and Information Engineering at Harbin University of Commerce, China. He achieved his B. S. and M. S. Degree from Harbin University of Science and Technology, China, in 1985 and 1988 respectively, and obtained his PhD. from Harbin Institute of Technology in 2008. His research interests include image processing and intelligence information processing.
Cong Ren She received her B.S. degree from the School of Computer and Information Engineering at Harbin University of Commerce, China, in 2017. Currently, she is studying for her M.S. degree. Her research interests include image retrieval and intelligence information processing.
Zhipeng Fan He received M.S. degrees from the Harbin University of Commerce, Harbin, China. He is currently a lecturer with the School of computer and Information Engineering, Harbin University of Commerce. He has published a number of journal and conference papers in the field of video compression and image coding. His current research interests include intelligence information processing and business data analysis.
Ze Gao She received her B.S. degree from the School of Computer and Information Engineering at Harbin University of Commerce, China, in 2016. Currently, she is studying for her M.S. degree. Her research interests include image retrieval and intelligence information processing.