Damle et al. World Journal of Pharmaceutical and Medical Research
www.wjpmr.com 68
DEVELOPMENT AND VALIDATION OF STABILITY-INDICATING HPTLC METHOD
FOR SIMULTANEOUS ESTIMATION OF OXYCLOZANIDE AND LEVAMISOLE HCl
Mrinalini C. Damle*and Sanchita A. Kale
AISSMS College of Pharmacy, Kennedy Road, Near RTO, Pune-411001.
Article Received on 02/03/2017 Article Received on 23/03/2017 Article Accepted on 12/04/2017
INTRODUCTION
Oxyclozanide (OXY) is an anthelmentic drug indicated mainly in treatment of a helminth disease caused by two trematodes Fasciola hepatica and Fasciola gigantic.
Oxyclozanide is chemically 2,3,5-trichloro-n-(3,5-dichloro-2-hydroxyphenyl)-6-hydroxybenzamide. The molecular formula of OXY is C13H6Cl5NO3. The
molecular mass of OXY is 401.5 g/mol. It is Freely
soluble in acetone, soluble in ethanol (95%) and very slightly soluble in water. Levamisole HCl (LEVA) is (S)-6-phenyl-2,3,5,6-tetrahydroimidazo[2,1-b][1,3]thiazole. LEVA HCl is the levorotatory isomer of tetramisole. Levamisole HCl is a pharmaceutical with anthelminthic and immunomodulatory properties that is used in both animals and humans to treat inflammatory conditions and to treat parasitic worm infections.[1-2]
HCl
(a) (b)
Fig 1: Structure of Oxyclozanide (a) and Levamisole HCl (b).
Both the drugs are official in IP 2014. The monographs state HPLC method for assay.[3] Literature survey reveals few analytical methods are reported for the determination of Oxyclozanide and Levamisole by simple HPLC[4-7], HPTLC of single drug Levamisole,[8] but no stability indicating HPTLC method of this combination has yet been reported.
Development of SIM is based on systematic exposure of API to various stress conditions. Systematic optimization trials are required to arrive at combination of “concentration of stress reagent and duration of exposure”, to obtain degradation preferably in the 10-30% range. Typical degradative conditions involve hydrolysis under different pH conditions, photolysis, oxidation and thermal.
ISSN 2455-3301 WJPMR AND MEDICAL RESEARCH
www.wjpmr.com
*Corresponding Author: Mrinalini C. Damle
AISSMS College of Pharmacy, Kennedy Road, Near RTO, Pune-411001.
ABSTRACT
A simple, rapid validated stability indicating HPTLC method for simultaneous estimation of Oxyclozanide and Levamisole HCl was successfully developed. This method is based on HPTLC separation followed by UV detection at 220 nm. The separation was carried out on Merck TLC aluminium sheets precoated with silica gel 60F254 using Ethyl acetate: Ammonia: TEA: Methanol (6:0.5:0.2:0.5 v/v) as a mobile phase. Oxyclozanide and
Levamisole HCl gave well defined and sharp peak at Rf 0.40 ± 0.02 and 0.80 ± 0.02 at 220 nm. Calibration curve was linear in range 100-500ng/band for Oxyclozanide and 200-1000ng/band for Levamisole HCl. Stress degradation study includes acid and base hydrolysis, oxidation, and thermal and photolytic stress conditions. This method can be applied to determination of stability of Oxyclozanide and Levamisole HCl. The suitability of this HPTLC method for quantitative determination of Oxyclozanide and Levamisole HCl was proved by validation in accordance with requirements of ICH guidelines Q2A (R1).
www.wjpmr.com 69 MATERIALS AND METHODS
Reagents and Chemicals
Working standard of Oxyclozanide and Levamisole HCl were obtained from Brihan Laboratories Pvt Ltd Bhosari, Pune. Methanol (AR grade), Ethyl acetate (AR grade), Ammonia, TEA, Hydrochloric acid (HCl), hydrogen peroxide (H2O2, 30% v/v), sodium hydroxide (NaOH)
were purchased from LOBA CHEMIE PVT. LTD. Mumbai.
Preparation of Standard Stock Solution
Standard stock solution of OXY and LEVA HCl were prepared separately by dissolving 10 mg of drug in 10 ml of methanol get concentration of 1000 µg/ml. From the standard stock solution, working standard solution of both the drugs were prepared separately containing 20µg/ml of OXY and 40 µg/ml of LEVA HCl using Methanol.
Selection of Detection Wavelength
From the standard stock solution further dilutions were done using methanol and scanned over the range of 200 - 400 nm and the spectra were obtained to finalise wavelength for detection.
Chromatographic state and Instrumentation
Chromatographic separation of drug was performed on Aluminum plates precoated with silica gel 60 F254, (10
cm × 10 cm with 250 µm layer thickness). Samples were applied on the plate as a band with 6 mm width using Camag 100 μl sample syringe (Hamilton, Switzerland) with a Linomat 5 applicator (Camag, Switzerland). The
mobile phase was composed of Ethyl
acetate:Ammonia:TEA: Methanol (6:0.5:0.2:0.5 v/v). 10 cm × 10 cm CAMAG twin trough glass chamber was used for linear ascending development of TLC plate under 15 min saturation conditions and 7.2 ml of organic solvent was used per run, migration distance was 90 mm. Densitometric scanning was performed using Camag TLC scanner 3 in the range of 400-200 nm, operated by win CATS software (Version 1.4.3, Camag), slit dimensions were 5.00 x 0.45 mm and Deuterium lamp was used as a radiation source.
Stress Degradation Studies of Bulk Drugs
Stress testing studies were carried out separately on each drug to provide evidence on how the quality of drug varies under the influence of variety of stress conditions like hydrolysis under different pH conditions, oxidation, photolysis and thermal etc. Optimization of stress conditions was done by changing strength of reagent and duration of exposure to obtain degradation preferably in the 10-30% range.
Optimization Trials
Initially trials were conducted using 0.1 N HCl and 0.1N NaOH by keeping the sample solution for 2 hrs,4hrs, 6hrs and overnight. Whereas for the thermal study sample heated at 600C for 2hrs to 10hrs. It was observed that drug gets degraded partially.
Optimized stress conditions Alkali Catalyzed Hydrolysis
5 ml working standard solution of OXY and LEVA HCl (200 and 400 µg/ml respectively) was mixed with 5 ml of 0.1 N NaOH and volume was made up to 50ml with methanol separately. Solutions were refluxed for 1 hr at 600C and applied on TLC plate.
Acid Catalyzed Hydrolysis
5 ml working standard solution of OXY and LEVA HCl (200 and 400 µg/ml respectively) was mixed with 5 ml of 0.1 N HCl and volume was made up to 50ml with methanol Separately. Solutions were refluxed for 1 hr at 600C and applied on TLC plate.
Oxidation Degradation
1 ml working standard solution of OXY and LEVA HCl (200 and 400 µg/ml respectively) was mixed with 1ml 30% v/v H2O2; volume was made up to 10ml with
Methanol separately. Solutions were kept for 2hr and applied on TLC plate.
Degradation under Dry Heat
Dry heat study was performed by keeping both drugs in oven at 600 C. A sample was withdrawn after 12hrs, weighed and dissolved in methanol to get solution of 20µg/ml of OXY and 40 µg/ml of LEVA HCl and then applied on TLC plate.
Photo-Degradation
Photolytic studies were carried out by exposure of drug to UV light up to 200 watt hrs/square meter and subsequently to cool fluorescent light to achieve an illumination of 1.2 million Lux hrs. Sample was weighed, dissolved and diluted get 20µg/ml of OXY and 40µg/ml of LEVA HCl as final concentration and was applied on TLC plate.
RESULT AND DISCUSSION
It was observed that OXY and LEVA HCl showed considerable absorbance at 220nm.Hence this wavelength was chosen for scanning the TLC plate.
-0.1 1.2
0.5 1
200 250 300 350 400
Abs
Wavelength [nm]
www.wjpmr.com 70 Optimization of Chromatographic Conditions
The first step in developing this stability indicating HPTLC method is to achieve the resolution of OXY and LEVA HCl with Rf in the range of 0.2 to 0.8. Various binary and ternary combinations of solvents were tried. The chromatographic separation was achieved by linear ascending development in 10 cm × 10 cm twin trough
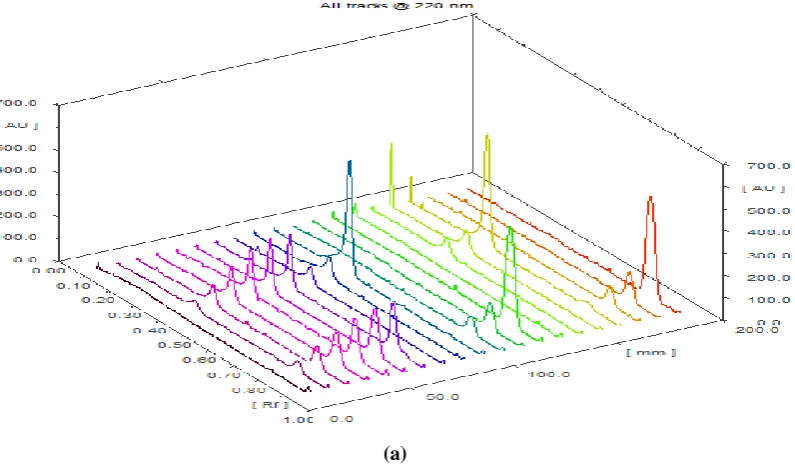
glass chamber using Ethyl acetate:Ammonia:TEA: Methanol (6:0.5:0.2:0.5 v/v) as mobile phase and detection was carried out at 220 nm. The retention factor for OXY and LEVA HCl was found to be 0.40 ± 0.02and 0.80 ± 0.02 respectively. Representative Densitogram of standard solution of OXY and LEVA HCl is shown in figure 3.
Fig.3: Densitogram of standard solution of Oxyclozanide 200ng/band (Rf 0.40 ± 0.02) and Levamisole HCl 400ng/band (0.80 ± 0.02).
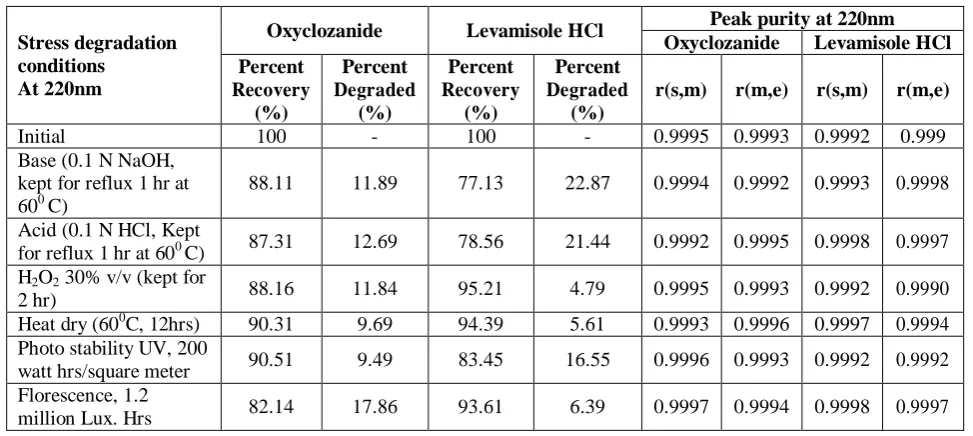
Result of Forced Degradation Studies
After optimization of the different stress conditions, OXY and LEVA HCl were found to degrade not more than 18% and 20%.There was no separate peak for product of degradation observed for either of the two. It was confirmed by applying 10 times higher concentration (2000ng /band for OXY and 4000ng/band
for LEVA HCl) and further confirmed by multiwavelenght scanning to observe if any degradation products are present. Peak purity is comparison of absorbance spectra from the start to middle (s,m) and from middle to end (m,e) of the peak to determine if they are homogenous peaks. Peak purity parameters ensured non-interference by product of degradation.
www.wjpmr.com 71 (b)
Fig.4: (a) Densitogram of 2000ng/band and 4000ng/band for OXY and LEVA HCl respectively and (b)
Multiwavelength Spectral Scanning of UV and Thermal condition at
210nm,215nm,225nm.230nm,235nm,240nm,250nm,260nm,270nm,280nm
No peak for degradation product was observed for Oxyclozanide and Levamisole HCl during stress
conditions like oxidation, dry heat and light. Results of the stress degradation studies are presented in Table 1.
Table 1: Summary of stress degradation oxyclozanide and levamisole HCl.
Stress degradation conditions
At 220nm
Oxyclozanide Levamisole HCl Peak purity at 220nm Oxyclozanide Levamisole HCl Percent
Recovery (%)
Percent Degraded
(%)
Percent Recovery
(%)
Percent Degraded
(%)
r(s,m) r(m,e) r(s,m) r(m,e)
Initial 100 - 100 - 0.9995 0.9993 0.9992 0.999
Base (0.1 N NaOH, kept for reflux 1 hr at 600 C)
88.11 11.89 77.13 22.87 0.9994 0.9992 0.9993 0.9998
Acid (0.1 N HCl, Kept
for reflux 1 hr at 600 C) 87.31 12.69 78.56 21.44 0.9992 0.9995 0.9998 0.9997 H2O2 30% v/v (kept for
2 hr) 88.16 11.84 95.21 4.79 0.9995 0.9993 0.9992 0.9990
Heat dry (600C, 12hrs) 90.31 9.69 94.39 5.61 0.9993 0.9996 0.9997 0.9994
Photo stability UV, 200
watt hrs/square meter 90.51 9.49 83.45 16.55 0.9996 0.9993 0.9992 0.9992
Florescence, 1.2
million Lux. Hrs 82.14 17.86 93.61 6.39 0.9997 0.9994 0.9998 0.9997
Validation of the Method
The method was validated for various parameters in accordance with ICH guidelines.[9-11]
Linearity
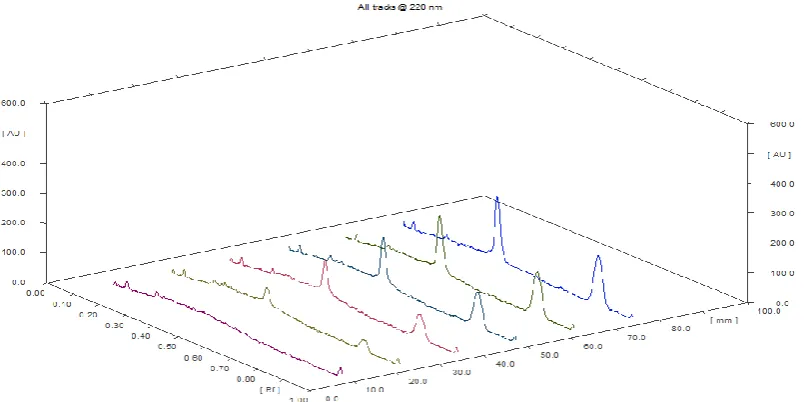
The calibration curve was obtained in the range of 100-500ng/band for Oxyclozanide and 200-1000ng/band for Levamisole HCl by applying different volumes on TLC
www.wjpmr.com 72 Fig. 5: Densitogram of linearity of Oxyclozanide (Rf 0.40 ± 0.02) 100-500ng/band and Levamisole HCl (Rf 0.80 ± 0.02) 200-1000ng/band.
Precision
The precision of the system was demonstrated by intra-day and inter-intra-day studies. In the intraintra-day study 6 replicates of 1 standard concentrations (300ng/band for Oxy and 600ng/band for Leva HCl) were analyzed in a day and percentage RSD was calculated. For the inter day study, 3 replicates of 3 different concentrations were analyzed and percentage RSD was calculated. For interday system precision 1.88 % and 2.00 % for Oxy and Leva HCl respectively. For intraday RSD was found to be 0.96 % and 1.72% for OXY and LEVA HCl respectively.
Assay
Assay was performed on blend of bulk drugs plus excipients. Assay was determined by extrapolation of peak area from linearity equation which was found to be 99.23% and 100.03% for Oxyclozanide and Levamisole HCl respectively.
Accuracy
To check accuracy of the method, recovery studies were carried out by adding standard drug to assayed at three different levels 80, 100 and 120 %. The drug concentrations were calculated from respective linearity equation. The results of the recovery studies indicated that the method is accurate for estimation of drug in the blend. The results obtained are shown in.
Table 2: Recovery studies of Oxyclozanide (A) and Levamisole (B) at 220 nm.
(A) Level (%)
Conc. spiked (ng/band)
Conc. recovered (ng/band)
% Recovery
80 800 824.2 103
100 1000 1026.2 107
120 1200 1229.2 112
(B) Level (%)
Conc. spiked (ng/band)
Conc. recovered (ng/band)
% Recovery
80 800 820.2 92.51
100 1000 1022.3 93.25
120 1200 1223.1 85.62
Specificity
The specificity of the method was ascertained by peak purity profiling studies. The peak purity values were found to be more than 0.9982, indicating the non-interference of any other peak of degradation product or impurity.
Limit of Detection (LOD) and Limit Of Quantitation (LOQ)
LOD and LOQ were calculated as 3.3 σ/S and 10 σ/S, respectively; where σ is the standard deviation of the concentration response and S is the slope of the calibration plot. The LOD and LOQ were found to be.
LOD of Oxyclozanide= 0.98 ng/band and LOQ of Oxyclozanide = 2.99ng/band
LOD of Levamisole HCl= 1.10 ng/band and LOQ of Levamisole HCl = 3.35ng/band
Robustness
www.wjpmr.com 73 Table 3: Robustness study.
Sr
No. Parameters Robust condition
% RSD
Oxyclozanide Levamisole HCl
1 Saturation time(15min) ± 2 min.
13min 2.03 0.81
17min 1.77 1.52
2 Time from spotting to development (immediate)
After 30min. 1.92 1.66
After 1hr 2.01 1.88
3 Time from development to scanning (immediate)
After 30min. 1.01 1.75
After 1hr 1.4 2.00
4 Mobile phase ratio variation
Ethyl acetate:Ammonia:TEA:
Methanol (5.8:0.5:0.2:0.5 v/v) 1.29 1.51
Ethyl acetate:Ammonia:TEA:
Methanol (6.1:0.5:0.2:0.4 v/v) 1.83 1.73
Table 4: Summary of validation study.
Sr. No Validation Parameters Oxyclozanide Rf=0.40
Levamisole HCl Rf=0.80
1 Linearity Equation (r2) Range
y=179.5x+279.0 R² = 0.999
100-500ng/band
y=212.92x+597.39 R² = 0.996
200-1000 ng/band
2
Precision (% RSD) a) Interday b) Intraday 1.88% 0.968% 2.00% 1.72% 3 Accuracy a) 80% b) 100% c) 120% 103 107 112 92.51 93.25 85.62
4 Limit of Detection
(ng/band) 0.98 1.10
5 Limit ofQuantitation (ng/band) 2.99 3.35
6 Specificity Specific Specific
7 Robustness Robust Robust
CONCLUSION
The developed method is simple, rapid and stability indicating. It may be used to monitor stability of Oxyclozanide and Levamisole HCl.
ACKNOWLEDGEMENT
Authors are thankful to the Principal and the management of AISSMS College of Pharmacy, Pune for providing the necessary facilities for research work and to Brihan Laboratories Pvt Ltd Bhosari, Pune for providing APIs.
REFERENCES
1. The European Agency for the Evaluation of medicinal products,veterinary medicines and inspections.EMEA/MRL/340/February 1998. 2. Cengiz G, Hande SY, Dilek A and Vincenzo V.
Comparative Pharmacokinetics of Levamisole-Oxyclozanide Combination in Sheep and Goats following per Oral Administration. The Canadian Journal of Veterinary Research, 2014; 78(3): 16– 320.
3. Indian pharmacopoeia 2014 vol ii Government of India. Ministry of Health and Family Welfare,Published by the Indian pharmacopoeia commission Ghaziabad, 2075-3556
4. RajeshKumar A, and SathishKumar S. Development And Validation of RP-HPLC Method for the Estimation of Oxyclozanide in Bulk Drug and Pharmaceutical Formulations International Journal of Chemtech Research, 2012; 4(2): 700-704. 5. Ravisankar P and Devala Rao G. Development and
Validation of RP-HPLC Method for Determination of Levamisole in Bulk and Dosage Form. Asian J Pharm Clin Res, 2013; 6(3): 169-173.
6. Anusha.G. Development and Validation of RP-HPLC Method for the Estimation of Oxyclozanide in Pure and Pharmaceutical Formulations. International Journal of Pharmacy and Analytical Research, 2014; 3(2): 185-191.
www.wjpmr.com 74
8. Behvar A, Samad N E, Fateme M, and Hassan Y.Development And Validation of a Simple Stability-Indicating TLC Method for the determination of Levamisole in Pharmaceutical Tablet Formulation. Journal of Planar Chromatography, 2011; 24(5): 419–422.
9. ICH Q1A (R2). Stability testing of new drug substances and products, International Conference on Harmonization, 1996; 1-24.
10. ICH Q1B: Stability Testing: Photostability Testing of New Drug Substances and Products. ICH Harmonized Tripartite Guideline. Geneva Switzerland, 2003.