UFLA - Federal University of Lavras DCC - Department of Computer Science
P.O. Box 3037 - Campus da UFLA 37200-000 - Lavras (MG)- Brazil 1[email protected]
Abstract. Software projects always generate a lot of data, ranging from informal documentation to a database with thousands of lines of code. This information extracted from software projects takes even greater when it comes to OSS (Open Source Software). Such data may include source code base, historical change in the software, bug reports, mailing lists, among others. Using data mining techniques, we can extract valuable knowledge of this set of information, thus providing improvements throughout the process of software development. The results can be used to improve the quality of software, or even to manage the project in order to obtain maximum efficiency. This article proposes the application of data mining techniques to cluster software projects, cites the advantages that can be obtained with these techniques, and illustrates the application of data mining in a Open Source Software database.
Keywords: Data Mining, Software Engineering, Cluster, OSS.
1 Introduction and Motivation
The decision making process of most organizations is based on past experience, pre-established standards or even the simple consensus of a group of managers who did not have at their hands tools good enough to sup-port them in such decisions. Developers often use their experience to add features or fix bugs in software. IT managers allocate resources, as employees for exam-ple, based on their intuition and experience in previous projects, keeping in mind only the understanding of the complexity of this new project in relation to projects that have already participated. Software repositories contain valuable information about various software pro-jects. Using information stored in these repositories, professionals can rely less on their experience and in-tuition, and rely more on historical data, which can be found in abundance [5].
According to Mendonca (1999, cited by Xie Tao et al., 2007)[8], the idea of applying data mining tech-niques on information extracted from software engineer-ing has existed since mid-1990, but only after 2001, with the Mining Software Repositories workshop (MSR)
that the subject began to attract people from around the world, with varied interests in mining information from these software repositories.
As shown in Figure 1, we can extract information from a source code repository or even text in docu-ments generated by software engineering process. With this information we can apply various data mining algo-rithms such as classification and clustering, thereby ob-taining sufficient knowledge to support different tasks in software engineering (programming, error detection, testing, etc.).
2 Database
Before explain how we clustered software projects, we should mention where we obtained such data used in this study.
FLOSS (free / libre / open source software) is a software that is licensed to grant the right of users to use, modify, study, improve and redistribute it with-out restrictions using its source code available to any-one. This approach has gained increasing momentum and acceptance among people and companies due to the great benefits it can bring, for e.g. the benefit to share information and even code snippets to improve the soft-ware quality. With this strong need to share informa-tion and source codes of software, various repositories in the network have emerged, for example SourceForge, GoogleCode, Freshmeat, Rubyforge, among others.
Using data available on the web, mainly in software repositories, a collaborative project called FLOSSmole was created to collect, share, and store comparable data and analysis of the FLOSS development for academic research. The project is based on continuous data col-lection and analysis efforts of many research groups, reducing duplication and promoting compatibility both in the data sources of FLOSS software, as well as in re-search and analysis [6]. In the FLOSSmole project, data was collected in different software repositories. This data was stored in relational databases (SQL), and avail-able on FLOSSmole Project website [2]. For this study, we used the database collected from SourceForge repos-itory, as they are the largest repository of projects today, and it is well known among developers.
According to Crowston and Howison (2004)[7], col-lecting data on SourceForge faces many difficulties such as projects that are no longer updated and important data that are hosted outside of SourceForge reposito-ries. These issues can directly affect the analysis of projects, for example, reduce the amount of variables that we could obtain from each project due to lack of information concentrated in one place. Lots of informa-tion regarding projects is hosted outside of SourceForge repositories, preventing their collection. It is also im-portant to be very careful when dealing with such data. The analysis of SourceForge projects should not sim-ply take into account all variables, and yes, carefully consider which variables are critical for the research in question.
3 Cluster Analysis
Clustering is the process of grouping data into classes or clusters so that objects within a cluster have high sim-ilarity between them, but are very different from
ob-jects in other clusters. These similarities are evaluated based on the values of attributes that describe the ob-jects, and for this we use the distance measures. Clus-tering is widely used in many areas such as data mining, statistics, biology, and machine learning.
Unlike classification, which predicts the class of an object based on the class of other objects, the Cluster-ing groups those objects accordCluster-ing to their similarities, and only then classifies each cluster according with the objects it contains. For this reason, Clustering is con-sidered a form of learning by observation, rather than learning from examples. The advantages of this proce-dure based on Clustering are its adaptability to change. According to Han (2006) [4], major clustering meth-ods can be classified into the following categories listed.
3.1 Partitioning methods
Given a database with n objects or data tuple, a parti-tioning method constructs k partitions of data, where each partition represents a cluster and k≤n. These k groups must meet two criteria. (1) Each group must contain at least one object, and (2) each object must belong to exactly one group. It is noteworthy that the second criterion can be modified using some fuzzy tech-niques.
Given k, the number of clusters to be created, the method for initial partitioning creates partitions and then uses an iterative relocation technique that attempts to improve the partitioning by moving objects from one group to another, taking into consideration that a good partitioning occurs when objects in same cluster are “clo-se” to each other and objects from different cluster are “distant” from each other.
Among the best known partitioning methods are k-means, where each cluster is represented by the aver-age values of the objects in the cluster, and k-medoids, where each cluster is represented by the object closest to the center of the cluster.
3.2 Hierarchical methods
A hierarchical method creates a composition or decom-position of a set of reported data, representing them in a tree form, commonly known as dendogram. We can classify these methods in hierarchical agglomerative or divisive.
The agglomerative approach, also called bottom-up, begins with each object being a separate group. As it-erations occur, these clusters are grouped according to their proximity and new clusters are formed until all ob-jects form a single cluster, generating the dendrogram. Oppositely, the divisive approach, also called top-down,
starting with all objects in one single cluster, and for each iteration a cluster splits into smaller clusters until each object becomes a single cluster, or stop condition is achieved in Figure 2 .
Hierarchical methods better know include BIRCH (Balanced Iterative Reducing and Clustering Using Hi-erarchies), ROCK (RObust Clustering using linKs), and Chameleon, based on the weaknesses found in hierar-chical clustering algorithms CURE and ROCK.
Figure 2: Agglomerative and divisive hierarchical clustering [4].
3.3 Density-based methods
The general idea of density-based methods is to make the cluster continues to grow as the density, i.e. the number of objects in the neighborhood exceeds some threshold. Each object of a cluster must contain a min-imum number of neighboring objects in a given range and this minimum amount of neighboring objects should be previously informed.
The method starts the execution with an arbitrary object, and if the neighborhood of this object meets the minimum density previously informed those neighbors are included in the group. The process is then repeated for these new items added until the threshold density is reached.
The main advantage of density-based methods is that they can find groups with arbitrary shapes such as cylin-drical or elliptical, and require no initial information on the number of clusters to be formed.
Among the methods based on density, the best known are: DBSCAN (Density-Based Spatial Clustering of Ap-plications with Noise), OPTICS (Ordering Points To Identify the Clustering Structure) and DENCLUE (DEN-sity-based CLUstEring).
3.4 Grid-based methods
Cluster Analysis methods based on grids divide the ob-ject space in x number of cells. Then these cells are divided into another and so on, forming different levels of resolution. It is through these cells that objects are grouped. Thus, it has a hierarchical structure.
The main advantage of these methods is that its speed depends only on the resolution of the grid (where the data is plotted) and not the size of the database. Be-cause of this, grid-based methods are appropriate for high-density databases, i.e. with a very large number of objects in a limited space.
The grid-based methods most used are STING (Sta-tistical Information Grid) and WaveCluster.
3.5 Model-based methods
The model-based methods try to adjust some mathemat-ical model to data. The methods are often based on the assumption that the data are generated from a mixture of probability distributions and follow one of the two main approaches: statistical or neural network. This method is not widely used, mainly by the processing time which is usually quite long.
The model-based methods most used are the EM (Expectation-Maximization), which is usually seen as an extension of the paradigm of the k-means, but with-out the need to specify the number of clusters, the COB-WEB, a form of conceptual clustering, and SOM (Self-Organizing feature Maps), which is an algorithm with neural network approach.
4 Methodology
In the methodology we will discuss important informa-tion regarding the applicainforma-tion created to exemplify the data mining in software projects. Therefore, we explain how we clean the data, including variable selection and exclusion of outlier values (values far from any cluster), which methods we used, among others.
The methodology is divided into two parts: Sorting and filtering data, and clustering methods.
4.1 Sorting and filtering data
In the data selection we will choose the most interesting variables to cluster projects and eliminate outliers, i.e. data that are far away from the main group of data, or outside the “normal”.
Analyzing data from SourceForge repositories pro-vided by the FLOSSmole project, the following attribu-tes were chosen to characterize the software projects: proj unixname(project unique name), num desenvolve-dores(number of developers), db name(database name), publico alvo(intended audience), linguagem programa-cao(programming languages), topic. The names are al-ready self-explanatory, being proj unixname the primary key of the database. First we list the possible variables for each project in order of relevance, and then choose
the top five. To avoid delays in the execution of clus-tering methods, we had to select only five variables, re-membering that this work aims to focus more on the proposal of clustering software projects for future con-sideration, not the application itself, such application was created only with the intended to exemplify the use of a clustering method in software projects. For nom-inal attributes, it would be interesting to list the pos-sibilities contained in each, however, being many, we will list only the amount of possible values for each at-tribute. The possibilities are described below:
• num desenvolvedores: 1 to 103 developers.
• banco de dados: 38 possibilities.
• publico alvo: 22 possibilities.
• linguagem programacao: 70 possibilities.
• topico: 305 possibilities.
The MySQL database provided by the FLOSSmole project has initially 204.439 registered projects. These data were obtained in December 2009 and are available in their repository on Google Code. The five attributes selected for each software project are in different ta-bles in the database provided. As the query requires a join of five tables, we created another database, named flossmolesf join containing the six attributes that need to evaluate a project, making the query faster.
For performance in the implementation of clustering methods, we selected only 4.094 software projects of 204.439 provided by the original database (flossmolesf ). This generated 43.042 lines in our new database created flossmolesf join. Note that the number of rows in the database is bigger than the number of projects, because a project can be repeated several times (e.g. when it uses two different databases). To make this junction and selecting information in the database flossmolesf, and insertion into the database flossmolesf join, was created a little application in Java that connects to a database, make the query and then insert the result in another database.
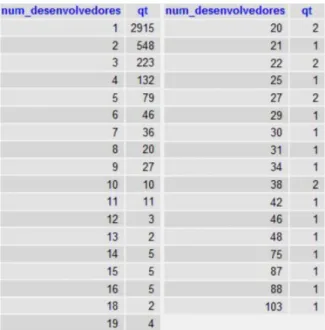
To maintain consistency in the clusters formed by the clustering methods, we need to filter the data pro-vided. To filter this data, we will require that some at-tributes appear certain amount of times. For example, Figure 3 shows the number of developers and number of projects that have this number of developers. Through this figure we can see an agglomeration in projects with number of developers from 1 to 9, especially with only one developer (2.915 projects). So we will include only projects with the number of developers between 1 and
9, decreasing the number of projects for 4.026, and the number of rows of the query to 39.769. With that, we have a removal of outliers that did not affect the group-ing, since the number of projects decreased only in 68. Some projects had zero number of developers, that is, at this moment the project was abandoned. These projects were previously removed at the time of transfer of the databases flossmolesf to flossmolesf join.
Figure 3: Number of developers and number of projects that have this number of developers.
4.2 Clustering methods
To execute the clustering methods we use the open-source software Weka. OSS Weka is a toolkit consisting of a collection of machine learning algorithms oriented to data mining tasks [3].
An important detail to be highlighted in data min-ing is usually regardmin-ing the types of data. Some al-gorithms only accept numeric values and others accept only nominal values, however, for the algorithms used in this work we don’t need to worry about it, because they transform the data to the required type automati-cally.
For this work we use the partitioning clustering meth-od, specifically the k-means, for better suit the proposed goal, to be better known, and easier to understand. The software Weka has an implementation of the enhanced k-means called SimpleKMeans where it is not necessary to convert nominal values to numeric.
To highlight one of the advantages of applying data mining techniques for clustering software project, we created a project with the name KMEANS, three
de-velopers, MySQL database, education as intended au-dience, PHP programming language, and topic as Dy-namic Content. We inserted this project in the ARFF file, which is a file type used by Weka, and execute the algorithm SimpleKMeans using six clusters. The 39.770 instances were divided as follows:
Cluster N◦instances P ercentage
0 5821 15% 1 5381 14% 2 12611 32% 3 5262 13% 4 7346 18% 5 3349 8%
Table 1: Number of instances per cluster
The OSS Weka provides a tool for analysis of clus-ters that can show us many interesting information. For example, Figure 4 shows the distribution of Clusters (x axis) for Instances (y axis), and the color representing the database. Since we have many types of databases, we highlighted all in gray, except for MySQL databases (black), SQL-based (blue), JDBC (red) and XML-based (green), which are frequently used in software projects for this case. Analyzing this figure, it is evident some information, when objects in same cluster are “close” to each other and objects and JDBC on the cluster 4. You can also noticed that even the SQL-based database being the second most used in the projects, no cluster had the predominance of this. With these and other in-formation, we can draw conclusions focusing mainly in clusters. Thus discovering more about the cluster on which our project fits.
With Weka, we can regenerate an ARFF file or CVS, but with the new information, which is the cluster in which each project was allocated. When we export a CVS file with Weka, we can open it with a spreadsheets editor, and better organize the results, including insert filters to list only the selected cluster. The project ini-tially created, KMEANS, was allocated on the cluster 4. This cluster included projects such as abc-123, abettor, backoffice-irc, azumaportal, who somehow has a simi-larity with the project KMEANS.
5 Conclusion
In this topic we will discuss some advantages and pre-cautions that should be taken when using clustering meth-ods in software projects.
It’s clear the difficulty that software engineers have to deal with the allocation of resources in projects that are starting. Imagine a scenario of a large software pany with many employees, and projects being com-pleted and started at any time. Using a database where
Figure 4: Cluster distribution x Instances (Colors represent the database).
all the company’s projects were registered, with infor-mation such as employees who worked on the project and its productivity, we could use cluster analysis to form clusters of projects, thereby obtaining very inter-esting results, such as which possibly will be the dead-line for completion of this new project or which devel-opers are best suited to participate in this project. These variables can be extended to obtain other information, such as the reuse of source code for similar projects, technologies that best apply to these projects, and last but not least, the allocation of resources, from physi-cal assets, such as machines, to financial resources, as expenditures on employees.
If we have at hand a database with many projects, such as the SourceForge database, we can further re-fine the clusters. In the process of selection and fil-tering of data, we can use certain criteria that help de-fine a project that was successful in its implementation. Crowston et al. (2003)[1], cites some pointers that may help identify an OSS project success. Some measures of success are suggested in the literature, for example, user satisfaction, with indicators of opinion and evalua-tion of users, and in relaevalua-tion to the use of software, with indicators of number of downloads, number of users, among others.
The use of cluster methods in software projects can offer a wide variety of important information, but the analysis of these data must be done cautiously. Despite not having been mentioned on the example used in this article, it is important to use weights for each attribute of the software project. For example, in some cases it may be interesting to give a greater relevance in the database involved, and less on the audience. By using some measures like this, we can obtain results that best fit what we want.
Although this paper is focused on clustering meth-ods, nothing prevents us from using other data mining techniques to extract information from software projects in order to improve its management. We could use asso-ciation rules to find relationships between the attributes of the projects. For example, projects with a number of developers over 10, increase its cost by 90%, but with a yield of only 30%. This information suggests that hiring more than 10 developers may end up com-promising their chances of success of such a project. Another idea would be to classify the chance of suc-cess of a newly created project using some criteria to define the success rate of a project, as mentioned ear-lier, and classification techniques, such as ID3 or J48. Xie et al. (2007)[8] mentions several other data mining techniques that could be used to assist some tasks in software engineering such as, programming, error de-tection, testing, debugging and maintenance, focusing mainly on source code repository, bug reports and mail-ing lists.
References
[1] Crowston, K., Annabi, H., and Howison, J. Defin-ing open source software project success. In Twenty-Fourth International Conference on Infor-mation Systems, School of InforInfor-mation Studies, Syracuse University, Syracuse, NY, USA, 2003. [2] FLOSSmole. Data collection and analysis about
free, libre and open source software. Available in <http://flossmole.org/>. Accessed in April 19, 2010, 2010.
[3] Hall, M., Frank, E., Holmes, G., Pfahringer, B., Reutemann, P., and Witten, I. H. The weka data mining software: An update. SIGKDD Explo-rations, Volume 11, Issue 1, 2009.
[4] Han, J. and Kamber, M. Data mining: Concepts and techniques second edition. San Francisco, CA, USA. Morgan Kaufmann Publishers, 2006. [5] Hassan, A. E. The road ahead for mining
soft-ware repositories. In Proceedings of the Future of Software Maintenance (FoSM) at the 24th IEEE International Conference on Software Maintenance (ICSM), Beijing, China, 2008.
[6] Howison, J., Conklin, M., and Crowston, K. Floss-mole: A collaborative repository for floss research data and analyses. In International Journal of In-formation Technology and Web Engineering, 2006.
[7] Howison, J. and Crowston, K. The perils and pit-falls of mining sourceforge. In Proceedings of the Workshop on Mining Software Repositories at the International Conference on Software Engineering, 2004.
[8] Xie, T., Pei, J., and Hassan, A. E. Mining soft-ware engineering data. In Proceedings of ICSE 2007: The 29th International Conference on Soft-ware Engineering, IEEE Press, Minneapolis, MN, USA, 2007.
![Figure 1: Overview of data mining in software engineering [8].](https://thumb-us.123doks.com/thumbv2/123dok_us/9005626.2386216/1.892.462.778.942.1103/figure-overview-of-data-mining-in-software-engineering.webp)
![Figure 2: Agglomerative and divisive hierarchical clustering [4].](https://thumb-us.123doks.com/thumbv2/123dok_us/9005626.2386216/3.892.116.425.368.516/figure-agglomerative-and-divisive-hierarchical-clustering.webp)