R E P O R T
Open Access
Crisis analytics: big data-driven crisis
response
Junaid Qadir
1, Anwaar Ali
1*, Raihan ur Rasool
2, Andrej Zwitter
3, Arjuna Sathiaseelan
4and Jon Crowcroft
4Abstract
Disasters have long been a scourge for humanity. With the advances in technology (in terms of computing,
communications, and the ability to process, and analyze big data), our ability to respond to disasters is at an inflection point. There is great optimism that big data tools can be leveraged to process large amounts of crisis-related data (in the form of user generated data in addition to traditional humanitarian data) to provide an insight into the
fast-changing situation and help drive an effective disaster response. This article introduces the history and the future of big crisis data analytics, along with a discussion on its promise, enabling technologies, challenges, and pitfalls.
Keywords: Big data, Crisis response
Introduction Motivation
According to Solnit 2009 disasters, besides being devas-tating, can bring people closer that consequently creates an altruistic community where people help each other and fight the ongoing calamity together. Here, we take the example of Haiti earthquake to provide motivation for big data driven crisis response and the formation of a community powered by digital technology that helped the affected people of the earthquake. In 2010, Haiti faced a devastating earthquake that left a huge number of people dead and many homeless. Humanitarian aid was predominantly delivered in a different manner that time, which was mostly driven by digital technology. The concept ofdigital humanitarianism(Meier 2014) became popular after this incident. Digital humanitarians (the people who participate or volunteer to deploy technol-ogy for the humanitarian aid) used a number of emerg-ing technologies—e.g., read-write web, big data analytics, participatory mapping, crowdsourced translation, social media, and mobile technology (we will discuss these in detail in the upcoming sections of this paper)—to catalyze an effective response after the Haiti disaster.
Huge volume of data related to the crisis—including short message service (SMS) from onsite victims,
*Correspondence: [email protected]
1Electrical Engineering Department, Information Technology University (ITU), Lahore, Pakistan
Full list of author information is available at the end of the article
social media data from citizens, journalists, and aid organizations—was subsequently collected. Sifting through the voluminous “big crisis data” (big data col-lected during a crisis situation (Meier 2014)) to find information about the affected population was a chal-lenging task. This challenge was tackled by the digital humanitarians by employing techniques such as crowd-sourcing to acquire data and producing crisis maps. The online-crowdsourcing platform used to collect data for the Haiti earthquake was Ushahidi 2016. Ushahidi provides a mobile-based platform for developing “crowd maps” through collecting, visualizing, and mapping citizen-supplied (or crowdsourced) data. After Haiti, we observe that data and technology driven disaster response has become a norm. This led to the emergence of a new kind of distributed intelligence: Disaster Response 2.0
(Crowley and Chan 2011).
The humanitarian aid and emergency response is not limited only to situations involving natural disasters. Data-driven digital humanitarianism is changing the face of humanitarian aid and development in a wide variety of fields: be it (1) a migration/refugee crisis (e.g., the Syrian migrants crisis); (2) an epidemic crisis (such as the dengue crisis in Punjab, Pakistan); (3) a natural disaster (such as the Haiti/Kashmir Earthquakes); (4) crowd control problems (such as the Mina crush crisis in Hajj 2015); (5) terrorist attack (such as the Peshawar, Pakistan school attack); (6) civil wars (such as in Iraq and Syria); (7) pub-lic violence (such as post election violence in Kenya);
and (8) other disaster situations (such as public disorder, industrial accidents, and infrastructural failures).
The importance of disaster response in the perspec-tive of big data and technology can be realized by the fact that the 2013 World Disasters Report (Vinck 2013) dedicated itself to the topic of humanitarian informa-tion and communicainforma-tion technologies (HCIT). It highlights the importance of various enabling technologies ranging from mobile phones and social media to big data. It dis-cusses different case studies where these technologies can be used for the effective disaster response and manage-ment along with various challenges that these technolo-gies entail. Next, we discuss different stages of a crisis and what role data plays in each of these.
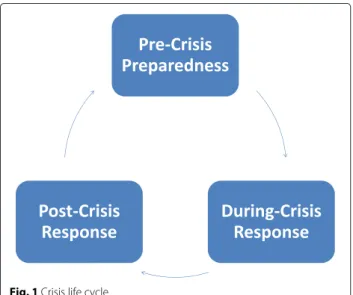
Crisis life cycle
The overall crisis life cycle can be divided and analyzed into three stages (Fig. 1) namely before, during, and after a crisis. Let us call the first stagePre-Crisis Preparedness
that deals with the in-advance preparation of a potential crisis (in terms of logistics, planning, and warehousing of emergency relief goods regionally and internationally) along with efforts for disaster risk reduction (Twigg et al. 2004). Big data analytics can be useful in this stage for emergency prediction either before the initiating event (such as an earthquake/tsunami) or as part of the unfold-ing of an ongounfold-ing crisis (such as prediction of the refugees’ flow in the aftermath of a natural disaster such as the Haiti earthquake). Any efforts focused on preventing impend-ing crises will also be part of this stage.
We call the second stageDuring-Crisis Responseand it deals with coordination (among aid agencies) in the after-math of a crisis to address any gaps or overlaps that may be affecting the effectiveness of the response. This stage also
Fig. 1Crisis life cycle
involves adjusting and monitoring aid to ensure account-ability and effective dispatch of resources so that it is available at the right time and at the right place.
Finally, we term the third stagePost-Crisis Responsethat deals with reporting, auditing, and accounting of the over-all humanitarian response. This stage looks at the crisis response in a more comprehensive, analytical and insight-ful way so that lessons are learnt and insights developed for any future crises. Big data can help ascertain the effi-cacy of relief work and make it more accountable by using actively acquired data (gathered through, e.g., unmanned aerial vehicles (UAVs) or social media). Big crisis data ana-lytics has the potential to transform all the stages of a crisis life cycle (i.e., pre-, during-, and, post-crisis) and can be useful for emergency prevention, preparedness, response, and recovery. Next, we summarize how our discussion in this paper is structured.
Road map
The focus of this article is on reviewing how big data ana-lytics and digital technologies can be used to respond in emergencies in ways that can mitigate or even avoid a crisis. In Section “Big data and crisis analytics”, we first explain what big (crisis) data is and how we can acquire it. In Section “Enabling technologies”, we discuss mod-ern technologies along with machine learning techniques that enable data-driven crisis analytics. In Section “The big crisis data ecosystem and case studies”, we present how the modern world is reshaping itself to create an ecosystem where crises can be fought based on big data along with two case studies that highlight the importance of such an ecosystem. In Section “Why big crisis data analytics is challenging?”, we discuss different challenges in the way of bid data-based crisis response. After pre-senting future directions in Section “Future directions for big crisis data analytics”, we finally conclude our paper in Section “Conclusions”.
Big data and crisis analytics
In this section, we first discuss, in detail, what is meant by big data. Why it is gaining so much importance these days; how it is collected, stored and used in the perspec-tive of crises and humanitarian emergencies. At the end of this section we explain what we mean by crisis ana-lytics, which is basically deploying different analytical and machine learning techniques on the big data collected during a crisis situation.
What is big data?
of all aspects of modern life due to technologies such as the Internet of Things (IoT); which deploy sensors, for example in the shape of wearable devices, to provide data related to human activities and different behavioral pat-terns. The commoditization of data collection with the advancement in digital technology has led companies to collect all kinds of data, such as the digital trail of an online user, the transaction history of a customer, and the call details record (CDR) of a mobile-phone user. Companies such as Facebook, Google, Twitter, Yahoo, and Microsoft routinely deal with petabytes of data on a daily basis. It is estimated that we are generating an incredible 2.5 quintillion bytes per day (Siegel 2013).
In order to understand what is new about big data based crisis analytics, we will have to understand, first, what big data is.“Big Data”refers to our emerging ability to collect, process, and analyze massive sets of largelyunstructured data—e.g., word documents, emails, blog posts, social, and multimedia data that can not be stored in an orga-nized fashion in relational databases (Leavitt 2010)—from a multitude of sources to find previously inaccessible insights. With the transformative role, big data has played in diverse settings, there is a lot of interest in harnessing the power of big data for development and social good. We can define big data to be data that exceeds the processing capacity of conventional database and analytics technol-ogy (in that the data is unstructured, too large or too fast). Now, we briefly discuss modern database technology that is being used to store big data.
Database technology for big data
As mentioned before, big data is dominantly unstruc-tured data. The traditional relational databases can not store such data, which require data to be structured (that resides in fixed fields, e.g., spreadsheets) and stored in a conventional relational sense. A novel approach is required to store and access unstructured data. NoSQL (or non-relational) databases have been developed for the said purpose (Leavitt 2010). As compared to rela-tional databases, NoSQL databases are distributed and hence easily scalable, fast, and flexible. Big compa-nies also use NoSQL databases, like Amazon’s Dynamo (DeCandia et al. 2007) and Google’s Bigtable (Chang et al. 2008), for data storage and access. One potential downside, though, in using NoSQL databases is that they usually do not inherently support the ACID (atomicity, consistency, integrity, and durability) set (as supported by the relational databases). One has to manually program these functionalities into one’s NoSQL database. Now, we describe what we mean by the termbig crisis data.
Big crisis data
Big crisis data refers, simply, to big data collected dur-ing crises or mass emergencies. Big crisis data, just like
big data, can be of two types:structuredandunstructured
(with the latter being predominant). It has been suggested that the biggest gap in big crisis data informatics cur-rently is in the extraction of structured information from the huge amount of unstructured information. Big data analytics is well-suited to deal with unstructured data: in fact, a major motivation of its development is the fact that traditional data tools are inflexible about structure and cannot process unstructured data well. In the following two subsections, we will first study the various sources of big crisis data followed by how big data analytics can be used to process this avalanche of information.
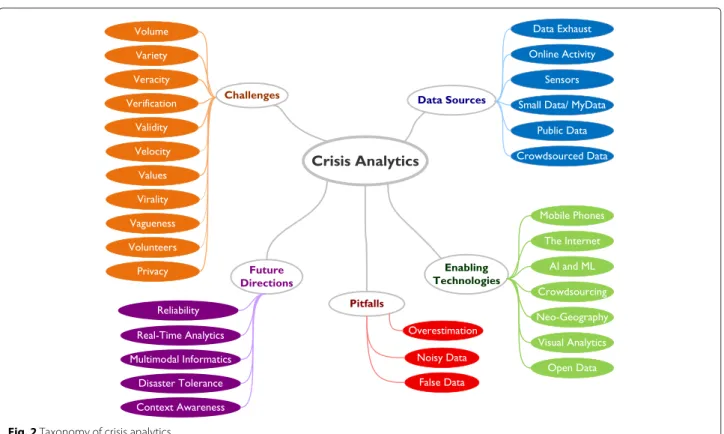
Sources of big crisis data
Here, we consider six different types of big data sources that, broadly speaking, principally drive the big cri-sis data revolution. These include data exhaust, online activity, sensing technologies, small data/MyData, pub-lic/governmental data, and crowdsourced data. This is illustrated in the taxonomy presented in Fig. 2. In this figure, apart from the data sources, the enabling tech-nologies, future directions, pitfalls, and challenges of crisis analytics (introduced later in this paper) are also shown.
Data exhaust
It refers to information that is passively collected along with the use of digital technology. Our lives—with our ubiquitous use of digital devices—are increasingly online and leave behind a traceable digital trail. The most impor-tant example of data exhaust for big crisis data analyt-ics is the mobile call details records (CDRs), which are generated by mobile telecom companies to capture vari-ous details related to any call made over their network. Data exhaust also includes transactional data (e.g., bank-ing records and credit card history) and usage data (e.g., access logs). A promising use of data exhaust in crisis ana-lytics is to use mobile money transactions1 where such services are established (as in Africa, e.g., the M-PESA (Big data in action for development 2014) is one of the most profitable banking services in Kenya). Most of the data exhaust is privately owned by organizations (such as mobile service operators); such data is mostly used in-house for troubleshooting and planning and is seldom shared publicly due to legal and privacy concerns.
Online activity
Fig. 2Taxonomy of crisis analytics
ground by the affected community, while Twitter is used mostly by the international aid community) (Munro and Manning 2012). One advantage of online data is that it is often publicly available, and thus it is heavily used by the academics in big crisis data research.
Sensing technologies
Sensing technologies mostly gather information about social behavior and environmental conditions using a number of sensing technologies. With the emergence of architectures such as the IoT (explained in the next para-graph), it is anticipated that sensor data will match or even outgrow social data soon. There are a number of sens-ing technologies such as (1) remote senssens-ing (in which a satellite or high-flying aircraft scans the earth in order to obtain information about it (Big data in action for devel-opment 2014)—e.g., for measuring the traffic, weather, or other environmental conditions); (2) networked sensing (in which sensors can perform sensing and can communi-cate with each other—as in wireless sensor networks); and (3) participatory sensing technologies (in which every-day devices—such as mobile phones, buses, etc.—are fit with sensors; in particular, modern phones are equipped with multiple sensors such as accelerometer, gyroscope, microphone, camera, GPS, and can effectively work as sensors). Various cyber-physical sensing systems—such as unmanned ground, aerial, and marine vehicles—can play an important role in disaster management. These
devices can act as an active source of big data by provid-ing on-the-ground information in the form of images or sensed data. Sensing data is mostly (but not always) pub-lic. Advances in open mapping technologies (such as the OpenStreetMap (Haklay and Weber 2008)) are helping in further democratizing the access to sensing data.
Now, we briefly discuss the Internet of things (IoT), which is a new field fueled by the hype in big data, prolif-eration of digital communication devices and ubiquitous Internet access to common population. In IoT, different sensors and actuators are connected via a network to various computing systems providing data for actionable knowledge (Manyika et al. 2015).Interoperability, which is the harmony of data (specifically its format) from one sys-tem with another, is a potential challenge in the way of IoT expansion. IoT finds its application in healthcare moni-toring systems. Data from wearable body sensory devices and hospital healthcare databases, if made interopera-ble, could help doctors to make more efficient (and near real-time) decisions in diagnosing and monitoring chronic diseases. On a bigger level, the health status of a local region can be monitored in real-time. We believe that this can be used to evaluate the efficiency of a healthcare mission in a region.
Small data and MyData
filtered and aggregated data. With big data, the units of sampling and analyses are vastly dissimilar (e.g., the unit of sampling is at the individual level, while the unit of analysis can be at the country level). In “small data” (Estrin 2014), even if the datasets are large, the unit of analysis is similarly scoped as the unit of sampling. Personal data, or “MyData”, can help optimize individ-ual human lives (in terms of health, productivity, etc.). There is ongoing research on how to use digital trails of information that users leave as they go about the rou-tines of their daily lives; there is emerging interest in using small data and MyData for personalized solutions such as those that focus on health (e.g., a startup named
Open mHealth(Open mHealth) led by the Cornell Tech’s professor Deborah Estrin (Deborah 2016)) and sustain-able development (e.g., the Small Data lab at the Cornell Tech. and the United Nations University (Small Data Lab - UNU; The Small Data Lab at Cornell Tech)). Hospitals now have started providing individual patients with access to their individual medical records data. The availability of health MyData can revolutionize healthcare through personalized medicine.
Public-related data
A lot of public-related data—that can be very valuable in the case of a crisis—is already being collected by various public/governmental/or municipal offices. This includes census data, birth and death certificates, and other types of personal and socio-economic data. Typically, such data has been painstakingly collected using paper-based traditional survey methods. In recent times, advances in digital technology has led people to develop mobile phone-based data collection tools that can easily collect, aggregate, and analyze data. Various open source tools such as the Open Data Kit (ODK) (Hartung et al. 2010) make it trivial for such data to be collected. While public-related data is not always publicly accessible, increasingly governments are adopting the Open Data trend, with which public access to public-related data is provided to promote their innovative usage and general accountability and transparency.
The trend of “open data” (Manyika 2013), i.e., public sharing of data from various public and private organi-zations in searchable and machine-readable formats, is a positive step towards data-driven humanitarian develop-ment. Governments, e.g., in the USA (Hoffmann 2012; The home of the U.S. Government’s open data) and the UK (The home of the U.K. Governmen’s open data), are increasingly adopting open data projects to fuel inno-vation and transparency. TheUnited Nations Global Pulse
(United Nations Global Pulse) initiative, by the Secretary-General of the UN Ban Ki-moon, has the explicit goal of harnessing big data technology for human development (Pulse 2012). Kirkpatrick, the director of the UN Global
Pulse innovation initiative, presents the concept of “data philanthropy” (Kirkpatrick 2013)—companies that gather massive amounts of data can volunteer with the UN so that their data, particularly mobile phone and social media data, can be harnessed to fight humanitarian crises such as hunger and poverty. Here, we note that data philanthropy, although aimed at the general public’s wellbeing, does not always imply that a database is made public. Organizations can directly partner with the UN to provide their data for its missions.
Another related example of open data is International Aid Transparency Initiative (IATI) (International Aid Transparency Initiative). This initiative aims to make the flow of aid from the donor to the developing countries and the process of development transparent. Organiza-tions such as NGOs share their data in a standard IATI format (an agreed electronic XML format) (IATI Stan-dard) that can be accessed by other similar organizations to gain insights or to compare their own data with it.
Crowdsourced data
Finally, the method of crowdsourcing—in contrast with the aforementioned sources of big crisis data—is an active data collection method. In crowdsourcing, applications actively involve a wide user base to solicit their knowledge about particular topics or events. Crowdsourcing plat-forms are usually publicly available and are widely used by big crisis data practitioners. Crowdsourcing is differ-ent from the traditionaloutsourcing. In crowdsourcing, a task or a jobisoutsourced but not to a designated pro-fessional or organization but to general public in the from of an open call (Howe 2006). In this way, crowdsourcing usually combines (a) digital technology, (b) human skills, and (c) human generosity and it is a technique that can be deployed to gather data from various sources such as text messages, social media updates, blogs, etc. Social media, in particular, provide good opportunities for disaster relief efforts that can be planed based on data collected from these sites (Gao et al. 2011). This data can then be har-monized and analyzed in mapping disaster-struck regions and to further enable the commencement of search oper-ations. As described before, this technique helped during the 2010 Haiti earthquake that consequently gave rise to
digital humanitarians(Meier 2015; 2014).
Big crisis data analytics
techniques, along with digital platforms (such as mobile phones/Internet), for efficient humanitarian response to different crises. There are many thematic applications of big crisis data including (1) data-driven digital epidemiol-ogy (in which public health research is conducted using CDRs and social media) (Salathe et al. 2012); (2) pop-ulation surveillance and urban analytics (Boulos et al. 2011) (in which big crisis data is used for tracking the movement of crisis-affected population during a crisis); (3) crisis informatics and sociology (Palen et al. 2007) (in which data, along with participatory mapping and crowdsourcing technology, is used for analyzing the soci-ological behavior of the affected community through behavioral inference and “reality mining”—that is data mining to extract and study social patterns of an individual or a group of individuals).
We can also consider the various different big crisis analytics tasks that can be performed on big crisis data such as (a) various discovery tasks—e.g., clustering (to obtain natural groupings), outlier detection (to detect any anomalies), or affinity/correlation analysis (to detect co-occurrence patterns); and (b) various predictive tasks— such as classification (in which a category is predicted), regression (in which value of a continuous variable is predicted), and finally recommendation (in which some preference is predicted).
Enabling technologies
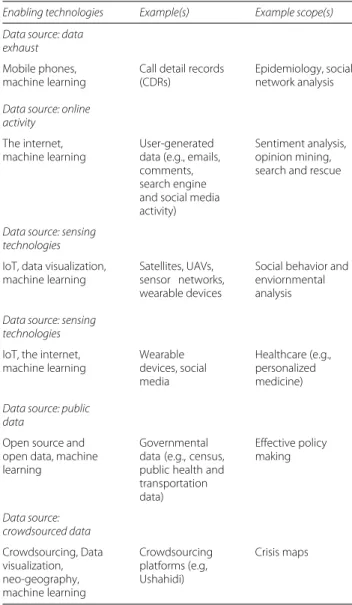
After explaining big crisis data, various sources that gen-erate this data and big crisis data analytics, we are in a position to discuss various enabling technologies and techniques that either generate data or help in analyzing it. These technologies are shaping today’s age in which data driven crisis response and humanitarian develop-ment are being considered the future of human progress and wellbeing. Table 1 can be consulted to gain an insight into the relation between different big crisis data sources (discussed in the previous section) and corresponding enabling technologies and example scopes where (big data driven) actionable knowledge can be applied.
Mobile phones
The rapid adoption of mobile technology has been unprecedented. With almost universal service of mobile phone technology2, smartphones are rapidly becoming the central computer and communication devices in the lives of people around the world. Modern phones are not restricted to only making and receiving calls—current off-the-shelf smartphones can be used to detect, among other things, physical activity (via accelerometers); the speech and auditory context (via microphones); location (via GPS) and co-location with others (via Bluetooth and GPS) (Lane et al. 2010). This transforms the modern crisis response since modern smartphones can now act
Table 1Big crisis data sources and enabling technologies
Enabling technologies Example(s) Example scope(s) Data source: data
exhaust
Mobile phones, machine learning
Call detail records (CDRs)
Epidemiology, social network analysis
Data source: online activity
The internet, machine learning
User-generated data (e.g., emails, comments, search engine and social media activity)
Sentiment analysis, opinion mining, search and rescue
Data source: sensing technologies
IoT, data visualization, machine learning
Satellites, UAVs, sensor networks, wearable devices
Social behavior and enviornmental analysis
Data source: sensing technologies
IoT, the internet, machine learning
Wearable devices, social media
Healthcare (e.g., personalized medicine)
Data source: public data
Open source and open data, machine learning
Governmental data (e.g., census, public health and transportation data)
Effective policy making
Data source: crowdsourced data
Crowdsourcing, Data visualization, neo-geography, machine learning
Crowdsourcing platforms (e.g, Ushahidi)
Crisis maps
as general-purpose sensors and individuals can directly engage in the disaster response activities using some com-bination of cloud-, crowd-, and SMS-based technologies. This participatory trend in which the aid efforts are driven and centered on people—and the fact that aid workers have to work with large amounts of diverse data—makes modern disaster response completely different from tradi-tional approaches.
the time at which a call/message was received, as well as the identity of the cellular tower with whose antennas the phone was associated with—using the information con-tained in the CDR, the approximate locations of the users can be easily determined. The use of CDR for localization can help the study of mobility, epidemiology, and popu-lation dynamics at an unprecedented scale with very low cost. CDRs are attractive for mobile data analytics since (1) they involve negligible marginal cost (as the telecom companies are already collecting them); (2) they provide real-time information; (3) they are already working at a very large scale (as all the calls received and sent are being logged). The limitation of CDRs are that (1) the calls are recorded when they are made thus making the data sparse in time; (2) they can provide coarse-grained spatial granularity.
Let us explain the importance and applicability of CDRs with the help of an example scenario. As it usually happens that large disasters are often followed by large population movement. This complicates the task of humanitarian relief (in which there is the need to get the aid to the right people, at the right place and at the right time). CDRs have been used by digital humanitarians during various crises (such as the non-profitFlowMinder’s (Flowminder) work with anonymous mobile operator data during the Haiti earthquake to follow the massive population displace-ments) to not only point out the current locations of popu-lations, but also predict their future trajectory (Bengtsson et al. 2011). FlowMinder used the same mobile analytics methodology during the cholera epidemic later that year to enable rapid monitoring of population movement from the outbreak area (Bengtsson et al. 2015).
Mobile phones are also excellent tools for gathering survey data (and can cheaply conduct socio-economic and health surveys). Mobile phone-based data collection can reverse the trend established in traditional humani-tarian organizations on relying on paper documents. To facilitate such mobile-based surveys, various ;tools have been developed—such as ODK (Hartung et al. 2010), which is a free and open-source set of tools that pro-vide an out-of-the-box solutions for building, collecting, and aggregating data. ODK can help organizations author, field, and manage mobile data collection solutions. Mobile phones can also be used for intelligence gathering using the crowdsourcing technique. In addition, mobile-based analytics can also act as surrogates for official statis-tics (e.g., on public health and food security) when not available or when more real-time information is needed.
With the all abovementioned benefits provided by the data collected from mobile phones, it is also of utmost importance to consider the potential harms and chal-lenges that ensue this process. Taylor in (Taylor 2014) mentions that the analysis of data gathered from mobile phones has two dimensions: virtual and physical. The
virtual dimension involves the interpretation of data whereas the physical dimension implies the monitoring, governing, and controlling of population. According to Taylor, a global standard to ensure sufficient privacy is lacking in mobile data analysis. Mostly individual enti-ties are self-regulating themselves with custom made anonymization techniques which according to him is not enough. The author stresses on creating a balance between theright to be visible(i.e., in gaining benefits from the analysis performed on their mobile data) andright to be hidden(i.e., where there is minimum risk of the peo-ple’s privacy and freedom being compromised). Another important argument raised by the author in (Taylor 2014) is that there should be an (incentivised) environment where social scientists could work in unison with the data scientists so that a standard framework of privacy for data analysis can be ultimately realized. As an exam-ple, McDonald in (McDonald 2016) also emphasizes the need for a standard framework to ensure the privacy of already vulnerable population of a crisis struck region for whom data is gathered and analyzed such as during epi-demic breakouts like Ebola. McDonald describes that a lack of legal framework renders the data analysis pro-cess for a crisis incongruent as different aid organizations could react to a problem in non-organized and unco-ordinated manner. There is also a risk of legal lawsuits against governments and NGOs that expropriate data of a region, specially CDRs that are rich with personal infor-mation despite the anonymization processes, whereas the local constitutional orders forbid doing so. This was what happened in Liberia during the Ebola outbreak in which organizations could not gain access in a fast enough and legal way which resulted in more spreading of the disease.
The internet, open source, and open data
These days the ubiquitous proliferation of the Internet connectivity is enabling the new Internet-based economy that is spawning a paradigm shift in terms of how insti-tutions operate. The “open source” culture (the paradigm underlying projects such as Linux and Wikipedia) that has been popular on the Internet has ushered in a new era that relies more on collaboration and volun-teerism (than on formal organizations). Instead of a rigid structure constrained by scarcity of human resources, the new paradigm is driven by abundance and cognitive surplus (due to technology-driven pooling of volunteer human resources). The open source trend is also visible in humanitarian development in various manifestations such as digital humanitarianism, user-generated information, participatory mapping, volunteered geographic informa-tion, open source software (such as OpenStreetMap
data from disparate sources and create amashup(which is defined as a web page/application that uses or com-bines data or functionality from multiple existing sources to create new services) (Initiative et al. 2010).
Another important trend emerging in the modern era is the unprecedented commoditization and opening up of data. A number of countries from all over the world (more than 40 countries in 2015) have established “open data” initiatives to open all kinds of datasets to public to promote innovative use of such data by volunteer data scientists and thereby lead to more transparency, less cor-ruption, and economic development (Sanou 2013). Open data can also lead to improved governance through the involvement of public and better collaboration between public and private organizations. As an example, in the aftermath of the Haiti crisis, volunteers across the world cobbled together data from various sources—including data from satellite maps and mobile companies along with information about health facilities from the maps of the World Health Organization, and police facilities from the Pacific Disaster Center—and plotted them on open source platforms such as the OpenStreetMap. The impor-tance of OpenStreetMap can be gauged from the fact that data from it eventually became the most reliable infor-mation source that was widely used by both governments and private aid workers for supplies to hospitals, triage centers, and refugee camps.
The real power of the open data will start to emerge when the data is exchanged in standardized formats through which we can link, merge, and repurpose data according to our needs. The term Linked Data is used to refer to the recommended best practices for expos-ing, sharexpos-ing, and connecting pieces of data, information, and knowledge on the Semantic Web using standard data sharing formats such as uniform resource identifier (URI) and resource description framework (RDF) (Bizer et al. 2009; Heath and Bizer 2011). Linked Data has been envisioned as an essential component of the vision of Semantic Web (pioneered by Berners-Lee, the inventor of the World Wide Web). With streaming sensing devices becoming an important source of big crisis data, Linked Stream Data can be created by integrating the sensed data with data from other sources by utilizing their semantic descriptions. Despite its enormous potential, there is little exploration Linked Stream Data, which can be consider as a potential open issue for the future work.
Visual analytics and neo-geography
Visual analytics is an interesting branch of big data explo-ration that borrows techniques from computer vision and geospatial technologies which can be used to deal with crisis images and videos. The aim is to support analytical reasoning through visual interfaces. With geo-graphic data being critical for disaster response and
sustainable development, the ability to visualize and map geographic data becomes very important. Neo-geography (“new geography”) prominently uses the Web 2.0’s demo-cratic approach of participatory mapping along with crowdsourced user-generated volunteered geographic content (Turner 2006). Unlike conventional maps, with neo-cartography (i.e., “new cartography”), the data is not controlled by an elite few. A concrete neogeogra-phy/neocartography example is the participatory mapping approach taken by the free and open source software OpenStreetMap, which is based on geographical data collected from volunteers. The importance of Open-StreetMap can be ascertained from the fact that soon after the earthquake, OpenStreetMap had become the de facto source of data to map the crisis afflicted parts of Haiti for most of the UN agencies (Initiative et al. 2010). A related project, which aims to support the operation of OpenStreetMap, is Missing Maps (Missing Maps). This project focuses on the developing world and aims to map the most vulnerable places of such regions. It provides a good resource for the NGOs and other aid agencies to get the relevant map-related information to steer their aid activities in the right direction. The novel trends of newgeography and neocatrography have encouraged the development of the field of “crisis mapping” which we discuss next.
Crisis mapping
Crisis mapping (Ziemke 2012) is the newly developed interdisciplinary research field. The crisis maps con-tain up-to-date satellite imagery that are often collected and annotated using crowdcomputing and crowdsourc-ing techniques (that are discussed later). The important feature of these maps are that they are real-time source of information and provide effective situational aware-ness with respect to spatial and temporal dimensions by giving a dynamic bird’s-eye view to guide the response efforts. The process of crisis mapping is overseen by ded-icated organizations such as the International Network of Crisis Mappers (CrisisMappers 2016b) (an organiza-tion, co-founded by Patrick Meier and Jen Ziemke in 2009, which has more than 6000 members worldwide) and man-aged through Crisis Mappers Humanitarian Technology Network; crisis mapping even has its own international conference (the International Conference of Crisis Map-pers, ICCM).
to improve peacekeeping operations through collection of mapped reports from field staff and local community; (3) by PakReport.org (Chohan et al. 2012; Pakreport 2016) to support Pakistanis in collecting, mapping, and sharing crisis information during the floods in 2010.
Another example of crisis mapping is HealthMap
(HealthMap) that combines data from different sources to create a unified and comprehensive picture of the cur-rent global state of infectious diseases. Healthmap, which is accessible on the web and on mobile devices, utilizes a number of informal online sources for disease outbreak monitoring and real-time surveillance of emerging pub-lic health threats. The HealthMap is widely used, with the World Health Organization (WHO) (Heymann et al. 2001; Wilson and Brownstein 2009) and regional groups like the European Center for Disease Prevention and Control being prominent users who utilize HealthMap for digital disease detection.
Satellites are also used to capture high-resolution imagery of ground locations to provide near-real-time sit-uational awareness to the concerned authorities about a potential crisis. As an example, the Harvard Humanitar-ian Initiative (HHI) in 2010 monitored and analyzed the visual imagery captured by the Satellite Sentinel Project (SSP). The HHI analysts monitored the precarious situa-tion related to mass atrocities along the border of Sudan and South Sudan and provided a real-time public reports of the situation to be used by the government and aid agencies. The HHI team in (Raymond et al. 2013) summa-rizes its experience with the SSP project. The HHI team concludes in this report that although the SSP project provided novel ways of collecting information related to conflict zones, the overall success of this endeavor was not a significant thing. The overall analysis of the HHI reports were used in a biased fashion and moreover by making all the reports public inflicted the risk this infor-mation being exploited by the armed groups involved in the conflict. The authors of (Raymond et al. 2013) emphasize the need for a standard framework that can be deployed on global basis in which sensing technologies like SSP project can be used in a secure and responsi-ble manner (Think Brief: Building data responsibility into humanitarian action 2016).
Leveraging the wisdom and the generosity of the crowd
Broadly speaking, there are only a few ways we can go about problem solving or predicting something: (1) experts, (2) crowds, and (3) machines (working on algo-rithms; or learning from data). While experts possess valuable experiences and insights, they may also suffer from biases. The benefit of crowds accrues from its diver-sity: it is typically the case that due to a phenomenon known as “the wisdom of the crowds” (Surowiecki 2005), the collective opinion of a group of diverse individuals is
better than, or at least as good as, the opinion of experts. Crowds can be useful in disaster response in at least two different ways: firstly, crowdsourcing, in which disaster data is gathered from a broad set of users and loca-tions (Boulos et al. 2011); and secondly, crowdcomputing, in which crowds help process and analyze the data so that it may be effectively displayed and thereafter utilized (Meier 2014).
Crowdsourcing
Crowdsourcing (as discussed in detail in Section “Crowd-sourced data”) is the outsourcing of a job traditionally per-formed by a designated agent (usually an employee) to an undefined—generally large group of people—in the form of an open call. In essence, crowdsourcing is the use of the open source principles to fields outside of software. Crowdsourcing has been used in the context of disaster response in multiple ways (Munro 2013): including crowd searching, microtasking (explained next), citizen science, rapid translation, data cleaning and verification, develop-ing ML classifiers, and election monitordevelop-ing (Boulos et al. 2011).
Crowdcomputing (crowdsearching and microtasking) Crowdcomputing is a technique that utilizes crowds for solving complex problems. A notable early use of crowdcomputing was the use of crowdsearching (a sub-problem of crowdcomputing where crowds participate in a search problem) by MIT’s team at the DARPA’s “I Spy a Red Balloon” network challenge (Tang et al. 2011). The task was related to the geo-location problem in which the participants were to find 10 red weather balloons that were at secret locations across the continental US The MIT’s team solved a time-critical problem in the least time using an integration of social networking, the Internet, and some clever incentives to foment crowd collaboration.
to Typhoon Pablo in the Philippines—have been devel-oped. However, since Crowdcrafting was not optimized for humanitarian aid, the big crisis data community has developed humanitarian-aid-focused microtasking tools, which we will discuss next.
MicroMappers 2016, developed at the Qatar Com-puting Research Institute (QCRI), was conceived as a fully customized microtasking platform for humanitar-ian response—a platform that would be on standby and available within minutes of the DHN being activated. MicroMappers is a platform for tagging the mass of online user-generated multimedia content (in various formats such as text, images, videos) related to a disaster to estab-lish its importance. Micromappers performs this tagging operation through volunteer digital humanitarians who leverage a series of microtasking apps called Clickers to focus on different tasks. As an example, the Trans-lateClicker,VideoClicker,ImageClicker, andTweetClicker
focus on the microtasks of translating, classifications of videos, images, and Twitter tweets.
Artificial intelligence and machine learning
With humans and experts, the bottleneck is human nature (which is fickle, humans can get bored and make mis-takes). Machines, on the other hand, do not suffer from boredom and can work on menial algorithmic tasks with high throughput and no error. Machines can uti-lize well-crafted algorithms for various problems, whose solutions can be exactly defined step by step. However, for many (mostly non-trivial) problems, exact algorithms are not known; for such problems, the machine learn-ing approach—which is based on learnlearn-ing from data—is appropriate. In humanitarian technologies, there is a need to combine the wisdom of the crowd with the efficiency and automation of artificial intelligence (AI) and machine learning (ML). While crowdsourced technologies, such as crowdcomputing, will continue to play a big role in pro-cessing big crisis data, but crowdcomputing alone will not be enough—the efficiency of the crisis response can be significantly enhanced if the crowds are also comple-mented by the machines. AI/ML techniques are especially important since they can lead to automated processing and extracting useful information from big crisis data (and thereby compensate for the lack of human experts). Broadly speaking, we can categorize ML algorithms into two types:supervisedandunsupervised.
Supervised learning
It is a subset of ML algorithms, that uses techniques to infer a function (or generalize a relationship between the input and the output) from the given training data that contains labeled examples of the data and the correspond-ing correct category. A number of supervised learncorrespond-ing techniques exist including the popular and easy to use
techniques of support vector machines (SVM) and ran-dom forests. Supervised learning works very well when labeled data is available. However, it fails to scale to different settings (in terms of the type of crisis and socio-geographic setting)—since the classifier generated by the ML algorithm is tightly coupled with the data being used and cannot be reused when the setting is changed. The need of a supervisor (or a human who will produce the labeled data) limits the use of supervised ML.
Unsupervised learning
Unsupervised learning, on the other hand, refers to the set of ML techniques that do not depend on the availability of training data; such techniques can automatically find hid-den structure in unlabeled data. Clustering is an example of unsupervised learning. Clustering differs from classifi-cation in that classificlassifi-cation aims to assign data instances to predefined classes, while clustering aims to group-related data instances together without labeling them. Common examples of unsupervised learning techniques are the K-means and expectation-maximization (EM) clustering algorithms. Unsupervised learning can also be used for automatically learning features for the data. Unsupervised learning is becoming more important in the big data era to alleviate the inconvenience of handcrafting features and providing labeled examples.
In the perspective of unsupervised learning, the new and emerging field of deep learning holds a lot of promise. Deep learning deals with deep and complex architectures (Bengio 2009; Schmidhuber 2015). There are multiple processing layers in these architectures. Each layer gen-erates non-linear response against data that is fed into it as an input. The data given as input is processed by several small processors that run in parallel. These pro-cessors are termed asneurons. Deep learning has shown promise to be efficient in pattern recognition, image, and natural language processing (Collobert and Weston 2008). Deep learning applications range from healthcare to the fashion industry (Knight 2015). Many techno-logical giants such as Google, IBM, and Facebook are deploying deep learning techniques to create intelligent products.
AI/ML domain areas relevant for crisis informatics
The two most important AI/ML application domains that are relevant for crisis informatics are computational lin-guistics and computer vision, which we discuss below:
using sentiment analysis and opinion mining (Pang and Lee 2008). While there have been many advances in the field of natural language processing (NLP), applying NLP for crisis informatics is still non-trivial. Computational linguistics based AI techniques have been utilized exten-sively in humanitarian responses to many previous crises. As an example, theCrowdFlowerplatform (CrowdFlower 2016d), which provides services for crowdsourced trans-lation, has been used in the response to the Haiti crisis (by the Mission 4636 project (Mission 4636)) and to the Pakistani flood crisis (by the PakReport project (Chohan et al. 2012; Pakreport 2016)). There is a lot of work needed and research scope for applied big crisis data compu-tational linguistics. One problem is that compucompu-tational linguistics systems optimized for one language or mode of communication do not generalize to others. For example, it has been reported that systems optimized for one type of short message service (Twitter or SMS) may not work well for the other. In addition, systems optimal for one language are unlikely to be optimal for other languages (Munro and Manning 2012).
Computer vision There is a lot of interest in using AI-based techniques from the field of computer vision for automated analysis using aerial images (via UAVs or satel-lites). This interest has received a further fillip through the “Imagery to the Crowd” initiative by the Humanitarian Information Unit at the US State Department (Map Give: imagery to the crowd)—this initiative aims to democra-tize access to high-resolution commercial satellite images purchased by the US government in a format that public volunteers can easily map into an open platform such as the OpenStreetMap. There are various projects focused on automated analysis of global high-resolution satel-lite imagery (e.g., projects on this topic at the European Commission’s Joint Research Center (JRC)).
Tomnod (Tomnod) (owned by the satellite company DigitalGlobe 2016) and MicroMappers 2016 are micro-tasking platforms that can be used for computer vision applications. Unlike MicroMappers, which handles multi-ple media (such as text, images, video), Tomnod is exclu-sively focused on microtasking satellite imagery. Tomnod provides an ability to slice and dice the satellite imagery into (potentially millions of ) very small micro-images. To demonstrate the value of a satellite image microtasker, consider the use of Tomnod for tracking the missing Malaysian Airlines flight 370 incident in 2014. Within days of the launch of the project on Tomnod, the crowdsearch-ing participants had swelled to 8 million volunteers, who had tagged more than 15 million features of interest in 1 billion satellite images in just four days. Tomnod then used an indigenous CrowdRank algorithm for deciding which of the tagged features to escalate to on-the-ground rescue times through DigitalGlobe (by looking at the consensus
of the taggers that have the highest levels of crowd con-sensus.)
Interfacing human and artificial intelligence
Previously, we have seen that analytics can be performed through exploiting three sources of intelligence: humans, crowds of humans, and machines (that are either pro-grammed by humans or learn from data). The most potent approach to big crisis data analytics is to leverage both human and machine intelligence. Crowds are better at finding patterns while machines can process faster than humans (and even crowds). This hybrid approach can exploit the complementary competencies of humans or crowds and machines: in particular, with such a hybrid approach both the pace and accuracy of crisis analytics can be improved.
This implies that in humanitarian aid, AI/ML algo-rithms will not obviate the need of human involve-ment. AI/ML can be used to ensure that valuable human resources are optimally utilized: this is done by outsourc-ing the onerous grunt work to the machines and takoutsourc-ing the onus off the human beings for routine things (that the machines can do more efficiently). Human beings can then focus their time on assisting algorithms in codi-fying unstructured information and recognizing unusual patterns. Also, people from diverse set of fields can get involved in the analysis of visual reports—which are, let us say, produced after an ML algorithmic operation finishes running on a dataset. In this manner, the technological savvy personnel will only be a part of a larger team that may comprise people from as diverse fields as healthcare, public policy making, and government agencies etc.
The need for such a hybrid technology (combining human and machine learning) is stronger in areas such as computational linguistics and NLP in which the data has vague semantics (Munro et al. 2012). While NLP is better done through ML/AI, hybrid ML systems in which human feedback is incorporated currently perform much better than pure ML-based NLP systems. A grand chal-lenge for the AI-based NLP research is that the developed tools do not generalize to different settings (in terms of languages, modality of data, and the type of crisis). The current way of building specialized tools is both expensive (in time, money, and resources) as well as non-scalable (since there is no reuse of existing software). With the lack of total automation through current AI tools, the hybridization of ML and humans is especially needed when humanitarian workers are working in less resourced languages.
The big crisis data ecosystem and case studies The humanitarian response ecosystem principally includes two kinds of actors. Firstly, traditional human-itarian groups, which include groups such as the International Committee of the Red Cross (ICRC), United Nations Office for the Coordination of Humanitarian Affairs (UNOCHA), United Nations High Commissioner for Refugees (UNHCR), as well as non-government orga-nizations (NGOs) like Doctors Without Borders (also known as MSF), World Vision, and Care International etc. Secondly, digital humanitarian groups, exemplified by the DHN —which was activated by the UNOCHA—whose aim is to empower a technology-enhanced 21st century humanitarian response; this is achieved by forming a con-sortium of volunteer and technical communities (called V&TCs) (Initiative et al. 2010), which then interface with formal humanitarian organizations to aid their response.
More specifically, the digital humanitarians can assist in coping with the big crisis data overload by tracking media (e.g., by monitoring social networks); software develop-ment for producing programs to organize and streamline crisis response; performing statistical analysis on data; mapping data; and translating local crowd media so that its accessible more broadly. A number of V&TCs exists such as Translators Without Borders (Translators without borders), Geeks Without Bounds, Datakind and ESRI etc. In addition, a number of technology-focused organiza-tions (such as the SBTF 2016, OpenStreetMap 2008, GIS-Corps, CrowdFlower 2016d, Crisis Mappers 2016b, Crisis Commons 2016a, MapAction) have sprouted up that uti-lize big crisis data techniques for remotely accelerating humanitarian assistance through a hybrid of technology, collaboration, and volunteerism.
Also relevant to big crisis data analytics are the many
big data for development initiatives that focus on min-ing, understandmin-ing, and harnessing data for improving
the world in both crisis settings (e.g., by providing data-driven assistance) and non-crisis settings (e.g., for battling hunger and poverty). Such initiatives overlap with the digital humanitarian initiatives and include (1) social computing groups (such as the UN Global Pulse, and QCRI); (2) groups initiated by for-profit companies (such as Google.org—through it’s Google Crisis Response, Google People finder, and Google Crisis Map projects, and Microsoft Research); and (3) academic humanitar-ian initiatives (the MIT Humanitarhumanitar-ian Response Lab, and, Harvard Humanitarian Initiative and Peace Informatics Lab in The Hague, Netherlands); and (4) non-profits such as DataKind (formerly, Data without Borders).
We now discuss two case studies: the first case study is about the ongoing migrant crisis that is caused by civil war in Syria. Secondly, we discuss the application of big data in the filed of healthcare. These case studies high-light the important positive role that big data plays in mass emergencies and humanitarian wellbeing and shed light on the importance of the development of an effective big data-driven crisis response ecosystem.
Case study: migrant crisis
Here, consider a case study of the recent migrant crisis— brought squarely in the world’s limelight by the case of Aylan Kurdi. Aylan, a three-year old Syrian toddler, was tragically found lying face down on a Turkish beach in 2015. He was washed ashore lifeless after he, led by his mother and brother, had attempted in desperation to reach the Greek island of Kos in a dinghy. The heart-wrenching image of Aylan, which rocketed around the world through social media, galvanized considerable pub-lic attention to the refugee crisis, highlighting the extraor-dinary risks migrants take to escape various crises. Aylan was able to attach a human face to the problem of migrant crisis, helping vitalize the international response to the problem. Around the world, there are millions of refugees (including many kids like Aylan) taking comparable risk to flee from war/violence to safer pastures. The various stakeholders around the world are looking towards big data technology to play an important role in thwarting human tragedies.
Aleppo, the industrial capital of Syria, is one of the most affected cities in the conflict. Neighborhoods all over the city are divided among, and under the control of, Syrian government, militia and rebel parties actively engaged in fighting with one another. This act has caused many civilian casualties and displacement. Before any response, it is imperative for the aid agencies to get the sense of the dynamics of such a region. If the conflict is mapped
sharing services, mapped the dynamics of the conflict in Aleppo in 2014 (Caerus 2014; Mapping the conflict in Aleppo 2014). Caerus deployed a team of locals, equipped with tools connected to cloud storage services, to survey local residents of the city of Aleppo over the period of 4 months (September 2013 to January 2014). This survey included the opinion of people about the government and rebel forces, position of checkpoints (established by gov-ernment and rebels at different roads of the city), status of bakeries and the status of a neighborhood (in terms of which entity controls it). All the data was analyzed through First Mile Geo and ahyper-local time-seriesmap of the region came out as a result. This map showed the people’s opinion about who is right in their claims in this conflict (to which a vast majority said “no one”), strongholds of rebel forces (which spread in the eastern side of the city) and government (largely in the western side of the city). More details on this project, and the related interactive maps can be seen at the link provided in reference (Caerus 2014), the data collected for this project is also available to download for research purposes.
This information provides the status of the political sit-uation of the city. The information about the checkpoints tells about the public movement, which is strictly con-trolled and restricted through these checkpoints. During the conflict, the government forces particularly attacked the bakeries in the rebel-held areas. This resulted in food shortages. People in the rebel-held area had to resort to indirect means and routes to obtain bread to survive. The information related to bakeries combined with that related to checkpoints let the aid agencies know about possible areas where there is, or will be a, food shortage.
May people are displaced, from all over Syria, who are forced to leave their country in search of immediate shel-ter and assistance. The most likely target for the refugees to go to are the countries in the immediate neighbor-hood of Syria. Jordan (Syria’s neighbor in its South) hosts more than half a million Syrian refugees. It is critical that the right and real-time information about the loca-tion, type, and capacity of aid agencies are communicated to the refugees. Such type of information is important for the humanitarian organizations as well. Through this information each agency could know what other agency is working on so that double response to the same prob-lem can be avoided. About 60 such agencies have been in Jordan to assist the incoming Syrian refugees.
Besides Jordan, a large number of people are traveling to the European countries often through dangerous land and marine routes. Many go missing, and unfortunately a few also die during this process. It becomes very difficult to reconnect the separated people of a family. Reconnect-ing is especially rendered difficult, as the displaced people mostly remain mobile, moving from one place/camp to another. There are also delays and language barriers in
registration processes. To overcome this difficultly, at least to some extent, an initiative taken by the Red Cross soci-ety by the name ofTrace the Face(Trace the Face). This is a website that collects data in the form of photographs and publishes photos of the people who are looking for their families and the missing people whose families are looking for them. Besides being published online, these pictures are printed on posters that are hung all over Europe espe-cially in places where the migrants gather. In this way, the broken family links are restored throughcrowdsourcing.
Case study: healthcare
We now highlight the importance of big data and the establishment of a data driven healthcare ecosystem. As it usually happens that a patient might be seeing different specialists for, seemingly, different medical reasons. These specialists, then further, can prescribe different types of clinical tests resulting in different kinds of results. If, how-ever, some protocol or a system is developed to integrate these fragments together and run analysis on them col-lectively then a clear and big picture of a patient’s current health can be extracted. If the issue of fragmentation (Elhauge 2010) (i.e., data having heterogenous formats and residing at potentially disconnected silos) is resolved then this can not only speed up the diagnostic process but also has the ability to provide personalized treat-ment (realization and the application of small data and MyData—discussed in Section “Small data and MyData”) that is most suitable for the patient under consideration. It is also important to address the issue of fragmentation for different NGOs and field health workers responding to a crisis. So that data collected by different organizations or teams can be corroborated to avoid double response in which two entities redundantly respond to the same problem.
call anoverdiagnosis. Imagine a situation where there is a lot of related data of many similar cases in a database and a computational model is present that can catego-rize a patient and predict a potential trajectory that his current state of disease will follow. In this way, a lot of hassle can be avoided and a personalized course of treat-ment can be prescribed. This approach eliminates the guess work, that is solely performed based on a medical practitioner’s memory and replaces it with computational reports crafted after integrating huge amounts of data from various related sources that range from pathological clinical tests to diagnoses from different medical experts.
There is a healthy aspect ofdemocratizationof health data (Lohr 2015), which implies that by combining med-ical and the data science, the study of disease has the potential to flourish. This can lead to a coverage that involves a whole country to construct aLearning Health System (LHS)(Friedman et al. 2014) in which stakeholders from government, healthcare, engineering and technol-ogy are brought together to analyze the prevailing health situation/emergency, in a country, more accurately and fight diseases/epidemics fast. The creation of such ecosys-tem will have the capability to establish an environment in which research and clinical practice are not performed in isolation; instead new research and analysis are directly applied to patients in a near real-time manner. If we expand this notion, then the whole world can be mon-itored and the present state of any of the world’s coun-tries health can be analyzed and the early warning signs of imminent viral epidemic outbreaks can be predicted and/or detected.
IBM’s Watson has been developed by the IBM as the realization of a fully advanced cognitive computing sys-tem. Watson, as opposed to the current AI-based comput-ing mechanisms, does not look for key-words in a line of text to make decisions. Watson combines machine learn-ing, natural language processlearn-ing, and statistical analysis (IBM 2015) to glean context-basedinformation from all the data that is fed into it. One of the most important applications of Watson is expertise scaling and democ-ratization, especially benefitting the healthcare field. It manages information and bridges it among the experts of a field helping them to make more informed and relevant decisions quickly.
Why big crisis data analytics is challenging? The “Vexing Vs”
The technical challenges associated with processing big data have traditionally been summarized using the four Vs: (1)volume(large amounts of data that cannot be pro-cessed on a single machine or with traditional database tools); (2) variety (data in many formats: structured, semi-structured, and unstructured—with mostly the data
being unstructured); (3) velocity (streaming data, with milliseconds to seconds to respond); and (4) veracity
(uncertainty in the data being “true” or consistent with reality). With big crisis data (such as social media), the list of “vexing Vs” is even longer: we also have to deal with (5)vagueness(dealing with natural language); (6)virality
(understanding cascading crisis information); (7) volun-teers(motivating and coordinating digital volunteers); (8)
validity(mitigating the biases and pitfalls of social media); (9)values(ensuring privacy and ethical use of crisis data); and finally, (10) visualization (how to best visualize big crisis data such as crisis maps). We will cover some of these vexing Vs next; for the sake of brevity, we focus only on a subset of these challenges.
Volume and variety
The sheer volume of big crisis data makes its analysis very challenging. Just like the absence of information can debil-itate rescue efforts, the overflow of information (as seen in voluminous big crisis data) can derail crisis response efforts. Humanitarians working with this tsunami of data face a difficult situation: their efficiency can benefit from the crisis data, but the high volume makes big data dif-ficult to tame—humanitarians working with big data are akin to a thirsty person drinking from a fire hose. The volume can be overwhelming since the data is not being provided only by the hordes of ordinary citizens, but also from other sources (such as government and journalists). As an example of voluminous big crisis data, there were more than 20 million tweets with the hashtag of Sandy within less than a week about the deadly Hurricane Sandy that swept through the Caribbean and the East Coast of the USA (Twitter).
Veracity, verification, and validity
The problem of data veracity addresses the need to ver-ify humanitarian/crisis data, so that the credibility of data sources is established (e.g., by verifying metadata— which is data about data, that describes the content and context—to ensure that data is reliable) and humanitarian efforts are not derailed through the spreading of incor-rect or stale information. Verification and validation are important since it has been noted that citizens have a ten-dency to exaggerate under extreme stress. For verification and validation, standard verification techniques that have been developed for information verification for humani-tarian purposes should be followed (Silverman 2013). As an example, information coming from several indepen-dent sources (e.g., through social media and traditional media) may be considered more reliable than informa-tion from dependent sources (e.g., retweets of the same original tweet). In addition, we note that the collection of metadata and data provenance is a challenge when data is being collected in stressful situations by a large number of actors (but such data is necessary for appropri-ately dealing with heterogeneous big data). Existing ver-ification projects have mostly combined crowdsourcing with ML to build verification projects. TheVerilyproject (Verily) crowdsources the task of verification by seek-ing rapid crowdsource evidence (in terms of an affirma-tive or negaaffirma-tive answer) to answer verification questions. TheTweetCredis a web- and ML-based plug-in that can be used to automatically detect non-credible tweets and fake images being shared on Twitter in real time (Gupta et al. 2014).
The data collected can also be false in terms of poor quality, malice, or bias. The presence of false data dilutes the signal to noise ratio, making the task of finding the right information at the right time even more challeng-ing. As an example of the inherent bias in big data, we note that the Google Flu Tracker overestimated the size of the influenza pandemic by 50 %, miscalculating the severity of the 2013 flu and predicting double the amount of flu-related doctor visits (Butler 2013). As an example of quality problems, we refer to (Meier 2014) in which a study focusing on social media content relating to the Boston bombing in 2013 is cited; this study (which was based on an analysis of 8 million unique tweets sent in 2013) showed that only 20 % of the tweets that went viral relayed accurate information; the remaining tweets either propagated fake content (30 % of the viral tweets) or offered only general comments/opinions (50 % of the overall tweets).
This problem noisy data is particularly problematic for crowdsourced data in which the noise may be injected intentionally or unintentionally. Intentional sources of noise may come from pranksters or more sinisterly through cyber-attacks (this is particularly a risk during
man-inflicted disasters, such as coordinated terrorist attacks). Unintentional sources of noise also creep into disaster data (e.g., through the spreading of false rumors on social networks; or through the circulation of stale information about some time-critical matter).
It is therefore in order to rely on big data-based analy-sis with caution. A promising technique for addressing the signal to noise problem in big data is to use human micro-tasking (for increasing the signal to noise ratio) so that the amateur volunteers can reduce the noise while the experts can focus on following the potential signals more closely. It is also a good idea to verify the output of crisis analyt-ics with plain-old verification techniques that journalists have honed over many years (Silverman 2013).
The problem of validity also addresses “representativity”: i.e., it aims to reassure that the digital traces appropri-ately capture the overall population (which is especially important in developing countries, where the data may not capture everyone’s voice due to socio-economic differences/preferences). It is possible that population sub-groups with limited access to technology may be systemically underrepresented in data—thus the need of sound statistical analysis is not obviated due to the large size of data. Much like the “dog that didn’t bark” that tipped off Sherlock Holmes in one of his stories, some-times the data that is not captured is more important than what was captured. This sampling bias is always present in social media and must be accounted for (i.e., when the dog does not bark, one must dig deeper to investigate more closely).
Values
It is important that the big crisis data community and the digital humanitarian community emphasize value-based and ethical humanitarian service. In this regard, these communities can leverage the collective knowledge of the existing humanitarian organizations available in the form of the “humanitarian principles” (Humanitar-ian Principles) that define a set of universal principles for humanitarian action based on international humanitarian law. These principles are widely accepted by humanitarian actors and are even binding for UN agencies. The big crisis data analytics community also needs to adopt the same or similar principles to guide their own work. The humanitarian principles are described below: