The relationship between violence in Northern Mexico
and potentially avoidable hospitalizations in the
USA – Mexico border region
Kimberley Geissler
1,2, Sally C. Stearns
2, Charles Becker
3, Harsha Thirumurthy
2,
George M. Holmes
21
Department of Markets, Public Policy, and Law, Boston University School of Management, Boston, MA, USA 2
Department of Health Policy and Management, Gillings School of Global Public Health, The University of North Carolina at Chapel Hill, Chapel Hill, NC, USA 3
Department of Economics, Duke University, Durham, NC, USA Address correspondence to Kimberley Geissler, E-mail: [email protected]
A B S T R AC T
Background Substantial proportions of US residents in the USA– Mexico border region cross into Mexico for health care; increases in violence in northern Mexico may have affected this access. We quantified associations between violence in Mexico and decreases in access to care for border county residents. We also examined associations between border county residence and access.
Methods We used hospital inpatient data for Arizona, California and Texas (2005 –10) to estimate associations between homicide rates and the probability of hospitalization for ambulatory care sensitive (ACS) conditions. Hospitalizations for ACS conditions were compared with homicide rates in Mexican municipalities matched by patient residence.
Results A 1 SD increase in the homicide rate of the nearest Mexican municipality was associated with a 2.2 percentage point increase in the probability of being hospitalized for an ACS condition for border county patients. Residence in a border county was associated with a 1.3 percentage point decrease in the probability of being hospitalized for an ACS condition.
Conclusions Increased homicide rates in Mexico were associated with increased hospitalizations for ACS conditions in the USA, although residence in a border county was associated with decreased probability of being hospitalized for an ACS condition. Expanding access in the border region may mitigate these effects by providing alternative sources of care.
Keywords ambulatory care sensitive condition, healthcare access, USA–Mexico border region, violence
Introduction
Hospitalizations for ambulatory care sensitive (ACS) condi-tions, those for which appropriate outpatient care can prevent hospitalization or for which early interventions can reduce complications, are a costly issue for the US healthcare system.1 Regional rates of ACS admissions are indicators of primary care access, with more ACS admissions indicating lower access. ACS hospitalization rates are associated with socioeconomic status, insurance, race, outpatient care access and primary care supply.2–6
The population in the USA – Mexico border region—US counties within 100 km of the border—has risk factors known to increase ACS hospitalizations including high rates
of uninsurance, poverty and chronic disease.7–9A significant proportion of legal US residents in the border region cross into Mexico for health care and pharmaceuticals,10–14 with over a third of residents crossing into Mexico in the previous year for either a doctor’s visit (37%) or medication purchases
Kimberley Geissler, Lecturer
Sally C. Stearns, Professor
Charles Becker, Research Professor
Harsha Thirumurthy, Associate Professor
George M. Holmes, Associate Professor
14 #The Author 2015. Published by Oxford University Press on behalf of Faculty of Public Health. All rights reserved. For permissions, please e-mail: [email protected].
(43%) as of 2008.14Individuals do not generally seek care in Mexico for inpatient or emergency conditions.14
Sharp increases in violence in northern Mexico starting in 2006 may have affected patterns of cross-border care. Medical tourism in Tijuana was reduced by an estimated 50%,15 with 30 – 50% of private clinics and pharmacies in Juarez and Tijuana closed as of 2010.15,16Previous research found that increased homicide rates were negatively associated with legal border crossing from Mexico into the USA, but found no association between homicide rates and self-reported access for residents of border counties or changes in the composition of emergency department (ED) encoun-ters.17,18However, markers of reduced access measured using administrative utilization data and well-established access indi-cators such as ACS admissions may be more sensitive than self-reported data and more reliable than changes in ED en-counter ratios.
We used data on inpatient hospitalizations from three border states to measure the association between homicide rates in the nearest Mexican municipality and the likelihood of hospitalization for an ACS condition. We hypothesized that higher homicide rates in the nearest Mexican municipality would be associated with an increased likelihood of a hospital-ization being for an ACS rather than a marker condition in border counties. Marker conditions are non-discretionary admissions with clear diagnostic criteria, for which the timely provision of outpatient care has little impact on medical ne-cessity of hospitalization (e.g. appendicitis or hip fracture).3 Since marker admissions should not be affected by variables related to healthcare access such as physician supply,3,6 they provide a control group for hospitalizations with ACS tions. The incidence and treatment location of marker condi-tions were not expected to be influenced by violence in Mexico. Additionally, we hypothesized that after controlling for patient socioeconomic and demographic characteristics and county physician supply, hospitalizations from border counties would have a lower likelihood of being for an ACS condition given the supply of care available in Mexico not accounted for by the model.
Methods
We used a hospitalization-level difference-in-difference ap-proach to examine associations among homicide rates, border region residence, and admissions for ACS and marker condi-tions. We compared differences between ACS and marker conditions, and differences between high violence and low violence areas. We measured violence with a continuous measure, with differences across time and place.
Data and analytic sample construction
Hospital discharge records from Arizona, California and Texas were used to identify hospitalizations for patients aged 18 – 64 between 1 January 2005 and 31 December 2010 with at least one ACS or marker condition. The sample was limited to non-elderly adults as they were more likely to seek care in Mexico and have a defined set of ACS and marker conditions. Data from California and Arizona hospitals contained hospi-talizations from all acute-care, short-term hospitals.19,20Texas data contained hospitalizations from acute-care, short-term hospitals subject to reporting requirements.21Hospitalization data contain limited patient information (e.g. age, gender, zip code) as well as diagnosis and procedure codes from the hos-pital stay.
We included hospitalizations identified as being for ACS conditions by the Prevention Quality Indicators Module of the QI SASw
software, Version 4.4:22 diabetes short- and long-term complications, chronic obstructive pulmonary disease or asthma, hypertension, heart failure, dehydration, bacterial pneumonia, urinary tract infection, angina, uncon-trolled diabetes and lower extremity amputation for patients with diabetes. Hospitalizations identified as marker conditions were for appendicitis with appendectomy, acute myocardial infarction, intestinal obstruction and hip/femur fracture.23
Hospitalizations were excluded if they were a transfer from another hospital or patient residence was not in the same state as the hospital. This criterion excluded 6.7% of hospitaliza-tions with marker or ACS condihospitaliza-tions. Hospitalizahospitaliza-tions were excluded if age, gender, primary payer, primary diagnosis code, hospitalization quarter, length of stay or patient resi-dence were missing; this criterion excluded 17.6% of hospita-lizations with marker or ACS conditions (0.5% in Arizona, 26.7% in California, 9.3% in Texas). Most missing demo-graphic information was due to censoring by data providers to prevent identification of patients. In Texas, we excluded patients residing in a county with a non-reporting hospital; this criterion excluded a small subset (0.76%) of the sample with marker or ACS conditions.
Outcomes and covariates
The outcome variable was a hospitalization-level binary vari-able indicating that the admission was an ACS (1) or a marker condition (0). We estimated associations with lagged homicide rates in the Mexican municipality adjacent to the border cross-ing nearest the patient’s residence, as this location represents the place an individual would be most likely to seek care in Mexico if he so chose. Mexican municipalities were matched to patient residence using Google Maps driving distances24 based on five-digit patient zip code. Homicide rates were
calculated monthly using the number of homicides from the Mexican National Institute of Statistics and Geography and matched to admission month.25 For the denominator of homicide rates, 2005 and 2010 population estimates were used, with population between census years estimated using linear interpolation. Socioeconomic status used the 2008 zip code-level income quartile calculated using median household income for the four states in the USA – Mexico border region (CA, NM, AZ, TX)26 and county-level unemployment rates.27 Regional characteristics included annual county-level physician to population ratios28and an indicator of whether the county of patient residence was in an urban area.29
Statistical methods
We adapted the empirical technique developed by Basuet al. (2002)6using a model at the hospitalization unit of analysis. This approach uses marker conditions as a base case for comparison of ACS hospitalizations. We used this technique as the border region was growing rapidly in population,9and thus, there may be differential measurement error in popula-tion estimates between border and non-border counties. Furthermore, using this technique minimized impacts of missing data due to missing demographic information and non-reporting hospitals.
The empirical model was specified as follows using a logit model:
PrðACSadmissionhast¼1jXacstÞ ¼ expfXbg
1þexpfXbgwithXb
¼b0þb1Has;lagðtÞ
þb2Borderas
þb3ðHas;lagðtÞBorderasÞ
þb4Xhastþb5Zastþms
þmtþyt ð1Þ
where hindexed the hospitalization,athe zip code area,sthe state and tthe time period (admission month). The outcome variable,ACSadmission, was a binary indicator of ACS condition (1) versus marker condition (0);Hwas a set 6 of 3 months of lagged homicide rates in the nearest Mexican municipality (i.e. t21,t22 and t23);Border was a binary variable of border county;Xwas a set of individual characteristics includ-ing age, sex and insurance status;Zwas a set of regional char-acteristics including county physician supply, zip code income quartile, county unemployment rates and county urban status;
msrepresents state fixed effects to control for time-invariant
state characteristics; m represents admission-month fixed
effects to control for seasonality; andyrepresents year fixed effects to control for secular trends. In California, only admis-sion quarter was available, so we randomly assigned each hos-pitalization to a month within a quarter. Robust standard errors were used.
The estimated effect of interest was, for patients residing in border counties, the change in the relative predicted probability (which we will refer to as ‘probability’) of a hos-pitalization being for an ACS rather than a marker condition associated with a one-unit increase in the homicide rates for the 3 months prior. Bias-corrected confidence intervals were calculated for the combined effect using bootstrap-ping with 1000 replicates.30Additionally, we calculated the average marginal effect for patient residence in a border county and used the delta method to calculate standard errors.31
Data set construction and ACS/marker identification were conducted using SAS 9.2 (SAS Institute, Cary, NC, USA); re-gression analyses used Stata 12.1 (StataCorp, College Station, TX, USA). An alpha level of 0.05 was considered statistically significant. The University of North Carolina Institutional Review Board and the Texas Department of State Health Services Institutional Review Board approved this study.
Subgroup analyses
We did subgroup analyses to determine whether certain sub-groups thought likely a priori to be more likely to seek care in Mexico were differentially affected by increased homicides, specifically the uninsured and underinsured (i.e. hospitaliza-tions with the primary payer of self-pay, charity care, no charge or Medicaid)32,33and persons residing in zip codes in the lowest income quartile.
Sensitivity analyses
We also conducted sensitivity analyses. Individuals may take time to update their knowledge of and preferences for the risk of seeking care in Mexico. Thus, it is not immediately obvious that homicide rate would have the most effect on patient behavior. We estimate the sensitivity of the primary results using a specification with the 1-month lagged homi-cide rate.
As more patient demographic data (e.g. sex, age, admission month) were missing in California, we conducted a sensitivity analysis restricted to Texas and Arizona including age in 5-year categories. Information on patient race was available, but these data are often inconsistent with patient reports of race/ethnicity.34We conducted a sensitivity analysis including a categorical indicator of patient race.
Results
Analytic sample
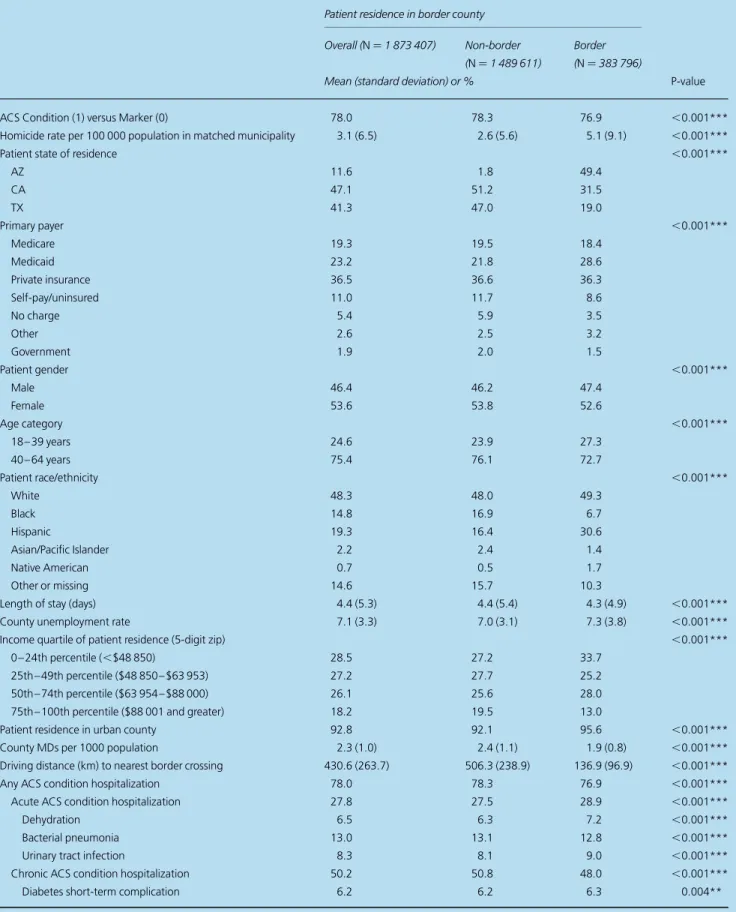
The final analytic sample included 1 873 407 hospitalizations containing an ACS or marker condition (Fig.1). Approximately 10% of total hospitalizations for those aged 18– 64 were for ACS or marker conditions. Seventy-eight percent of these were for ACS conditions. Patient residence matched to 24 unique Mexican municipalities corresponding to the crossings along the USA – Mexico border.
Twenty percent of hospitalizations were for patients resid-ing in a border county (Table1). Compared with hospitaliza-tions in non-border counties, hospitalizahospitaliza-tions in border counties were less likely to be for ACS than marker condi-tions. Forty-nine percent of hospitalizations in border coun-ties were in Arizona. Hospitalizations for patients in border counties were more likely to be covered by Medicaid and had shorter length of stay. Hospitalizations were more likely to be
for male, younger (18 – 39 years) and Hispanic patients in border counties than non-border counties. Hospitalizations in border counties were more likely to have patient residence in areas with higher unemployment rates and lower income quartiles. Physician supply was lower for hospitalizations in border counties.
Analysis
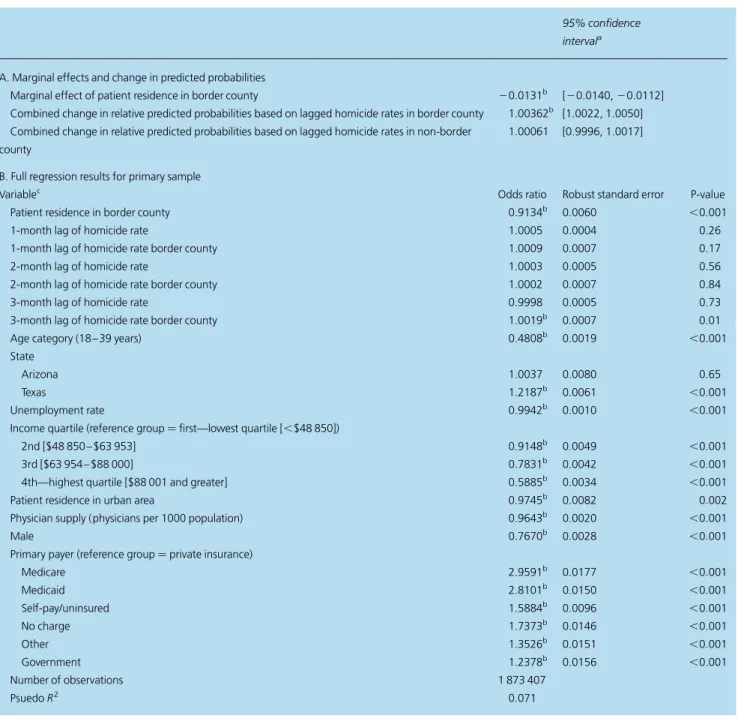
Results for the estimation of Equation (1) (Table2) showed a significant positive association between homicide rates and the probability of being hospitalized for an ACS versus marker condition in border counties. A 1-unit increase (1 homicide per 100 000 population) in the homicide rate persistent over the 3 months prior was associated with a 0.36 percentage point increase in the probability of being hospitalized for an ACS condition versus marker for patients in border counties. In non-border counties, there was no association between
Total discharges with patient age 18–64 or missing age (n= 24340197; AZ n= 2295552; CA n= 13108241; TX n= 8936404)
Missing primary diagnosis code (n= 5415; AZ n= 83; CA n= 0; TX n= 5332)
Total potential ACS or marker condition discharges with patient age 18–64 or missing age (n= 2438675; AZ n= 234909; CA n= 1280830; TX n= 922936)
Missing or invalid location information (n= 35290; AZ n= 1138; CA n= 24922; TX n= 9230)
Missing patient age information (n= 328594; AZ n= 36; CA n= 253384; TX n= 75174)
Missing patient gender (n= 64174; AZ n= 6; CA n= 64109; TX n= 59)
Missing discharge quarter or year of discharge (n= 661; AZ n= 0; CA n= 0; TX n= 661)
Missing primary payer information (n= 742; AZ n= 5; CA n= 138; TX n= 599)
Missing length of stay information (n= 2; AZ n= 2; CA n= 0; TX n= 0)
Primary analytic sample (n= 1873407; AZ n= 216582; CA n= 883136; TX n= 773689)
Diagnosis and/or procedure codes not indicative of ACS or marker condition (n= 21896107; AZ n= 2060560; CA n= 11827411; TX n= 8008136)
Source of admission is transfer (n= 91667; AZ n= 9955; CA n= 43490; TX n= 38222)
Not discharged from hospital in patient state of residence (n= 29293; AZ n= 7185; CA n= 11651; TX n= 10457)
Patient residence in Texas county with non-reporting hospital (n= 14845; AZ n= 0; CA n= 0; TX n= 14845)
Fig. 1Construction of analytic sample.
Table 1 Summary statistics for analytic sample
Patient residence in border county
Overall (N¼1 873 407) Non-border (N¼1 489 611)
Border (N¼383 796)
Mean (standard deviation) or % P-value
ACS Condition (1) versus Marker (0) 78.0 78.3 76.9 ,0.001***
Homicide rate per 100 000 population in matched municipality 3.1 (6.5) 2.6 (5.6) 5.1 (9.1) ,0.001***
Patient state of residence ,0.001***
AZ 11.6 1.8 49.4
CA 47.1 51.2 31.5
TX 41.3 47.0 19.0
Primary payer ,0.001***
Medicare 19.3 19.5 18.4
Medicaid 23.2 21.8 28.6
Private insurance 36.5 36.6 36.3
Self-pay/uninsured 11.0 11.7 8.6
No charge 5.4 5.9 3.5
Other 2.6 2.5 3.2
Government 1.9 2.0 1.5
Patient gender ,0.001***
Male 46.4 46.2 47.4
Female 53.6 53.8 52.6
Age category ,0.001***
18 – 39 years 24.6 23.9 27.3
40 – 64 years 75.4 76.1 72.7
Patient race/ethnicity ,0.001***
White 48.3 48.0 49.3
Black 14.8 16.9 6.7
Hispanic 19.3 16.4 30.6
Asian/Pacific Islander 2.2 2.4 1.4
Native American 0.7 0.5 1.7
Other or missing 14.6 15.7 10.3
Length of stay (days) 4.4 (5.3) 4.4 (5.4) 4.3 (4.9) ,0.001***
County unemployment rate 7.1 (3.3) 7.0 (3.1) 7.3 (3.8) ,0.001***
Income quartile of patient residence (5-digit zip) ,0.001***
0 – 24th percentile (,$48 850) 28.5 27.2 33.7
25th – 49th percentile ($48 850 – $63 953) 27.2 27.7 25.2
50th – 74th percentile ($63 954 – $88 000) 26.1 25.6 28.0
75th – 100th percentile ($88 001 and greater) 18.2 19.5 13.0
Patient residence in urban county 92.8 92.1 95.6 ,0.001***
County MDs per 1000 population 2.3 (1.0) 2.4 (1.1) 1.9 (0.8) ,0.001***
Driving distance (km) to nearest border crossing 430.6 (263.7) 506.3 (238.9) 136.9 (96.9) ,0.001***
Any ACS condition hospitalization 78.0 78.3 76.9 ,0.001***
Acute ACS condition hospitalization 27.8 27.5 28.9 ,0.001***
Dehydration 6.5 6.3 7.2 ,0.001***
Bacterial pneumonia 13.0 13.1 12.8 ,0.001***
Urinary tract infection 8.3 8.1 9.0 ,0.001***
Chronic ACS condition hospitalization 50.2 50.8 48.0 ,0.001***
Diabetes short-term complication 6.2 6.2 6.3 0.004**
Continued
homicide rates and the probability of being hospitalized for an ACS versus marker condition.
Patient residence in a border county was associated with a 1.3 percentage point decrease in the probability of being hos-pitalized for ACS versus marker controlling for covariates included in the model. Patients residing in higher income zip codes were less likely to be hospitalized for an ACS condition, as were men, those with private insurance, those living in a urban area and younger patients. Higher physician supply in the county of patient residence was associated with a lower likelihood of being admitted for an ACS condition.
Subgroup analyses
For the uninsured and underinsured, the effects of homicide rates were similar in direction and significance but of larger magnitude than those in the full sample (Table3A). For hos-pitalizations where the primary payer was self-pay, charity care, no charge or Medicaid, a significant positive association existed between homicide rates and the probability of being hospitalized for an ACS versus marker condition in border counties. In border counties, a 1-unit increase (1 homicide per 100 000 population) in the homicide rate persistent over the 3 months prior was associated with a 0.47 percentage
point increase in the probability of being hospitalized for an ACS condition versus marker. Patient residence in a border county was, on average, associated with a 1.7 percentage point decrease in the probability of being hospitalized for ACS versus marker controlling for covariates included in the model.
For patients residing in zip codes in the lowest income quartile, the association between homicide rates and the prob-ability of being hospitalized for an ACS condition in border counties was smaller in magnitude and not significant at the 5% level (Table3B). For this population, patient residence in a border county was, on average, associated with a 2.2 per-centage point decrease in the probability of being hospitalized for ACS versus marker condition controlling for covariates included in the model.
Sensitivity analyses
We examined a 1-month lagged homicide rate in place of the set of lagged rates used in the primary analyses (Supplementary data, Table S1, Panel A). For the main analyt-ic sample, the results were qualitatively similar. When the sample was limited to hospitalizations in Texas and Arizona,
Table 1 Continued
Patient residence in border county
Overall (N¼1 873 407) Non-border (N¼1 489 611)
Border (N¼383 796)
Mean (standard deviation) or % P-value
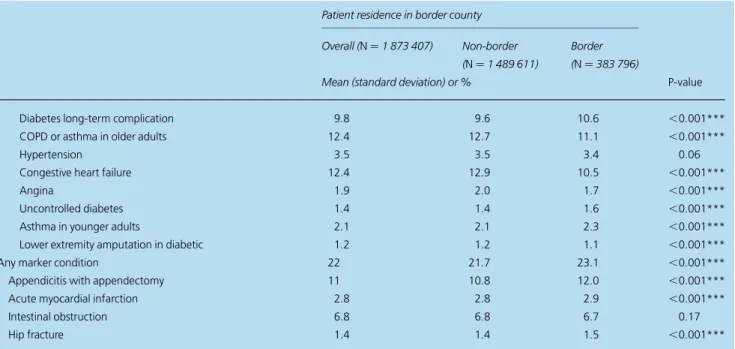
Diabetes long-term complication 9.8 9.6 10.6 ,0.001***
COPD or asthma in older adults 12.4 12.7 11.1 ,0.001***
Hypertension 3.5 3.5 3.4 0.06
Congestive heart failure 12.4 12.9 10.5 ,0.001***
Angina 1.9 2.0 1.7 ,0.001***
Uncontrolled diabetes 1.4 1.4 1.6 ,0.001***
Asthma in younger adults 2.1 2.1 2.3 ,0.001***
Lower extremity amputation in diabetic 1.2 1.2 1.1 ,0.001***
Any marker condition 22 21.7 23.1 ,0.001***
Appendicitis with appendectomy 11 10.8 12.0 ,0.001***
Acute myocardial infarction 2.8 2.8 2.9 ,0.001***
Intestinal obstruction 6.8 6.8 6.7 0.17
Hip fracture 1.4 1.4 1.5 ,0.001***
P-values byt-test for continuous variables andx2test for binary/categorical variables. **P,0.01.
***P,0.001.
results were similar in magnitude and direction to the primary analysis (Supplementary data, Table S1, Panel B).
Finally, we controlled for race in addition to the other cov-ariates in the model. The association between homicides and
probability of ACS hospitalization was similar to the primary analysis (Supplementary data, Table S1, Panel C), with a sig-nificant positive association between homicide rates and the probability of being admitted for an ACS versus marker
Table 2 Regression estimation results
95% confidence intervala
A. Marginal effects and change in predicted probabilities
Marginal effect of patient residence in border county 20.0131b [20.0140,20.0112] Combined change in relative predicted probabilities based on lagged homicide rates in border county 1.00362b [1.0022, 1.0050] Combined change in relative predicted probabilities based on lagged homicide rates in non-border
county
1.00061 [0.9996, 1.0017]
B. Full regression results for primary sample
Variablec Odds ratio Robust standard error P-value
Patient residence in border county 0.9134b 0.0060 ,0.001
1-month lag of homicide rate 1.0005 0.0004 0.26
1-month lag of homicide rate border county 1.0009 0.0007 0.17
2-month lag of homicide rate 1.0003 0.0005 0.56
2-month lag of homicide rate border county 1.0002 0.0007 0.84
3-month lag of homicide rate 0.9998 0.0005 0.73
3-month lag of homicide rate border county 1.0019b 0.0007 0.01
Age category (18 – 39 years) 0.4808b 0.0019 ,0.001
State
Arizona 1.0037 0.0080 0.65
Texas 1.2187b 0.0061 ,0.001
Unemployment rate 0.9942b 0.0010 ,0.001
Income quartile (reference group¼first—lowest quartile [,$48 850])
2nd [$48 850 – $63 953] 0.9148b 0.0049 ,0.001
3rd [$63 954 – $88 000] 0.7831b 0.0042 ,0.001
4th—highest quartile [$88 001 and greater] 0.5885b 0.0034 ,0.001
Patient residence in urban area 0.9745b 0.0082 0.002
Physician supply (physicians per 1000 population) 0.9643b 0.0020 ,0.001
Male 0.7670b 0.0028 ,0.001
Primary payer (reference group¼private insurance)
Medicare 2.9591b 0.0177 ,0.001
Medicaid 2.8101b 0.0150 ,0.001
Self-pay/uninsured 1.5884b 0.0096 ,0.001
No charge 1.7373b 0.0146 ,0.001
Other 1.3526b 0.0151 ,0.001
Government 1.2378b 0.0156 ,0.001
Number of observations 1 873 407
PsuedoR2 0.071
aConfidence interval for marginal effect of patient residence in border county was calculated using the delta method. Confidence intervals for combined changes in relative predicted probabilities based on lagged homicide rates are calculated using bias-corrected bootstrapping methods with 1000 replicates. bIndicates significance at a 95% confidence level.
cControls for month and year of admission were also included. Omitted categories were Patient residence—California, 18 – 39 years, Lowest income quartile, and Primary payer—private insurance. Robust standard errors were used.
condition. After controlling for race, patient residence in a border county was not significantly associated with the prob-ability of being admitted for an ACS versus marker condition.
Discussion
Main findings of this study
We used a common measure of access to outpatient care with an innovative method using patient-level hospital hospitaliza-tion data to examine the impact of homicides in northern Mexico on access to care in US border counties over the period of 2005– 10. Using data on hospitalizations in California, Arizona and Texas, we found a positive relationship between homicide rates in the nearest Mexican municipality and the probability of being hospitalized for an ACS versus marker condition for patients residing in border counties.
We also found that individuals in border counties had reduced probabilities of being hospitalized for an ACS versus marker condition, indicating a higher level of access for these individuals than indicated by the model that controls for US physician supply. This finding is likely due to the fact that they had increased access to physicians in Mexico not included in the model.
What is known about this topic
Reducing hospitalizations for ACS conditions is an important policy priority to lower healthcare costs.35Thus, recognizing and ameliorating barriers to accessing outpatient care is im-portant, particularly when such access may be compromised by events external to the US healthcare system such as vio-lence in Mexico.
Using health care in Mexico is a common alternative to the US healthcare system for residents of the border region.14
Access to care in Mexico may have been jeopardized by vio-lence in Mexico, although previous research found that any reductions in access measured based on self-reported access and ED encounter types are small and not statistically signifi-cant. Options for improving access to care in the USA –Mexico border region may be more complicated than in other regions12 due to the availability of formal care in Mexico and informal care options, options that are not present in other regions.17,18
What this study adds
These results suggest two relationships: (i) access to ambula-tory care in Mexico may be reduced due to the violence in northern Mexico, with measurable changes in hospitalizations for ACS conditions and (ii) access to ambulatory care in Mexico may contribute to lower than expected rates of ACS conditions in US hospitals.
Violence in northern Mexico was associated with increased hospitalizations for ACS conditions in the USA. An increase of 1 SD (6.1 homicides per 100 000 population) was asso-ciated with a 2.2 percentage point increase in the probability of being hospitalized for an ACS versus marker condition. The size of this effect was similar to the change in patient access resulting from a safety net hospital closure near the patient in California during the 1990 – 2000 period.36The as-sociation between homicide rates and the probability of being admitted for an ACS versus marker condition was stronger for the uninsured and underinsured. Associations with homi-cide rates were not statistically significant for those residing in low-income zip codes, which may be due to measurement error in income at the individual level (i.e. we were not able to identify the income of an individual patient). The results in border counties persisted when changing the specification of the homicide rate measure and when controlling for more precise age categories and patient race.
Table 3 Subgroup analyses
95% confidence intervala
A. Uninsured and underinsured subgroup (N¼741 680)
Marginal effect of patient residence in border county 20.01753b [20.0202,20.01482]
Combined change in relative predicted probabilities based on lagged homicide rates in border county 1.00476b [1.0024, 1.0072] Combined change in relative predicted probabilities based on lagged homicide rates in non-border county 0.99936 [0.9978, 1.0010] B. Lowest income quartile subgroup (N¼534 123)
Marginal effect of patient residence in border county 20.0220b [20.0251,20.0189]
Combined change in relative predicted probabilities based on lagged homicide rates in border county 1.0022 [0.9996, 1.0045] Combined change in relative predicted probabilities based on lagged homicide rates in non-border county 0.9975 [0.9941, 1.0013]
aConfidence interval for marginal effect of patient residence in border county is calculated using the delta method. Confidence intervals for combined change in relative predicted probabilities based on lagged homicide rates are calculated using bias-corrected bootstrapping methods with 1000 replicates. bIndicates significance at a 95% confidence level.
Despite the frequent use of care in Mexico by US border residents, previous research has not quantified effects of this access on health care in the USA. Patient residence in a border county was associated with a reduced probability of being hos-pitalized in the USA for an ACS versus marker condition. This relationship persisted after controlling for local economic condi-tions, patient age, insurance status and physician supply, and the effect was stronger for uninsured and underinsured individuals as well as residents of low-income US counties. This finding suggests that while border counties are underserved8 and affected by reduced access to ambulatory care in Mexico in some regions due to violence, border county residents have lower ACS admissions than non-border residents. Efforts in border regions to improve access through provisions such as free care by public health departments in border regions to im-migrant communities may also be having a measurable positive impact on access for these populations. Cross-border care avail-able in Mexico likely contributes to this improved access, despite changes due to the violence in northern Mexico. To our knowledge, this study is the first to quantify the size of this access benefit in terms of reduced hospitalizations, an effect that is small but significant in both statistical and practical sense. The fact that access to care in Mexico has measurable effects on hospitalizations in the USA suggests that policy responses may be appropriate to incorporate this access and improve care coordination between USA and Mexican providers.
Limitations
Our analysis had several limitations. First, we were not able to fully control for healthcare access. We included controls for physician supply, but physician supply is not a direct proxy for access to care for individuals.37Second, if there were compen-satory responses (e.g. increased free care from public health clinics) to reduced access due to violence in the border region, results will underestimate effects of changes in access to care in Mexico. Additional changes in outpatient access during this period include the expansion of retail clinics38and reduction in the prices of generic prescriptions in the USA (e.g. $4 prescriptions).39,40 Third, we had limited patient demo-graphic data and significant missing age and gender data in California; we conducted sensitivity analyses to test whether this missing data was driving the results and found that this did not affect the primary results. We did not test sensitivity for the 13.5% of potential ACS/marker hospitalizations with missing age, as we could not definitively classify these.
Conclusion
In total, an increase in hospitalizations for ACS conditions in border counties was associated with increased homicide rates.
We were able to quantify the association between residence in a border county and reduced hospitalizations for ACS tions in the USA. Increased hospitalizations for ACS condi-tions may indicate reduced access to ambulatory care in Mexico associated with homicides, crucial for a population with high poverty and uninsurance rates that relies heavily on this care.14Mitigating reductions in access due to violence in Mexico is a crucial step for policymakers and health profes-sionals in the border region as the violence continues to be widespread.41 Future research should examine options to improve access to care in the USA, as well as to improve access and coordination of care between USA and Mexican providers for those residing in border counties.
Supplementary data
Supplementary data are available at theJournal of Public Health
online.
Acknowledgements
We thank Sheila Leatherman and Frank Sloan for helpful comments on earlier drafts of this manuscript.
Funding
This work was supported by the Agency for Healthcare Research and Quality, US Department of Health and Human Services, Rockville, MD (grant number R36HS021074). The content is solely the responsibility of the authors and does not necessarily represent the official views of the Agency for Healthcare Research and Quality. K.G. also received support from the Lovick P. Corn Dissertation Fellowship, the University of North Carolina Royster Society of Fellows, and the Robert and Kristen Greczyn Scholarship in Public Health.
References
1 Agency for Healthcare Research and Quality. National Healthcare Quality Report 2011. Rockville, MD: Agency for Healthcare Research and Quality, 2012.
2 Weissman JS, Gatsonis C, Epstein AM. Rates of avoidable hospital-ization by insurance status in Massachusetts and Maryland.JAMA 1992;268:2388 – 94.
3 Billings J, Zeitel L, Lukomnik Jet al. Impact of socioeconomic status on hospital use in New York City.Health Aff1993;12:162 – 73.
4 Bindman A, Grumbach K, Osmond Det al. Preventable hospitaliza-tions and access to health care.JAMA1995;274:305 – 11.
5 Laditka JN, Laditka SB, Mastanduno MP. Hospital utilization for am-bulatory care sensitive conditions: health outcome disparities asso-ciated with race and ethnicity.Soc Sci Med2003;57:1429 – 41.
6 Basu J, Friedman B, Burstin H. Primary care, HMO enrollment, and hospitalization for ambulatory care sensitive conditions: a new ap-proach.Med Care2002;40:1260 – 9.
7 Bastida E, Brown HS, Paga´n JA. Health insurance coverage and health care utilization along the U.S.–Mexico Border: Evidence from the border epidemiologic study on aging. In: Angel JL, Whitfield KE (eds). The Health of Aging Hispanics. New York: Springer, 2007:222–34.
8 United States-Mexico Border Health Commission. Border Lives: Health Status in the United-States Mexico Border Region. El Paso: United States-Mexico Border Health Commission, 2010.
9 United States-Mexico Border Health Commission.Health Disparities and the U.S.-Mexico Border: Challenges and Opportunities. El Paso: United States-Mexico Border Health Commission, 2010.
10 Byrd T, Law J. Cross-border utilization of health care services of United States residents living near the Mexican border.Rev Panam Salud Publica2009;26:95 – 100.
11 Escobedo L, Cardenas V. Utilization and purchase of medical care services in Mexico by residents in the United States of America, 1998 – 1999.Rev Panam Salud Publica2006;19:300 – 5.
12 Pisani MJ, Pagan JA, Lackan NAet al. Substitution of formal health care services by Latinos/Hispanics in the US-Mexico border region of South Texas.Med Care2012;50:885 – 9.
13 Potter J, White K, Hopkins Ket al. Clinic versus over-the-counter access to oral contraception: choices women make along the US-Mexico border.Am J Public Health2010;100:1130 – 6.
14 Su D, Richardson C, Wen Met al. Cross-border utilization of health care: evidence from a population-based study in South Texas.Health Serv Res2011;46:859 – 76.
15 O’Connor A, Booth W. Trying to save lives amid relentless drug vio-lence, Mexican medical workers put their own on the line. The Washington Post, 2010. http://www.washingtonpost.com/wp-dyn/ content/article/2010/11/18/AR2010111806504_pf.html (23 August 2012, date last accessed).
16 Homedes N. Acheiving health equity and social justice in the US-Mexico border region. In: Lusk M, Staudt K, Moya E (eds).Social Justice in the US-Mexico Border Region. New York: Springer, 2012.
17 Geissler KH, Becker C, Stearns SCet al. Exploring the association of homicides in Northern Mexico and healthcare access for US resi-dents.J Immigr Minor Health2014, doi: 10.1007/s10903-014-0053-4.
18 Geissler KH, Holmes GM. Emergency department use in the US– Mexico border region and violence in Mexico: Is there a relationship? Journal of Rural Health2015. (Forthcoming)
19 State of California Office of Statewide Health Planning and Development.Emergency Department Public Data Set. Sacramento, CA: State of California Office of Statewide Health Planning and Development, 2005 – 2010 [cited 2012]; http://www.oshpd.ca.gov/ HID/Products/PatDischargeData/PublicDataSet/index.html (29 December 2014, date last accessed).
20 Arizona State Inpatient Databases (SID). Arizona State Inpatient Databases (SID): Healthcare Cost and Utilization Project (HCUP). Agency for Healthcare Research and Quality 2005 – 2010.
21 Texas Department of State Health Services.Texas Hospital Inpatient Discharge Public Use Data File. Austin, TX: Texas Department of State Health Services, 2005 – 2010 [cited 2012].
22 Agency for Healthcare Research and Quality. AHRQ Quality Indicators Software. Rockville, MD. 2012; http://www.qualityindicators.ahrq.gov/ software/default.aspx (10 December 2012, date last accessed).
23 Billings J. Using administrative data to monitor access, identify dispar-ities, and assess performance of the safety net. In: Weinick R, Billings J (eds).Tools for Monitoring the Health Care Safety Net. Rockville, MD: Agency for Healthcare Research and Quality, 2003.
24 Caruso G, Me´dard de Chardon C.Friendly Batch Routing with Google Maps API. v 1.03. ed. University of Luxembourg, 2012.
25 Instituto Nacional de Estadistica y Geografia. Mortality Statistics: Interactive Data Query. 2012. http://www.inegi.org.mx/est/lista_cubos/ consulta.aspx?p=adm&c=4 (20 January 2012, date last accessed).
26 Nielsen-Claritas.2009 Pop-Facts Database. Ithica, NY: Nielsen Claritas, 2009.
27 United States Department of Labor Bureau of Labor Statistics.Local Area Unemployment Statistics. Washington: Bureau of Labor Statistics, 2012. http://www.bls.gov/lau/ (1 May 2012, date last accesssed).
28 US Department of Health and Human Services. Area Resource File (ARF) 2009 – 2010. Rockville, MD: US Department of Health and Human Services, Health Resources and Services Administration, Bureau of Health Professions, 2010.
29 United States Census Bureau. Metropolitan and Micropolitan Definition Files. 2012. http://www.census.gov/population/metro/data/def.html (20 July 2012, date last accessed).
30 Mooney C, Duval R. Bootstrapping: A Nonparametric Approach to Statistical Inference. Newbury Park, CA: Sage Publication, 1993.
31 Oehlert GW. A note on the delta method. Am Statistician 1992;46:27 – 9.
32 Chattopadhyay A, Bindman AB. Accuracy of Medicaid payer coding in hospital patient discharge data: implications for Medicaid policy evaluation.Med Care2005;43:586 – 91.
33 Bindman AB, Chattopadhyay A, Auerback GM. Interruptions in Medicaid coverage and risk for hospitalization for ambulatory care-sensitive conditions.Ann Intern Med2008;149:854 – 60.
34 Moscou S, Anderson MR, Kaplan JBet al. Validity of racial/ethnic classifications in medical records data: an exploratory study.Am J Public Health2003;93:1084 – 6.
35 Agency for Healthcare Research and Quality. Prevention quality indicators overview. 2011. http://qualityindicators.ahrq.gov/pqi_ overview.htm (8 April 2011, date last accessed).
36 Mobley L, Kuo T, Bazzoli G. Erosion in the healthcare safety net: impacts on different population groups.Open Health Serv Policy J 2011;4:1 – 14.
37 Grumback K, Vranizan K, Bindman AB. Physician supply and access to care in urban communities.Health Aff (Millwood)1997;16:71 – 86.
38 Laws M, Scott MK. The emergence of retail-based clinics in the United States: early observations.Health Aff (Millwood)2008;27:1293 – 8.
39 Zhang Y, Gellad WF, Zhou Let al. Access to and use of $4 generic programs in medicare.J Gen Intern Med2012;27:1251 – 7.
40 Zhang Y, Zhou L, Gellad WF. Potential savings from greater use of $4 generic drugs.Arch Intern Med2011;171:468 – 9.
41 Fausset R, Sanchez C. Crime still a widespread concern in Mexican cities, poll finds.Los Angeles Times2014.