QUALITY IMPROVEMENT IN LOWER-INCOME COUNTRIES: AN EVALUATION OF THE EFFECTIVENESS OF HOSPITAL-BASED TEAMS IN GHANA
Jordan Alexander Albritton
A dissertation submitted to the faculty at the University of North Carolina at Chapel Hill in partial fulfillment of the requirements for the degree of Doctor of Philosophy in the Department of Health
Policy and Management in the Gillings School of Global Public Health.
Chapel Hill 2016
© 2016
ABSTRACT
Jordan Alexander Albritton: Quality Improvement in Lower-Income Countries: An Evaluation of the Effectiveness of Hospital-Based Teams in Ghana
(Under the direction of Bruce J. Fried)
Quality improvement (QI) is a systematic, data-driven approach to improve the delivery of healthcare services. QI interventions are now being implemented more frequently in lower-income countries. Although research has demonstrated the effectiveness of QI strategies in improving care quality and patient safety, studies also reveal variation in the success of QI interventions.
The goal of this dissertation was to add to our understanding of factors related to the effectiveness of QI teams in lower-income countries and to support efforts to spread the use of QI methods to these settings. The sample consisted of 559 individuals from 127 teams established as part of Project Fives Alive!, a nationwide program in Ghana to reduce mortality in children under 5 years of age by promoting low-cost, high-impact, evidence-based practices.
This dissertation used structural equation modeling to accomplish three aims regarding the evaluation of hospital-based QI teams in Ghana. The results from the first analysis demonstrated that survey tools developed in high-income countries can be adapted to evaluate QI teams from lower-income countries. The results from the second analysis showed that slack resources are positively associated with perceived support for teamwork and with coaching-oriented team leadership. The results from the second analysis also motivated two additional multidimensional characteristics of the slack resources construct. Finally, the third analysis provided additional evidence in support of the model of work-team learning, demonstrating that 1) team psychological safety mediates a positive relationship between coaching-oriented team leadership and team learning behavior and that 2) team learning behavior mediates a positive relationship between team psychological safety and the
implementation of QI methods.
ACKNOWLEDGEMENTS
I would like to thank my committee chair and mentor, Dr. Bruce J. Fried. He has played an integral role in my experience at Carolina and his support and guidance have been invaluable to me. Many thanks also to the rest of my committee, Dr. Jeffrey R. Edwards, Dr. Bryce B. Reeve, Dr. Kavita Singh, and Dr. Bryan J. Weiner, as this would not have been possible without them. In particular, thank you to Dr. Singh for giving me the opportunity to be involved with Project Fives Alive!; I have truly enjoyed working with you and our other colleagues, both at Carolina and abroad. A special thanks to the hardworking PFA team in Ghana, in particular, Dr. Sodzi Sodzi-Tettey, Jonas K. Akpakli, Ireneous Dasoberi, and Linda Quainoo. Thank you also to the chair of the PhD Program in Health Policy and Management, Dr. Morris Weinberger, and the rest of the faculty at Carolina for creating a great learning environment where students can thrive.
TABLE OF CONTENTS
LIST OF TABLES ... viii
LIST OF FIGURES ... ix
LIST OF ABBREVIATIONS AND SYMBOLS ... x
CHAPTER 1: INTRODUCTION ... 1
CHAPTER 2: USING SURVEYS TO EVALUATE QUALITY IMPROVEMENT TEAMS IN GHANA: PSYCHOMETRIC AND CONFIRMATORY FACTOR ANALYSES AT THE INDIVIDUAL, WITHIN-GROUP, AND BETWEEN-GROUP LEVELS ... 8
Overview ... 8
Background ... 9
Methods ... 12
Results ... 17
Discussion ... 20
Conclusions ... 25
Tables and Figures ... 27
CHAPTER 3: QUALITY IMPROVEMENT TEAMS IN LOWER-INCOME COUNTRIES: THE ROLE OF SLACK RESOURCES ... 35
Overview ... 35
Background ... 36
Methods ... 38
Results ... 45
Discussion ... 46
Conclusion ... 51
CHAPTER 4: PSYCHOLOGICAL SAFETY, LEARNING BEHAVIOR, AND THE
IMPLEMENTATION OF A QUALITY IMPROVEMENT INTERVENTION IN GHANA ... 58
Overview ... 58
Background ... 59
Methods ... 61
Results ... 68
Discussion ... 71
Conclusion ... 75
Tables and Figures ... 76
CHAPTER 5: SUMMARY OF FINDINGS AND IMPLICATIONS FOR PRACTICE AND RESEARCH ... 86
Summary of Findings ... 86
Research and Theory Implications ... 87
Practice Implications ... 88
Limitations ... 89
Future Directions ... 90
Conclusion ... 90
APPENDIX 1: QUALITY IMPROVEMENT TEAM QUESTIONNAIRE ... 92
APPENDIX 2: PROJECT OFFICER SURVEY ... 100
LIST OF TABLES
Table 1. Sample Characteristics ... 27
Table 2. Data Quality for Survey Items ... 28
Table 3. Goodness-of-Fit Statistics for Confirmatory Factor Analyses ... 30
Table 4. Correlation Between Factors ... 31
Table 5. Standardized Factor Loadings From Correlated Five-Factor Model at Individual, Within-Group, and Between-Group Levels ... 32
Table 6. Reliability and Average Inter-Item Correlation ... 33
Table 7. Interrater Agreement (Rwg(J)) and Intraclass Correlation (ICC1) for Each Factor ... 34
Table 8. Overview of Variables and Measures for Aim 2 ... 53
Table 9. Team-Level Descriptive Statistics ... 55
Table 10. Bivariate Correlations for Aim 2 ... 56
Table 11. Overview of Variables and Measures for Aim 3 ... 77
Table 12. Fit Statistics for Confirmatory Factor Analyses and Structural Models ... 78
Table 13. Interrater Agreement (Rwg(J)), Average Intraclass Correlation (ICC1), and ω Reliability for Latent Variables ... 79
Table 14. Team-Level Descriptive Statistics ... 80
Table 15. Bivariate Correlations for Aim 3 ... 82
Table 16. Standardized SEM Results for Aim 3 ... 84
LIST OF FIGURES
Figure 1. Correlated, Five-Factor Model ... 29
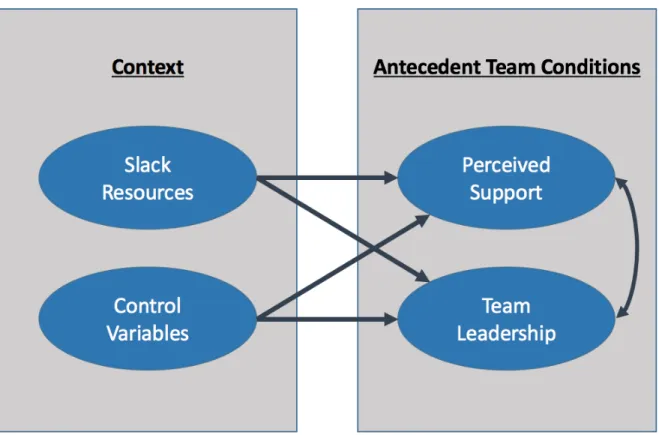
Figure 2. Slack and Antecedent Team Conditions ... 54
Figure 3. Standardized SEM Results for Aim 2 ... 57
Figure 4. Mediation Model of Work-Team Learning, as Tested ... 76
Figure 5. Standardized SEM Results for Aim 3 (Complete Mediation) ... 81
LIST OF ABBREVIATIONS AND SYMBOLS
BICs Schwarz Bayesian information criteria CFA Confirmatory factor analysis
CFI Comparative fit index DF Degrees of freedom ICC1 Intraclass correlation PFA Project Fives Alive! QI Quality improvement
RMSEA Root mean squared error of approximation
Rwg(j) Within-group reliability for a scale with "J" number of items SD Standard deviation
SE Standard error
SEM Structural equation modeling
α Alpha, the probability of incorrectly claiming statistical significance in any hypothesis test (Type I error)
CHAPTER 1: INTRODUCTION
Quality improvement (QI) is a systematic, data-driven approach to improve the delivery of healthcare services (Batalden & Davidoff, 2007). QI typically involves teams working together to identify and test improvements in care processes. First developed and popularized in high-income countries, QI interventions are now being implemented more frequently in lower-income countries (Leatherman, Ferris, Berwick, Omaswa, & Crisp, 2010). This dissertation focuses on the
implementation of Project Fives Alive! (PFA), one example of an effort to promote the use of QI methods in a lower-income country.
PFA was a nationwide program implemented in Ghana to reduce mortality in children under 5 years of age by improving "the processes of care during pregnancy through the most vulnerable period of labor, delivery, and postnatal care." PFA's primary strategy was the development of local QI teams. Teams were trained in QI methods and instructed to identify areas for improvement and to choose from a list of recommended strategies to reach quality goals (Twum-Danso et al., 2012). Recommended strategies were low-cost, high-impact, evidence-based practices. The data used in this dissertation are from Wave 4 of PFA, which focused on hospital-based teams in the seven southernmost regions of Ghana. Teams participated in four rounds of regional collaborative learning sessions where they shared their experiences with QI, discussed successes and failures, and received additional training in QI methods. Project officers provided support and helped the teams apply concepts from the collaborative learning sessions. Almost none of the QI teams existed prior to PFA. The 5-year project was funded by the Bill and Melinda Gates Foundation and was supported by the Institute for Healthcare Improvement and the National Catholic Health Service of Ghana.
Lukas, Mohr, & Meterko, 2009). Variation in the implementation of QI methods may explain the mixed results produced by QI interventions (Chassin & Loeb, 2011; Hulscher, Schouten, Grol, & Buchan, 2013; Taylor et al., 2014).
As the key implementing unit of QI initiatives, teams are critical for the success or failure of QI efforts (J. Hackman & Wageman, 1995). Although teams have the potential to deliver performance greater than the sum of the individual parts alone, teamwork also creates risk (Katzenbach & Smith, 1993). As a result, large-scale interventions involving many teams show that some QI teams are more effective than others and teams rarely achieve high levels of performance by accident (Kaplan et al., 2010).
Team effectiveness refers to the degree to which a team meets expectations set by the organization (J. Hackman, 1987). In the case of QI teams, team effectiveness is synonymous with QI implementation effectiveness, or the consistency and quality of innovation use (Klein & Sorra, 1996). In other words, effective teams are those that consistently apply QI methods in an effort to deliver local improvements in care quality. Team effectiveness is a function of numerous internal and external factors, such as the resources at the team’s disposal, team members' talents, and the interactions between team members (Lemieux-Charles & McGuire, 2006; Marks, Mathieu, & Zaccaro, 2001). Although researchers have yet to converge on a single unifying model of team effectiveness, the team literature reveals common themes. For example, predictors of team effectiveness are often grouped into several distinct domains. This dissertation focuses on factors from three key domains: 1) context; 2) team beliefs, attitudes, and emergent states; and 3) team processes and behaviors.
One key contextual factor studied in this dissertation is slack resources. Slack resources, refers to resources beyond the minimum of what is needed to meet operational goals (Zinn & Flood, 2009). Slack is essentially a function of supply and demand, where slack is created by increases in supply or decreases in demand (Scott & Davis, 2015). Although some view slack as evidence of inefficiency, slack resources have also been linked to the ability of organizations to innovate and adapt to environmental pressures (Bourgeois, 1981). Organizational slack has been shown to be associated with improved quality for some healthcare processes (Mohr & Young, 2012). Although no studies have evaluated the effect of slack resources on QI efforts, QI team members have other primary obligations to the organization and almost always face competing demands for their time and energy (Delise, Allen Gorman, Brooks, Rentsch, & Steele‐Johnson, 2010). As a result, QI teams are likely to function better with sufficient slack resources. The impact of organizational slack is likely magnified in lower-income countries where resources are already scarce and healthcare systems are not as well developed.
Context also includes antecedent team conditions, team-level characteristics that are essential for effective teams (Burke et al., 2006; Edmondson, 1999; Shortell et al., 2004). This dissertation focuses on two antecedent team conditions, support for teamwork and team leadership. Support for teamwork refers to the degree to which an organization provides adequate resources, information, and rewards in support of teamwork (Edmondson, 1999). Leadership is a complex, multidimensional construct (Zaccaro, Rittman, & Marks, 2002). However, this dissertation uses a narrow definition, where team leadership refers to the degree to which the team has a coaching-oriented leader who guides the work of the team (Edmondson, 1999).
Although antecedent team conditions are considered contextual factors, they themselves are often shaped by other contextual factors (Brennan et al., 2013; Edmondson, 1999). This dissertation explores the effect of slack resources on support for teamwork and coaching-oriented team
Although antecedent conditions are thought to determine much of how teams operate, antecedent conditions are considered distal predictors that almost always influence team
effectiveness through other factors (Brennan et al., 2013; S. G. Cohen & Bailey, 1997; Edmondson, 1999; Mathieu et al., 2008). Accordingly, a significant portion of the team literature focuses on a domain of mediators that are directly affected by antecedent conditions. This domain consists of beliefs, attitudes, and emergent team states such as psychological safety, team efficacy,
commitment, and values (S. G. Cohen & Bailey, 1997; Edmondson, 1999; B. J. Weiner, 2009). These fluid characteristics of teams are often seen as key targets for interventions to improve team
performance. Lastly, the aforementioned mediators act on team processes and behaviors, factors that are typically presented as the most proximal predictors of team effectiveness (Brennan et al., 2013; S. G. Cohen & Bailey, 1997; Kozlowski & Ilgen, 2006; Mathieu et al., 2008). Examples of processes include conflict management, communication, decision-making, and learning behavior.
Edmondson's model of work-team learning identifies psychological safety as a key factor affected by perceived support for teamwork and coaching-oriented team leadership (Edmondson, 1999). Team psychological safety refers to a shared belief that the team is a safe place for
The goal of this dissertation is to add to our understanding of factors related to the effectiveness of QI teams in lower-income countries and to support efforts to spread the use of QI methods to these settings. The overall objective is to test the ability of Edmondson's model of work-team learning to explain variation in the implementation of QI methods in Ghana (Edmondson, 1999). The central hypothesis is that team- and organization-level factors will be associated with the implementation of QI methods in Ghana. This hypothesis is tested with three research aims:
Aim 1: Assess psychometric properties, factor structure, and multilevel characteristics
of scales used to evaluate QI teams in Ghana.
Aim 2: Evaluate the effect of slack resources on perceived support for teamwork and
coaching-oriented team leadership in QI teams in Ghana.
Aim 3: Evaluate the effect of team psychological safety and team learning behavior on
the implementation of QI methods by QI teams in Ghana.
within a single region. As such, project officers are well positioned to provide an unbiased assessment of team effectiveness.
The analytical approach for all three aims was structural equation modeling (SEM).
Essentially, SEM consists of simultaneous multivariate regressions. SEM allows for the estimation of unobserved, latent variables using shared variance from observed variables, such as responses to individual items on a questionnaire. This accounts for and eliminates bias from measurement error (Bollen, 1989). Another advantage of SEM is that it allows researchers to simultaneously test multiple paths, a useful feature when working with complex frameworks that include mediation or moderation (Bollen, 1989). As a result, we were able to estimate and test direct, indirect, and total effects.
Despite the fact that QI is a team-driven approach, the role of the team has largely been overlooked, especially in lower-income countries (Kringos et al., 2015; Leatherman et al., 2010). This dissertation addresses this knowledge gap by applying the model of work-team learning to new contexts: 1) lower-income countries and 2) QI teams. Furthermore, this research focuses on predictors of implementation effectiveness, an understudied component of QI. This research also responds to calls by others to apply theory and practice-based knowledge to explore potential determinants of the success or failure of QI interventions (Hulscher et al., 2013). This work is particularly significant because it focuses lower-income countries that are both under-represented in the QI literature and often have the most to gain from efforts to increase the utilization of evidence-based practices. These findings will aid efforts to identify leverage points that can be targeted to support teams QI teams working in lower-income countries. Additionally, this dissertation is significant because it explores the relationships between factors from multiple domains, including contextual factors, antecedent conditions for teamwork, team beliefs, team behaviors, and team effectiveness.
used to evaluate relevant team factors are valid in different settings, where teams operate within a different culture, within a different organizational structure, and with different resources and
constraints. Chapter 3 addresses the effect slack resources on perceived support for teamwork and coaching-oriented team leadership, two key antecedent conditions in the model of work-team learning (Aim 2). No known studies have evaluated the effect of slack resources on QI efforts. Chapter 4 tests the ability of the model of work-team learning to explain variation in the implementation of QI methods by QI teams in Ghana (Aim 3). Finally, Chapter 5 reviews the study findings, summarizes the
CHAPTER 2: USING SURVEYS TO EVALUATE QUALITY IMPROVEMENT TEAMS IN GHANA: PSYCHOMETRIC AND CONFIRMATORY FACTOR ANALYSES AT THE INDIVIDUAL,
WITHIN-GROUP, AND BETWEEN-GROUP LEVELS
OVERVIEW
Background: Researchers have developed many well-validated scales to evaluate group-level factors associated with team effectiveness, but there is little evidence on how these scales perform with quality improvement (QI) teams in lower-income countries. To improve our ability to study QI teams in lower-income countries, we must demonstrate that these are valid in different settings. This study evaluates the use of 22 questions to measure five factors described in the model of work-team learning: perceived support for teamwork; coaching-oriented team leadership; team efficacy; team psychological safety; and team learning behavior.
Methods: We surveyed 559 individuals from 128 hospital-based QI teams working as part of Project Fives Alive! to reduce maternal and child mortality in the seven southernmost regions of Ghana. After exclusions, the remaining sample size was 526. Analyses included the following: 1) evaluation of data quality; 2) confirmatory factor analyses at the individual, within-group, and between-group levels; 3) calculation of ω reliabilities and average inter-item correlations; and 4) calculation of Rwg(j) and ICC1.
Results: Missingness was low (0.0–3.0%). One item had a floor effect above 15% and 14 items had a ceiling effect above 15%. Team efficacy had the lowest ω reliability at the between-group level (0.575), but all other factors were above 0.7. In general, confirmatory factor analyses showed good model fit for individual factors at each level of data and acceptable fit for a fully correlated, five-factor model. Conservative estimates of Rwg(j) exceeded 0.6 for all factors except team efficacy. Average ICC1 ranged from 0.114 to 0.323.
following recommendations will help improve comparability of results across settings: 1) carefully consider item wording; 2) include more than the minimum number of items needed for model identification; 3) limit respondent burden; 4) when possible, include more than five response categories for Likert-type questions, and 5) avoid negatively-worded questions when possible.
BACKGROUND
Quality improvement (QI) refers to a systematic, data-guided approach designed to bring about immediate improvements in the delivery of healthcare services (Lynn et al., 2007). Research has demonstrated the effectiveness of QI strategies in improving care quality and patient safety (Shojania et al., 2004). However, studies also reveal variation in the success of QI interventions, with some failing to produce the desired effects (Taylor et al., 2014). The failure of QI efforts may reflect a problem with implementation rather than innovation (Klein & Sorra, 1996). That is, even if QI is an effective strategy, it may not always be well implemented. As the key implementing unit of QI initiatives, teams are critical for the success or failure of QI efforts (J. Hackman & Wageman, 1995). However, despite a growing body of evidence on the influence of contextual factors on the
effectiveness of QI strategies, the role of the QI team is understudied (Kringos et al., 2015).
Furthermore, few studies have focused on QI interventions in lower-income countries (Kringos et al., 2015; Leatherman et al., 2010).
Most of the team-level factors evaluated in organizational behavior are latent variables. Latent variables refer to constructs that are not directly observed, but instead are estimated using shared variance among a set of observed variables (Bollen, 2002). Often, these observed variables are individual questions from a survey instrument. Although there is limited empirical evidence on the relationship between team factors and the effectiveness of QI interventions, teams are well studied in organizational behavior literature. Brennan et al. (2013) identified more than 100 instruments that have been applied in empirical work evaluating team-level factors, including many factors
there is little evidence on the use of survey instruments to evaluate QI teams in lower-income countries.
To help fill this gap, this study provides a psychometric and confirmatory factor analysis of a survey instrument used to measure five latent variables hypothesized to be related to team
effectiveness, including: 1) perceived support for teamwork; 2) coaching-oriented team leadership; 3) team efficacy; 4) team psychological safety; and 5) team learning behavior.
Perceived support for teamwork and coaching-oriented team leadership were selected in part because they were identified as key factors in a qualitative analysis of the functioning and
effectiveness of QI teams working in Ghana. Team efficacy, psychological safety, and learning behavior are part of the model of work-team learning, which provides an explanation for how
perceived support for teamwork and coaching-oriented team leadership influence team performance (Edmondson, 1999). This model resonated with other findings from the qualitative study of QI teams in Ghana.
Literature Review
In the model of work-team learning, perceived support for teamwork and coaching-oriented team leadership are antecedent conditions that influence team psychological safety and team efficacy (Edmondson, 1999). Edmondson (1999) refers to context support as the degree to which an
organization provides adequate resources, information, and rewards in support of teamwork. Shortell et al. (2004) refer to a similar factor called perceived organizational support. The literature on the effect of leadership on team effectiveness is well established (Burke et al., 2006; J. Hackman, 1987). However, it is worth noting that leadership is a complex, multidimensional construct (Zaccaro et al., 2002). This study focuses on a narrow definition of leadership. Here, we refer to team leadership as the degree to which the team has a coaching-oriented leader who guides the work of the team (Edmondson, 1999).
Team efficacy and psychological safety are team beliefs that mediate between the
group-level variable that refers to team members’ shared belief in the team’s ability to accomplish specific tasks (Lindsley, Brass, & Thomas, 1995). There is strong empirical evidence showing the positive effect of team efficacy on team performance (Gully, Incalcaterra, Joshi, & Beaubien, 2002; Kozlowski & Ilgen, 2006). Likewise, a strong body of work has shown that team psychological safety is associated with organizational learning and team performance (Edmondson & Lei, 2014). Defined as a shared belief that the team is a safe place for interpersonal risk taking, team psychological safety is often seen as a necessary ingredient for effective teamwork (Edmondson, 1999). When
psychological safety is low, team members may feel that active participation in a team requires too great of a risk.
Team learning behavior refers to a process of detecting and correcting error (Edmondson, 1999). Many studies have shown a positive relationship between learning behavior and team performance (Edmondson & Lei, 2014; Kozlowski & Ilgen, 2006). Moreover, because QI teams are engaged in work to reduce errors and improve organizational performance, team learning behavior is inherently key to the success of QI teams.
Summary
METHODS
Setting
A questionnaire was developed to evaluate QI teams working as part of Project Fives Alive! (PFA). PFA was a nationwide program in Ghana to reduce mortality in children under 5 years of age by developing local QI teams with the intention of scaling up evidence-based practices (Twum-Danso et al., 2012). The data used in this study are from Wave 4 of PFA, which focused on hospital-based teams in the seven southernmost regions of Ghana. Teams participated in four regional collaborative learning sessions where they shared their experiences with QI, discussed successes and failures, and received additional training in QI methods. Project officers provided support and helped the teams apply concepts from the collaborative learning sessions. Project officers generally worked with a specified set of teams. The 5-year project was funded by the Bill and Melinda Gates Foundation and was supported by the Institute for Healthcare Improvement and by the National Catholic Health Service of Ghana.
The Questionnaire
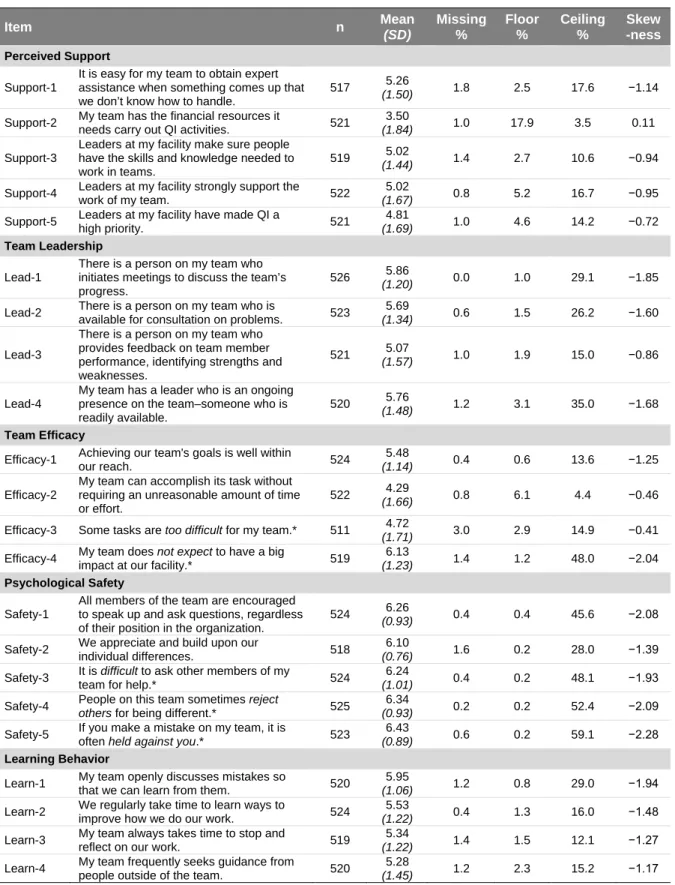
The study data were derived from responses to an 85-item questionnaire. The questionnaire included 27 questions related to the five factors analyzed in this study; we used 22 of these questions in this study (Table 2). The five corresponding scales used to measure the individual factors were adapted from the literature. Most of the items were drawn from Edmondson (1999), but questions were also based on work by Shortell et al. (2004), Kozlowski & Ilgen (2006), and Millward & Jeffries (2001). The questionnaire was administered in English, which is the official language of Ghana.
A draft of the team questionnaire was initially reviewed by project officers and staff in Ghana. Reviewers agreed that they understood the questions and that the questions addressed important issues. An earlier version of the questionnaire was also distributed to QI team members at the second round of collaborative learning sessions, which were held approximately 2 to 4 months after the teams were developed. We used the results from these surveys to guide revisions to the
psychological safety, but later added three questions to more closely match the instrument used by Edmondson. We also changed the response range from a 5-point Likert scale ranging from “disagree” to “agree” to a 7-point Likert scale with stronger anchors, from “completely disagree” to “completely agree.” Lastly, we made slight changes to the layout of the survey to emphasize question grouping and call out questions that were negatively worded.
The second version of the team questionnaire (the version analyzed in this study, which is presented in Appendix 1) was distributed to team members at the fourth round of collaborative learning sessions, approximately 16 to 18 months after teams were formed. Teams had been working together and carrying out QI activities for a substantial period of time, thus, respondents were likely better-prepared to answer questions about the team. Surveys were intended to be completed during the lunch break on the second day of the 2-day learning sessions. In reality, some surveys were completed on the first day. Some respondents were also allowed to take the surveys back to their hotel rooms to complete overnight after the first day. The surveys were part of an ongoing program evaluation, so all team members present were encouraged to respond.
Sample
In all, 128 hospital-based QI teams from 7 of 10 regions in Ghana were included in this analysis. An additional 13 teams participated in Wave 4 of PFA, but were not included in the analysis because they completed the old survey form (n = 9) or were absent from the fourth learning session (n = 4). A total of 559 surveys were submitted for an average of 4.4 responses per QI team.
Respondents include physicians, pharmacists, nurses, midwives, administrators, health informatics officers, and others. The surveys were completed during 13 separate collaborative learning sessions from May 2015 to September 2015. Although the response rate is unknown, project officers
encouraged all team members present at each learning session to complete the survey. Paper survey forms were double-coded by two staff members in Ghana. Responses with discrepancies between the two staff members were recoded.
positively-worded questions (n = 26) (i.e., consistently answering “agree” or “completely agree” for both positively and negatively-worded questions). The final sample included 526 surveys from 127 teams for an average of 4.1 respondents per team.
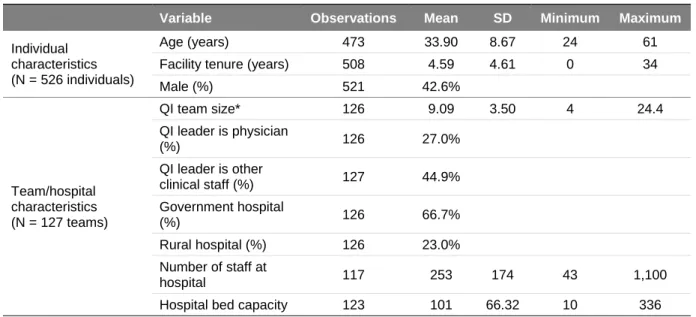
Respondents from the analytical sample had an average age of 33.9 years, had worked at their hospital for an average of 4.6 years, and 42.6% were male (Table 1). The average QI team had 9.1 team members. Physicians led 27.0% of teams, 44.9% of teams were led by other clinical staff, and the remaining teams were led by administrative staff or managers. QI teams came from hospitals with an average of 253 staff members and 101 beds. Approximately 66.7% of hospitals were
government-run and 23.0% were in rural areas.
Analyses
The analyses consisted of four parts: First, we assessed data quality. Second, we conducted confirmatory factor analyses (CFAs) of individual factors as well as a correlated, five-factor model. We compared CFA results at three levels: individual; within-group; and between-group. Third, we calculated reliabilities (McDonald’s omega [ω]) and average inter-item correlations for each level. Finally, because the instruments were designed to measure team-level phenomena, we examined group-level characteristics using Rwg(j) and one-way analysis of variance (ICC1). Analyses were conducted in Mplus (v 7.4) and Stata 14.
Data Quality: All questions used a 7-point Likert scale where 1 = completely disagree and 7 = completely agree. Five negatively-worded questions were reverse coded in all analyses
(1 = completely agree and 7 = completely disagree). Data quality was evaluated in terms of the mean and standard deviation, missingness, floor, ceiling effects, and skewness. Floor and ceiling effects refer to the percent of respondents selecting the lowest and highest response categories,
respectively. The preferred range for floor and ceiling effects is 1% to 15% (McHorney & Tarlov, 1995). Values above 15% signify that responses were grouped at one end of the response scale. This indicates that some respondents would likely answer outside of the allowed range and that the data are essentially censored.
Confirmatory Factor Analyses: Because the surveys were adapted from existing
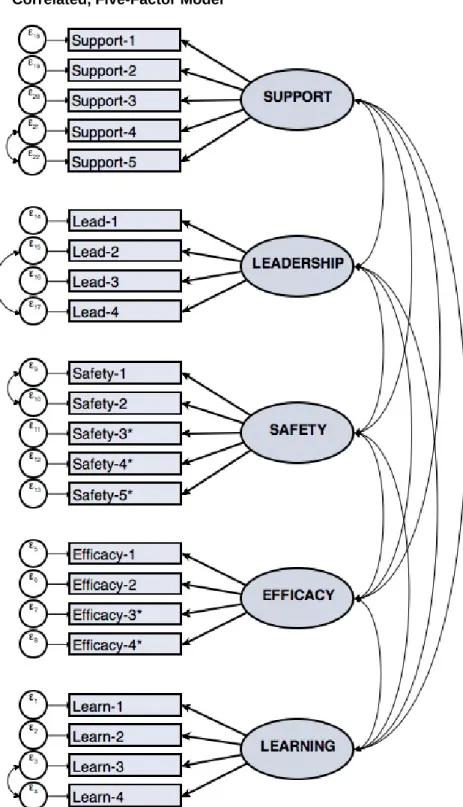
Although maximum likelihood estimation may not be appropriate for analyzing non-continuous variables with few response categories or severely asymmetrical distributions, studies have shown that Likert-type questions can approximate continuous data when they have 6 or more response options and the distributions are not highly skewed (Kline, 2015; Rhemtulla, Brosseau-Liard, & Savalei, 2012). Thus, we conducted CFAs using maximum likelihood estimation with missing values imputed and robust standard errors. Individual-level analyses were conducted with clustered errors at the team level. Items were evaluated with their individual factors in separate analyses. The factors were then included in a correlated five-factor model (Figure 1).
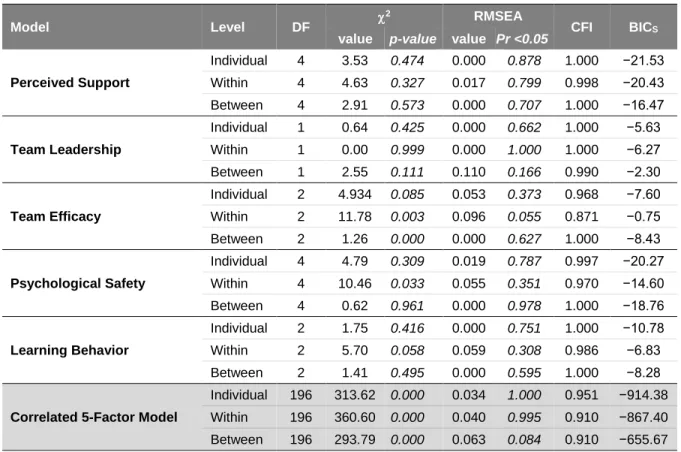
We evaluated goodness-of-fit using a scaled chi-squared (χ2) value, comparative fit index (CFI), and root mean squared error of approximation (RMSEA). Revisions to models were based on theory and substantive knowledge and were evaluated using these measures as well as the Schwarz Bayesian information criteria (BICS). An insignificant χ2value was defined as ideal, however, this measure is more likely to be significant with a larger sample size, so other fit measures are better suited for this type of study (Bollen, 1989). CFI ranges from 0 to 1, where a value greater than 0.9 shows acceptable fit and a value greater than 0.95 shows good fit (Hu & Bentler, 1999). RMSEA ranges from 0 to 1 and a lower value is ideal. RMSEA under 0.05 demonstrates good fit and RMSEA under 0.08 demonstrates acceptable model fit (Bollen & Paxton, 2000). When evaluating revisions to models, a more negative BICS value indicates better fit (Raftery, 1995; Schwarz, 1978).
fit over the individual-level data (Dyer, Hanges, & Hall, 2005). In contrast, if group-level characteristics contribute to the majority of the construct-related variance, the within-group level should show worse fit and the between-group level should show improved fit (compared to the individual level) (Dyer et al., 2005). Comparing fit at each level may also provide an indication of the amount of bias introduced by aggregating multilevel data, with the bias being smaller if the within-group and between-group levels are more similar (Pornprasertmanit et al., 2014).
Reliability and Average Inter-Item Correlation: Reliability refers to the degree to which individual items appear to measure the same factor. Reliability was measured using McDonald’s ω which relaxes the assumption of tau-equivalence among items for a single factor (McDonald, 2013). Tau-equivalence requires items to have equivalent factor loadings and contribute equally to the true-score variance of a factor (McDonald, 2013). Although 0.70 is frequently cited as the cutoff for measures of reliability, a higher value is ideal (DeVellis, 2012; Lance, Butts, & Michels, 2006). Reliability was also measured using average inter-item correlation, which is independent of sample size and number of items. Although there is no clear cutoff for average inter-item correlation, some researchers have suggested preferred values greater than 0.40 (Ware & Gandek, 1998). We report ω reliability and average inter-item correlation at each level of analysis.
ICC1 is a measure of the proportion of variance in individual responses that can be explained by group-level effects to (Bliese & Halverson, 1998; James et al., 1984). No clear cutoff for ICC1 exists, but Bliese (2000) notes that ICC1 greater than 0.30 is rare. Others suggest that ICC1 as low as 0.05 may be sufficient justification to aggregate data to the group level (Biemann et al., 2012).
RESULTS
Data Quality
After exclusions, there were 526 surveys remaining. For these surveys, there was very little missing data among the items (Table 2). Across the 22 items, the percent missing ranged from 0.0% to 3.0%. There was no response option for “don’t know” or “not applicable”, so respondents were instructed to answer each question to the best of their ability. Given the completeness of the data, missingness was not likely an issue (Allison, 2002).
The majority of the items were significantly skewed, with responses grouped toward the higher end of the scale. Only three items, Support-2, Efficacy-2, and Efficacy-3, had a skewness greater than −0.5, demonstrating a fairly even distribution. Support-2 and Efficacy-2 were also the only items with a ceiling effect less than 10%. Only six other items had a ceiling effect less than 15% (Support-3, Support-5, Lead-3, Efficacy-1, Efficacy-3, and Learn-3). Overall, the ceiling effect ranged from 3.5% to 59.1%. Support-2 was also the only item with a significant floor effect (17.9% of
respondents selected the lowest category). No other item had a floor effect less than 6.1%.
Confirmatory Factor Analyses
for consultation. Safety-1 and Safety-2 were positively-worded whereas the other three items in the scale were negatively-worded (e.g., “if you make a mistake on my team, it is often held against you”). Efficacy-3 and Efficacy-4 were negatively-worded whereas the other two items in the scale were positively-worded. Lastly, Learn-2 and Learn-3 both referred to taking time to reflect on how work is done. These modifications were tested at the individual and between-group levels. All of the modifications significantly improved model fit at one or both levels except the correlation between Efficacy-3 and Efficacy-4. All results presented include the four significant pairs of correlated errors as shown in Figure 1.
Goodness-of-fit statistics are presented in Table 3. With two exceptions, individual factors demonstrated good fit across all three levels. At the within-group level, team efficacy resulted in a significant χ2, CFI of 0.871, and RMSEA of 0.096, indicating poor fit. However, fit for team efficacy was acceptable at the individual level and good at the between-group level. Also, whereas coaching-oriented team leadership resulted in excellent fit at the individual and within-group levels (according to χ2, CFI, and RMSEA), RMSEA at the between-group level was 0.110. However, p-value for the between-group RMSEA was still insignificant and CFI was 0.990. For perceived support for teamwork, team psychological safety, and team learning behavior, the between-group–level model produced the best fit, followed by the individual-level model, and then the within-group–level model. However, differences between the three models were marginal, with RMSEA showing the greatest differences of the fit statistics.
differences in magnitude when comparing the individual level to the between-group level, with the latter being larger. The remaining correlations were similar in magnitude at the individual level and between-group level.
Reliabilities and Average Inter-Item Correlations
Across all levels, team efficacy and psychological safety had the smallest factor loadings (Table 5) and produced the lowest ω reliability and average inter-item correlations (Table 6). Team efficacy had an ω reliability of 0.512 and average inter-item correlation of 0.200. The ω reliability for team psychological safety was 0.676 and the average inter-item correlation was 0.387. In every case, the ω reliabilities and average inter-item correlations were marginally higher at the between-group level than the individual level. The ω reliabilities and average inter-item correlations are substantially lower at the within-group level. Except for team efficacy, all factors exceeded the minimum cutoff of 0.7 for ω and 0.4 for average inter-item correlation at the between-group level.
Group-Level Characteristics
Table 7 presents Rwg(j) values and average ICC1 values (A. Cohen, Doveh, & Nahum-Shani, 2009). Because skewed data can result in inflated Rwg(j) values when calculated, assuming a uniform distribution (σ2
EU = 4.0 with seven response categories), we also calculated Rwg(j) based on an alternative distribution that adjusts for the skewness of the data (the skewness of each item is shown in Table 2) (LeBreton & Senter, 2008). Specifically, the alternative Rwg(j) value for perceived support (0.625) assumed a slightly skewed distribution with σ2
EU = 2.9. The alternative Rwg(j) values for team leadership (0.608), team efficacy (0.416), and learning behavior (0.636) assumed moderately skewed distributions with σ2EU = 2.14. The alternative Rwg(j) value for psychological safety (0.733) assumed a heavily skewed distribution with σ2
EU = 1.39.
DISCUSSION
This study explores the application of survey instruments used to measure factors from the model of work-team learning. Given the fact that the vast majority of team research takes place in lower-income countries, it was important to validate the use of the survey tool in this setting. To our knowledge, this is the first psychometric and factor analysis of the adaptation of survey instruments to measure team-level constructs among QI teams working in lower-income countries. Here, we discuss the multilevel features of the data and implications for future research.
Specific Findings
Although project staff confirmed that the questions made sense and addressed important topics, the low amount of missing data across the items also demonstrates the acceptability of the questions. Nearly all of the items used in this analysis were skewed, with responses grouped toward the high end of the response scale. Fourteen of 22 items exceeded the recommended cutoff of 15% for floor effects. Four of the negatively-worded questions had ceiling effects above 40%. Two outliers, Support-2 and Efficacy-2, had ceiling effects below 5%, which may warrant further exploration.
Of the five factors analyzed in this paper, team efficacy, a four-item scale with two positively-worded questions and two negatively-positively-worded questions, had a the lowest ω reliability (0.512) and lowest average inter-item correlation (0.2) at the individual level. These values were slightly higher at the group level, but still well below the minimum recommended cutoffs of 0.7 and 0.4, respectively. Despite the low reliability and average inter-item correlation, team efficacy resulted in acceptable fit at the individual level and good fit at between-group level. Although the survey instrument for team efficacy could likely be improved, CFA accounts for measurement error, allowing factors with less than ideal reliabilities to be utilized in studies with unbiased results. The tradeoff would be inflated standard errors and a tendency toward null findings (Bollen, 1989).
likely due to the use of negatively-worded questions. However, the ω reliability was greater than 0.7 and the average inter-item correlation was above 0.4 at the between-group level.
With the exception of the between-group level for team leadership, the team leadership, perceived support, and learning behavior scales demonstrated great model from CFAs at all three levels. These three factors also had higher ω reliabilities that are close to or exceed the
recommended cutoff of 0.8 for widely used scales at the individual level and between-group level (Lance et al., 2006). These factors also substantially exceeded the suggested average inter-item correlation of 0.4 at the individual level and between-group level (Ware & Gandek, 1998). This is strong evidence of the effectiveness of the survey instruments as measurement tools. Additionally, the correlated, five-factor model demonstrated good model fit at the individual level and acceptable model fit at the within-group and between-group levels. These results support the proposed factor structure, suggesting that any model misspecifications are minor. Any improvements in model fit would likely have to be sought by improving the survey instrument itself, rather than by changing the factor structure.
Although a multilevel approach is ideal, the fit statistics were only marginally improved at the between-group level compared within-group levels, suggesting that analyses using aggregated data would only include a small degree of bias (Pornprasertmanit et al., 2014). Furthermore, the
overarching similarities in the correlations at the between-group level and individual level support our hypothesis that the factors measured are composition factors that operate isomorphically, with similar relationships at the individual and between-group levels (Dyer et al., 2005). This was our intention when we adapted and developed survey questions. Our questions reference the team and were intended to reflect characteristics of the teams more than of the individuals. Additionally, conservative estimates of Rwg(j) exceeded 0.600 for all factors other than team efficacy, demonstrating moderate agreement at the group level. All factors had non-trivial ICC1, ranging from a low of 0.114 for team efficacy to 0.323 for perceived support. Collectively, the group-level statistics also provide reasonable evidence to suggest that the factors tap group-level phenomena and support the decision to
Implications and Future Recommendations
Adapting Instruments to Different Settings: The results of this analysis demonstrate that survey tools developed to evaluate teams in high-income countries can be successfully be adapted and used to measure similar constructs in lower-income countries, like Ghana. However, the results indicate that revisions could improve some of the scales. For example, for some questions, reliability and normality of data could likely be improved by removing words referring to frequency from the questions (e.g., “sometimes” and “often”), using an alternative response scale, and avoiding phrases that likely elicit reactions (e.g., “reject others”). Additionally, in terms of response distribution, two questions were outliers. These questions refer to the availability of “financial resources” and the ability for teams to complete tasks without an “unreasonable amount of time or effort,” respectively. This analysis focuses on QI teams working in Ghana, a lower-income country, so the fact that teams report a lack of financial resources and difficulty completing tasks is not surprising. Although these results may be highly informative, this demonstrates the need to more closely consider context when developing or adapting survey questions.
Future work should continue to explore concepts like psychological safety and learning behavior in lower-income countries; other team-level factors should also be explored. Given the large number of existing survey instruments measuring team-level factors (Brennan et al., 2013), an emphasis should be placed on refining existing survey tools rather than creating new survey instruments. The emergence of survey tools that are valid across cultures and settings will help advance our understanding of teams in non-traditional research settings. As QI efforts continue to spread in lower-income countries, this will be a key step in understanding features of QI teams that are associated with success.
had we used more than four items to measure the factor. Second, using more than the minimum number of items will help protect against unexpected issues related to translation or cultural
adaptation. For example, if we had more than four items for team efficacy, we would have been able to consider excluding one or more of the items with low factor loadings from the analysis. Third, team research should include more items than individual research. Like measures of reliability, the
inclusion of more items increases the ability to control for measurement error and increases the value of Rwg(j) (Biemann et al., 2012). And finally, the use of more than the minimum number of items will also aid efforts to identify key elements of a factor and improve comparability across studies.
Number of Response Categories: As mentioned previously, the data described in this paper are from a survey distributed 16-18 months after teams were established. An earlier version was distributed approximately 2 to 4 months after teams were developed. Due to concerns about cultural differences and suitability for lower-income countries, the earlier version of the survey initially used a 5-point Likert scale with relatively weak anchors (“disagree” and “agree”). However, the results from the early version of the survey were highly skewed and had an average ceiling effect of more than 60% for all items. As a result, we changed the response scale to a 7-point Likert scale with stronger anchors (“completely disagree” to “completely agree”).
The data quality and CFAs suggest that a 7-point Likert scale is indeed acceptable in different cultural settings, particularly when respondents have relatively high levels of education (nurses, physicians, midwives, etc). Moreover, compared to 5-point Likert scales, researchers have shown that 7-point Likert scales are closer to being approximately continuous (Rhemtulla et al., 2012) and result in higher reliabilities (Weng, 2004). Whenever possible, a 7-point Likert scale should be used instead of a scale with fewer response options. When questions are likely to produce skewed results, a wider response scale with stronger anchors will help improve the normality of the data and reduce ceiling and floor effects. Alternative scales based on frequency or degree could also improve results.
factors. However, the results in this study and elsewhere suggest that avoiding negatively-worded questions will improve survey validity (Barnette, 2000; Stewart & Frye, 2004). Furthermore, we expect that avoiding negatively-worded questions will increase the ability to compare results across studies, a key step to advancing the study of QI teams (Brennan et al., 2013). Although we felt that negatively-worded questions captured concepts that could not be similarly conveyed with positively-negatively-worded questions, there are likely alternative phrasings that we did not consider. If alternative phrasing will not sufficiently capture all dimensions of a factor, researchers should be wary of the potential for negatively-worded questions to reduce the overall reliability and validity of a survey instrument. Another option is the use of frequency-based response scales. This could help limit reliability issues caused by negatively-worded questions.
Although we were concerned with the potential for response sets (where respondents’ answers are based more on their feelings about a subject than on the content of an individual item), we did not incorporate the negatively-worded questions in survey design with the intention to break up response sets. However, we did use the negatively-worded questions to identify non-attendance. That is, we excluded respondents who did not distinguish between the negatively-worded questions and positively-worded questions. Although the non-attendance lowers reliability for factors that contain both positively- and negatively-worded questions, non-attendance promotes response sets and results in positive bias for factors with only positively-worded questions.
Response sets and non-attendance are likely to remain issues with survey research. Future projects could attempt to reduce response sets and non-attendance in other ways. In particular, these issues provide a strong reason for researchers to limit respondent burden, even in program
questionnaire used in this study. This consideration may be critical when adapting a questionnaire to a new setting, like Ghana. However, reducing the number of factors and items in a questionnaire may hinder efforts to explore more comprehensive models. When reducing the length of the survey is absolutely not possible, an alternative may be to split the survey into two surveys and distribute them at separate times.
Limitations
Although this study does not include a full assessment of content validity or cognitive interviewing of items, the scales were adapted from existing studies used in high-income settings. Furthermore, the initial survey tool was developed based on feedback from potential respondents and project staff in Ghana. In addition to providing valuable feedback, all reviewers agreed that they understood the questions and that they were addressing important issues. For this reason, we feel that content validity is high.
The factors analyzed in this study have been established as group-level phenomena, but a multilevel analysis would be ideal. However, multilevel models are notorious for having issues with model convergence when the cluster size is low, ICC1 is low, or when ICC1 varies across items (Pornprasertmanit et al., 2014). We presented and analyze differences between individual-level, within-group–level, and between-group–level analyses. Furthermore, the Rwg(j) and ICC1 values present provide strong justification for aggregating data.
CONCLUSIONS
As with all surveys, researchers should carefully consider item wording. This becomes even more important when adapting a tool to a different setting. Pre-testing surveys with potential
TABLES AND FIGURES
Table 1. Sample Characteristics
Variable Observations Mean SD Minimum Maximum
Individual characteristics (N = 526 individuals)
Age (years) 473 33.90 8.67 24 61
Facility tenure (years) 508 4.59 4.61 0 34
Male (%) 521 42.6%
Team/hospital characteristics (N = 127 teams)
QI team size* 126 9.09 3.50 4 24.4
QI leader is physician
(%) 126 27.0%
QI leader is other
clinical staff (%) 127 44.9% Government hospital
(%) 126 66.7%
Rural hospital (%) 126 23.0% Number of staff at
hospital 117 253 174 43 1,100
Hospital bed capacity 123 101 66.32 10 336
Table 2. Data Quality for Survey Items
Item n Mean
(SD) Missing % Floor % Ceiling % Skew -ness Perceived Support Support-1
It is easy for my team to obtain expert assistance when something comes up that we don’t know how to handle.
517 5.26
(1.50) 1.8 2.5 17.6 −1.14
Support-2 My team has the financial resources it
needs carry out QI activities. 521
3.50
(1.84) 1.0 17.9 3.5 0.11
Support-3
Leaders at my facility make sure people have the skills and knowledge needed to work in teams.
519 5.02
(1.44) 1.4 2.7 10.6 −0.94
Support-4 Leaders at my facility strongly support the
work of my team. 522
5.02
(1.67) 0.8 5.2 16.7 −0.95
Support-5 Leaders at my facility have made QI a
high priority. 521
4.81
(1.69) 1.0 4.6 14.2 −0.72
Team Leadership
Lead-1
There is a person on my team who initiates meetings to discuss the team’s progress.
526 5.86
(1.20) 0.0 1.0 29.1 −1.85
Lead-2 There is a person on my team who is
available for consultation on problems. 523
5.69
(1.34) 0.6 1.5 26.2 −1.60
Lead-3
There is a person on my team who provides feedback on team member performance, identifying strengths and weaknesses.
521 5.07
(1.57) 1.0 1.9 15.0 −0.86
Lead-4
My team has a leader who is an ongoing presence on the team–someone who is readily available.
520 5.76
(1.48) 1.2 3.1 35.0 −1.68
Team Efficacy
Efficacy-1 Achieving our team's goals is well within
our reach. 524
5.48
(1.14) 0.4 0.6 13.6 −1.25
Efficacy-2
My team can accomplish its task without requiring an unreasonable amount of time or effort.
522 4.29
(1.66) 0.8 6.1 4.4 −0.46
Efficacy-3 Some tasks are too difficult for my team.* 511 4.72
(1.71) 3.0 2.9 14.9 −0.41
Efficacy-4 My team does impact at our facility.* not expect to have a big 519 6.13
(1.23) 1.4 1.2 48.0 −2.04
Psychological Safety
Safety-1
All members of the team are encouraged to speak up and ask questions, regardless of their position in the organization.
524 6.26
(0.93) 0.4 0.4 45.6 −2.08
Safety-2 We appreciate and build upon our
individual differences. 518
6.10
(0.76) 1.6 0.2 28.0 −1.39
Safety-3 It is difficult to ask other members of my
team for help.* 524
6.24
(1.01) 0.4 0.2 48.1 −1.93
Safety-4 People on this team sometimes reject
others for being different.* 525
6.34
(0.93) 0.2 0.2 52.4 −2.09
Safety-5 If you make a mistake on my team, it is
often held against you.* 523
6.43
(0.89) 0.6 0.2 59.1 −2.28
Learning Behavior
Learn-1 My team openly discusses mistakes so that we can learn from them. 520 5.95
(1.06) 1.2 0.8 29.0 −1.94
Learn-2 We regularly take time to learn ways to
improve how we do our work. 524
5.53
(1.22) 0.4 1.3 16.0 −1.48
Learn-3 My team always takes time to stop and
reflect on our work. 519
5.34
(1.22) 1.4 1.5 12.1 −1.27
Learn-4 My team frequently seeks guidance from
people outside of the team. 520
5.28
(1.45) 1.2 2.3 15.2 −1.17
N = 526 individuals from 127 teams.
Figure 1. Correlated, Five-Factor Model
Table 3. Goodness-of-Fit Statistics for Confirmatory Factor Analyses
Model Level DF χ
2 RMSEA
CFI BICS value p-value value Pr <0.05
Perceived Support
Individual 4 3.53 0.474 0.000 0.878 1.000 −21.53 Within 4 4.63 0.327 0.017 0.799 0.998 −20.43 Between 4 2.91 0.573 0.000 0.707 1.000 −16.47
Team Leadership
Individual 1 0.64 0.425 0.000 0.662 1.000 −5.63 Within 1 0.00 0.999 0.000 1.000 1.000 −6.27 Between 1 2.55 0.111 0.110 0.166 0.990 −2.30
Team Efficacy
Individual 2 4.934 0.085 0.053 0.373 0.968 −7.60 Within 2 11.78 0.003 0.096 0.055 0.871 −0.75 Between 2 1.26 0.000 0.000 0.627 1.000 −8.43
Psychological Safety
Individual 4 4.79 0.309 0.019 0.787 0.997 −20.27 Within 4 10.46 0.033 0.055 0.351 0.970 −14.60 Between 4 0.62 0.961 0.000 0.978 1.000 −18.76
Learning Behavior
Individual 2 1.75 0.416 0.000 0.751 1.000 −10.78 Within 2 5.70 0.058 0.059 0.308 0.986 −6.83 Between 2 1.41 0.495 0.000 0.595 1.000 −8.28
Correlated 5-Factor Model
Individual 196 313.62 0.000 0.034 1.000 0.951 −914.38 Within 196 360.60 0.000 0.040 0.995 0.910 −867.40 Between 196 293.79 0.000 0.063 0.084 0.910 −655.67 N(individual) = 526; N(within) = 526; N(between) = 127
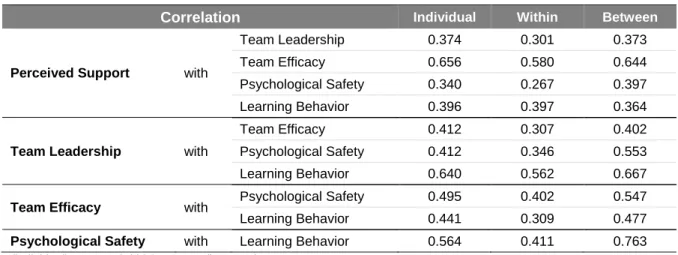
Table 4. Correlation Between Factors
N(individual) = 526; N(within) = 526; N(between) = 127
Correlation Individual Within Between
Perceived Support with
Team Leadership 0.374 0.301 0.373
Team Efficacy 0.656 0.580 0.644
Psychological Safety 0.340 0.267 0.397
Learning Behavior 0.396 0.397 0.364
Team Leadership with
Team Efficacy 0.412 0.307 0.402
Psychological Safety 0.412 0.346 0.553
Learning Behavior 0.640 0.562 0.667
Team Efficacy with Psychological Safety 0.495 0.402 0.547
Learning Behavior 0.441 0.309 0.477
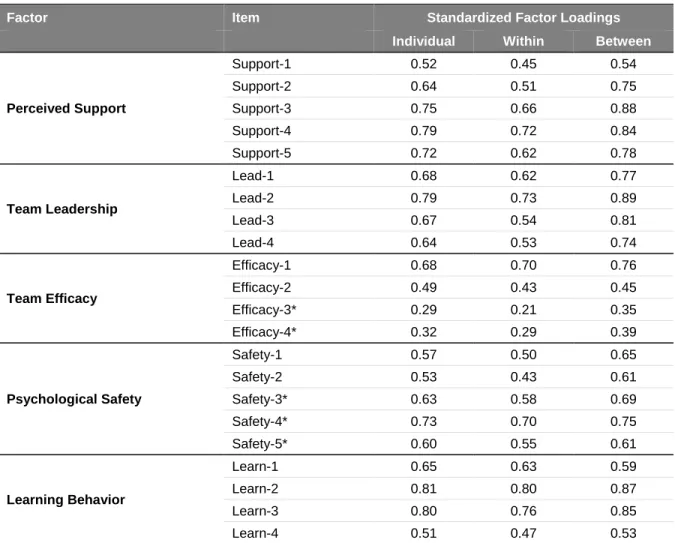
Table 5. Standardized Factor Loadings From Correlated Five-Factor Model at Individual, Within-Group, and Between-Group Levels
Factor Item Standardized Factor Loadings
Individual Within Between
Perceived Support
Support-1 0.52 0.45 0.54
Support-2 0.64 0.51 0.75
Support-3 0.75 0.66 0.88
Support-4 0.79 0.72 0.84
Support-5 0.72 0.62 0.78
Team Leadership
Lead-1 0.68 0.62 0.77
Lead-2 0.79 0.73 0.89
Lead-3 0.67 0.54 0.81
Lead-4 0.64 0.53 0.74
Team Efficacy
Efficacy-1 0.68 0.70 0.76
Efficacy-2 0.49 0.43 0.45
Efficacy-3* 0.29 0.21 0.35
Efficacy-4* 0.32 0.29 0.39
Psychological Safety
Safety-1 0.57 0.50 0.65
Safety-2 0.53 0.43 0.61
Safety-3* 0.63 0.58 0.69
Safety-4* 0.73 0.70 0.75
Safety-5* 0.60 0.55 0.61
Learning Behavior
Learn-1 0.65 0.63 0.59
Learn-2 0.81 0.80 0.87
Learn-3 0.80 0.76 0.85
Learn-4 0.51 0.47 0.53
Table 6. Reliability and Average Inter-Item Correlation
N(individual) = 526; N(within) = 526; N(between) = 127
Model Level Reliability
(ω)
Average Inter-Item Correlation
Perceived Support
Individual 0.788 0.472
Within 0.719 0.353
Between 0.819 0.575
Team Leadership
Individual 0.771 0.475
Within 0.699 0.363
Between 0.780 0.613
Team Efficacy
Individual 0.512 0.200
Within 0.460 0.172
Between 0.575 0.222
Psychological Safety
Individual 0.676 0.387
Within 0.623 0.327
Between 0.716 0.447
Learning Behavior
Individual 0.789 0.467
Within 0.762 0.428
Table 7. Interrater Agreement (Rwg(J)) and Intraclass Correlation (ICC1) for Each Factor
Factor Rwg(J) ICC1
Uniform Alternate Distribution
Perceived Support 0.780 0.625
(slightly skewed) 0.323
Team Leadership 0.790 0.608
(moderately skewed) 0.239
Team Efficacy 0.773 0.416
(moderately skewed) 0.114
Psychological Safety 0.931 0.733
(heavily skewed) 0.142
Learning Behavior 0.825 0.636
CHAPTER 3: QUALITY IMPROVEMENT TEAMS IN LOWER-INCOME COUNTRIES: THE ROLE OF SLACK RESOURCES
OVERVIEW
Background: The concept of slack resources may help explain how context affects the work of quality improvement (QI) teams. In organizational theory, slack refers to the availability of
resources beyond the minimum of what is needed to achieve an organization’s primary goals. QI team members often have competing demands for time and energy. When slack resources are limited, team members will likely prioritize their primary functions over QI. When slack resources are more abundant, teams will likely report better access to information, more time to focus on QI work, improved staffing, and access to other resources. Slack resources will also likely allow for greater attention and support from QI leaders.
Methods: We used structural equation modeling to evaluate the effect of slack resources on perceived support for teamwork and coaching-oriented team leadership. We conducted the analysis at the team level, aggregating individual level survey data from 467 QI team members to the team level. The final analysis included 112 teams. We assessed model fit and tested significance of standardized parameters.
Results: The structural model demonstrated good model fit (RMSEA = 0.029, p = 0.850; CFI = 0.983). Our primary measure of slack, staff-to-bed ratio, was positively associated with both perceived support for teamwork (β = 0.26, p = 0.04) and coaching-oriented team leadership (β = 0.19, p = 0.05). Working in a rural hospital (β = 0.86; p < 0.01) and QI team size (β = 0.29; p < 0.01) were both positively associated with team leadership, but were not associated with perceived support.
Conclusions: The results support our overall hypothesis that the availability of slack
coaching-primary obligations, teams are likely to operate with limited slack resources, especially in lower-income countries where resources are already scarce. Scarcity of slack resources may necessitate additional coaching or other creative strategies to support QI work.
BACKGROUND
Quality improvement (QI) refers to a systematic, data-driven approach to improve the delivery of healthcare services (Batalden & Davidoff, 2007). QI typically involves teams identifying and testing improvements in care processes. As such, the functioning of the team itself is critical to the
effectiveness of QI interventions. Despite the increased adoption of QI methods, QI efforts often fail to deliver the desired improvements in healthcare quality and safety (Taylor et al., 2014). Unfortunately, the role of the team has been largely overlooked in existing QI research, especially in low-income countries (Kringos et al., 2015).
We address this knowledge gap by evaluating team factors related to the implementation of QI by teams from Project Fives Alive! (PFA). PFA was a nationwide program in Ghana implemented to reduce mortality in children under 5 years of age by promoting the use of evidence-based practices (Twum-Danso et al., 2012). PFA’s primary strategy was the development and training of local
hospital- and community-based teams in the use of QI methods. The 5-year project was funded by the Bill and Melinda Gates Foundation and was supported by the Institute for Healthcare
Improvement and the National Catholic Health Service of Ghana. This study focuses on PFA-affiliated hospital-based QI teams from the seven southernmost regions of Ghana. Almost none of the QI teams existed prior to PFA. As part of PFA, the teams participated in four regional collaborative learning sessions where they shared their experiences with QI, discussed successes and failures, and received additional training in QI methods. Regional project officers provided assistance and helped the teams apply concepts from the collaborative learning sessions.
QI Teams
determined by numerous internal and external factors. Among these factors are antecedent
conditions that are necessary for team members to be able to work together and function effectively as a single unit (Brennan et al., 2013; Edmondson, 1999; Kozlowski & Ilgen, 2006; Marks et al., 2001; Mathieu et al., 2008).
A recent qualitative study of PFA identified two well-known antecedent conditions as key determinants of how well teams function: 1) support for teamwork and 2) effective leadership. Support includes such elements as time, human resources, physical resources, money, information, and training. It is not surprising that QI teams that receive adequate support from management are more likely to accomplish their goals (Lemieux-Charles & McGuire, 2006; Lukas et al., 2009). Active and effective leadership is also associated with team effectiveness (Shortell et al., 2004; Zaccaro et al., 2002). Leaders help define team goals and develop and structure the team to accomplish these goals (Zaccaro et al., 2002). Leaders perform other tasks as well, such as identifying and resolving
conflicts, monitoring team progress, and working to acquire resources and team support. Teams operate within a specific context that influences much of what the team does. Numerous models and theories of team effectiveness include team- and organizational-context as distal antecedents that influence team effectiveness (Brennan et al., 2013; Lemieux-Charles & McGuire, 2006). In PFA, for example, project staff and facility managers play a large role in
establishing QI teams. Additionally, the type and number of staff, hospital characteristics, demand for services, and other contextual factors shape the environment in which teams work. As a result, support and leadership are often determined by factors that are external to the team. However, to our knowledge, no study has looked at the relationship between contextual factors and antecedent team conditions in QI teams in lower-income countries.
Slack Resources
Slack resources refer to resources beyond the minimum of what is needed to meet
the effect of slack resources on QI efforts, QI team members have other primary obligations to the organization and almost always face competing demands for their time and energy (Delise et al., 2010). As a result, QI teams are likely to function better with sufficient slack resources. The impact of organizational slack is likely magnified in lower-income countries where resources are already scarce and healthcare systems are not as well developed.
Summary
This study has two objectives: first, to evaluate the effect of slack resources on perceived support for teamwork and coaching-oriented team leadership; and second, to further motivate slack as a multidimensional construct by exploring other team and organizational factors related slack.
METHODS
Theoretical Framework and Hypotheses
The outcomes of interest in this study are perceived support for teamwork and team leadership, antecedent conditions thought to influence much of how teams operate (Brennan et al., 2013; S. G. Cohen & Bailey, 1997; Edmondson, 1999; Mathieu et al., 2008). Perceived support for teamwork is a latent variable that refers to the degree to which team members feel that an
organization provides adequate resources, information, and rewards in support of teamwork
Our central hypothesis is that the availability of slack resources will be positively associated with perceived support for teamwork and coaching-oriented team leadership. Mallidou et al. (2011) propose the use of staffing ratios as objective measures of slack resources. Similarly, cancer
researchers have measured slack as number of full-time staff per patient in treatment (Fields, Roman, and Blum, 2011). Accordingly, we use staff-to-bed ratio as our primary measure of slack.
When faced with competing demands for time and attention, QI team members may feel that the relative importance of QI is low. A higher staff-to-bed ratio creates time for team members to focus on QI efforts and increases team members' ability to obtain support from others within and outside of the team. As a result, when staff-to-bed ratio is higher, teams should report better access to information and support, more time to focus on QI work, and greater availability of other resources. Thus, we propose hypothesis 1:
Hypothesis 1: Staff-to-bed ratio will be positively associated with the level of perceived support for teamwork reported by the QI team.
QI team leaders also likely have many other obligations, which limits their ability to devote the time necessary to coach and empower team members (Martin, Liao, & Campbell, 2013). When slack is low, QI team leaders may not have the flexibility or time needed to be effective leaders. Thus, we propose hypothesis 2:
Hypothesis 2: Staff-to-bed ratio will be positively associated with the degree of coaching-oriented team leadership reported by the QI team.
Slack as a Multidimensional Construct