Detailed Heap Profiling
Stuart Byma
School of Computer and Communication Sciences EPFL
Switzerland
James R. Larus
School of Computer and Communication Sciences EPFL
Switzerland
Abstract
Modern software systems heavily use the memory heap. As systems grow more complex and compute with increasing amounts of data, it can be difficult for developers to under-stand how their programs actually use the bytes that they allocate on the heap and whether improvements are possible. To answer this question of heap usage efficiency, we have built a new, detailed heap profiler called Memoro. Memoro uses a combination of static instrumentation, subroutine interception, and runtime data collection to build a clear picture of exactly when and where a program performs heap allocation, and cruciallyhowit actually uses that memory. Memoro also introduces a new visualization application that can distill collected data intoscoresand visual cues that allow developers to quickly pinpoint and eliminate inefficient heap usage in their software. Our evaluation and experience with several applications demonstrates that Memoro can reduce heap usage and produce runtime improvements of 10%. CCS Concepts •Human-centered computing→ Visu-alization systems and tools;
Keywords Heap profiling, static instrumentation ACM Reference Format:
Stuart Byma and James R. Larus. 2018. Detailed Heap Profiling. In
Proceedings of 2018 ACM SIGPLAN International Symposium on Mem-ory Management (ISMM’18).ACM, New York, NY, USA,13pages.
https://doi.org/10.1145/3210563.3210564
1
Introduction
With few exceptions, modern software relies on heap mem-ory; even small applications can perform millions of alloca-tions at thousands of different locaalloca-tions. Inefficient use of dynamically allocated memory, however, can increase both peak memory usage and program run time. Understanding and fixing memory allocation problems is not simple because libraries, frameworks, and packages hide internal memory
Permission to make digital or hard copies of part or all of this work for personal or classroom use is granted without fee provided that copies are not made or distributed for profit or commercial advantage and that copies bear this notice and the full citation on the first page. Copyrights for third-party components of this work must be honored. For all other uses, contact the owner/author(s).
ISMM’18, June 18, 2018, Philadelphia, PA, USA
© 2018 Copyright held by the owner/author(s). ACM ISBN 978-1-4503-5801-9/18/06.
https://doi.org/10.1145/3210563.3210564
x[7] = 42;
__memoro_record(x,28); int* x = malloc(32);
Instrumented Binary Visualizer App
Heap Chunk Metadata Runtime Compile + instrument Heap Usage History
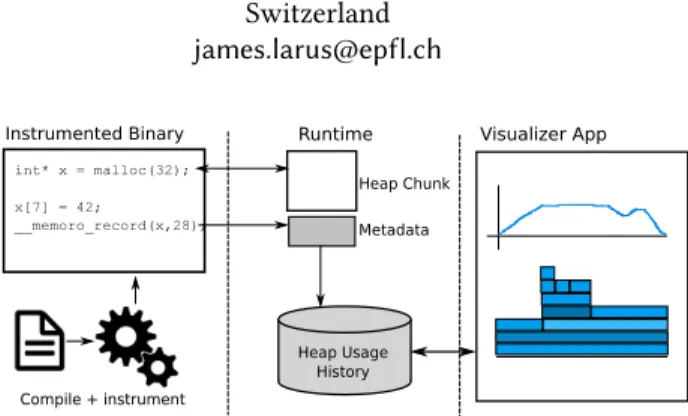
Figure 1.Overview of Memoro operation. The runtime in-tercepts allocation calls and updates metadata at every access to a heap chunk. Accesses are detected by program instru-mentation inserted by the compiler. Data is dumped to disk and visualized.
allocations inside abstraction boundaries, which makes dis-covering and fixing problems challenging, particularly in large complex systems. As a result, it is very easy for inef-ficient heap usage and performance-adverse allocations to go completely unnoticed. These can also be difficult to find even when a developer is actively looking for performance problems. Development tools, however, can help a software developer find and fix these issues. This paper describes a dynamic tool called Memoro that tracks and analyzes mem-ory allocations and usage, and visualizes the resulting data, to aid in identifying and correcting memory allocation, use, and deallocation defects.
Most existing tools provide only a simple, one-dimensional perspective on memory allocation. Typically, they report how many bytes of memory are allocated at each allocation call site and provide a mechanism for aggregating allocations up a dynamic call graph.Tools for managed languages may also report statistics related to the garbage collector. This data, while often quite useful, is lacking richness and the insight necessary to understand memory performance prob-lems. Other methods of data aggregation and presentations offer deeper insights into program behavior. For example, objects of the same type may be allocated at many points in a program; and to understand the performance effects of these objects, it is often helpful to consider all allocations of the same type of object together. In addition, it is valuable to know howefficientlya program actually uses the words of memory that it allocates:
• How much has the program actually written and read the memory (i.e., was this allocation necessary)?
• How much of the allocated memory block was ac-cessed by the program?
• Was the memory block write-only? Read-only?
• What was ratio of reads to writes?
• Was the memory block accessed by multiple threads? Finally, there are dynamic patterns of memory usage that strongly hint at program performance problems. For exam-ple, allocating an insufficiently large region of memory and repeatedly growing it leads to unnecessary data copying. Or, freeing an object long after its final access prolongs its memory block’s lifetime and increases memory usage.
While memory allocation in managed (garbage collected) languages has been heavily studied, fewer tools are available for unmanaged languages, despite the increasing use of im-plicit memory allocation in C++ libraries. This paper focuses on memory performance problems in other languages, such as C and C++, with explicit memory allocation and dealloca-tion. Most recent research on explicit allocation has focused on correctness concerns such as premature deallocation or data races. This paper, by contrast, focus on allocation and deallocation performance problems.
This paper presents a new heap profiler called Memoro that provides a developer with a meaningful, quantitative analysis of a program’s heap usageandindications of how efficiently it uses the heap. Figure1shows an overview of Memoro operation. Memoro uses a combination of func-tion call intercepfunc-tion, static compiler instrumentafunc-tion, and runtime data collection and analysis to capture detailed in-formation about heap allocations and the use of allocated memory. This detailed information is then distilled into a set ofscoresthat measure heap usage efficiency in several cat-egories. A cross-platform Memoro visualizer presents both summary and detailed information in a concise and effective format, allowing developers to quickly pinpoint potential problems. While Memoro collects a large amount of data, careful static instrumentation keeps runtime overheads at an acceptable level, similar to existing, less informative heap profiling solutions. The Memoro implementation is based on the LLVM/Clang AddressSanitizer framework and is thus portable to any system that the sanitizer framework sup-ports. In addition, since the instrumentation and runtime are in the compiler back-end, other language front-ends should be able to leverage Memoro as well.
This paper makes the following contributions:
• A combined interception-instrumentation technique for tracking heap allocations, deallocations, and ac-cesses to heap memory with a reasonable level of pro-gram performance degradation.
• A set of measures or “scores” that quantify how effi-ciently a program uses its heap memory.
• A methodology for aggregating allocations by under-lying data type, which provides greater insight into a program’s allocation behavior.
• A data visualization tool that presents Memoro data and scores in several forms, including aggregation by object data type, enabling developers to quickly diag-nose heap usage issues.
• A case study demonstrating that Memoro identifies performance improvements and that Memoro scores provide meaningful guidance to a software developer. Memoro is open source [8].
The rest of this paper is organized as follows: §2discusses heap profiling and related work. §3describes Memoro data collection methods and implementations. §4shows how Memoro analyzes collected data and the way the visualizer presents it to users. §5presents an evaluation of Memoro and several case studies showing its benefits. §6discusses future directions for this work and §7concludes the paper.
2
Related Work
Memoro extends the functionality of existing profilers, as heap profiling is not a new concept.
One of the best-known systems for profiling program be-havior is Valgrind [21]. Valgrind is a framework for dynamic analysis of binaries. It translates a binary at runtime into an intermediate representation and allows other tools to in-sert instrumentation to analyze and measure the executed instruction stream. Massif [3] is a Valgrind tool for profiling the heap. It tracks how many bytes of memory each line in a program has allocated at specific points in time (snapshots). Third-party tools exist to visualize Massif data, but since it is snapshot-based, high-frequency events can be missed if they happen between snapshots. Memoro on the other hand continuously monitors all heap events without snapshots, retaining maximum data fidelity. Any aggregation or win-dowing of data is done interactively after profiling the pro-gram. Another Valgrind tool called Dynamic Heap Analysis Tool (DHAT) [26] attempts to analyze heap usage efficiency and collects data similar to Memoro. DHAT only produces text output that is often difficult to parse and understand, and does not allow aggregation by data type. In addition, for large programs with many allocations, DHAT provides no mechanism to help programmers identify the most ineffi-cient allocation points. Another drawback of Valgrind-based solutions is their high overhead, which can be up to 50×.
Other heap profilers intercept and redefine allocation rou-tines in a runtime library that can be used with any exe-cutable. Google Perftools [1] uses this approach; as does HeapTrack [2], a Linux heap profiler; and MTuner [25], a Windows heap profiler. These tools have higher resolution than Massif, as they do not snapshot, and lower runtime over-head. Unlike Memoro, they do not collect any information as to how a program actually used its heap memory.
In non-native languages, Shaham et al. profiled Java heap allocations to perform more timely garbage collection and reduce memory consumption [24]. Chis et al. use a Con-tainerOrContainedrelation to detect high-impact patterns within Java heaps [9], some of which are similar to the pat-terns that Memoro detects.Blended Program Analysis[11] also makes use of static analysis in conjunction with a dy-namic representation of program call structure to better un-derstand Java application performance.
There are several tools that use static instrumentation to analyze programs to find memory access bugs like overflows and out-of-bounds. Of particular note here is the Address-Sanitizer framework [23], which we have used to build the Memoro static instrumentation and runtime system. Ad-dressSanitizer uses static instrumentation and a specialized allocator to detect memory errors such as out-of-bounds accesses and use-after-free. Other tools built on AddressSan-itizer include a leak detector and a race condition detector.
DINAMITE [20] is a system that also uses compile time instrumentation to trace memory accesses, allocations and function calls, with the general goal of analyzing memory performance bottlenecks. It does not focus particularly on heap memory, and suffers from high overhead as well (36×
to 537×, depending on the level of analysis).
GCSpy [22] is tool that also attempts to provide visualiza-tions of the heap, focusing on garbage collected languages. A server API implementation is required for other languages, and it does not appear to analyze how efficiently a program uses its heap objects.
Overall, Memoro goes beyond existing solutions by pro-viding detailed profilingandheap usage efficiency analysis in a low-overhead package. Most heap profilers for native languages use allocation routine interception to build a time-based log of heap allocations and deallocations. While this approach can track heap usage through time, it is typically the only data collected and displayed to a developer. She thus lacks insight into how her program actually uses the bytes that it allocated. Gleaning this information from source code, by trying to guess what objects were accessed where and when, can be time consuming and error-prone, and it is often impractical on large projects in which developers may be unfamiliar with a majority of the code.
In addition to all of these concerns, existing profilers lack a means of mapping heap allocations to object types. Since objects of the same type can be allocated at different places in a program, without this information, there is no easy way to view their heap usage holistically.
Finally, there are few if any heap profilers (or associated data visualization tools) that are truly cross-platform.
3
Memoro Profiler
We built the Memoro system to provide developers with data, analyses, and visualizations that allow quick identification
and diagnosis of inefficient heap usage and poor allocation strategies.
Inefficient heap usage can occur in many ways. For ex-ample, a program may allocate memory that it never writes or reads; it may be possible to eliminate these allocations completely.1Similarly, a program may allocate memory that
it only writes and never reads. A program may allocate a chunk of memory but only use a small fraction of it, effec-tively wasting the rest. Objects may also live on the heap long after their last reference, taking up space that could have been reused. Alternatively, objects may be allocated long before their first usage, wasting memory in another manner.
Poor allocation strategies include repeatedly allocating and deallocating an object and successively growing a buffer to larger sizes. All of these dysfunctional allocation strategies can have an impact on performance, both directly because of the time spent in allocation routines and indirectly by fragmenting the heap and making subsequent allocations more expensive.
Memoro enables detailed heap profiling by recording heap allocations, deallocations, as well ashowa program uses its allocations. In this section we will describe the large amount data that is captured by Memoro and how it is collected. Analysis and visualization of the data is described in §4. We provide the following terminology and definitions to avoid confusion:
• Allocation Point: a location in a program that ex-plicitly allocates memory (e.g.malloc, new), fully identified by its dynamic call stack trace. The stack trace disambiguates different call sequences leading to an allocation point [5] and provides the basis for aggre-gating chunks with the same call context. It is unique up to intra-procedural control flow and loop iteration counts. We did not find path-sensitive information to be necessary.
• Chunk: A region of heap memory returned at an al-location point. An alal-location point produces multiple chunks in subsequent calls.
• (Chunk) Metadata: The data pertaining to a specific chunk.
3.1 Data Collection
Similar to some other profilers, Memoro builds a time-indexed log of all heap allocations and deallocations in a program. This is done by intercepting calls on the standard allocation routines (new, malloc, etc). For each allocation, the stack 1The program transformations described in this paper are correct only if
they do not change program behavior on all possible execution paths. Since dynamic analysis tools capture program behavior only along a subset of these paths, we assume that the developer will examine the program and find a transformation that is correct. It may be possible to build a tool to analyze and implement these restructurings, but that is beyond the scope of this paper.
trace is logged [5] along with the allocation size and the time since the start of program execution. Time is measured in CPU clock cycles2Each unique allocation point is associated
with all chunks that it allocated over the execution of the program, including the chunks that were freed.
To discover inefficient heap usage and multi-thread ac-cesses, additional information is required about how and when a program accesses heap chunks. To acquire this in-formation, Memoro notes each reference to every chunk allocated in the heap. Beyond the allocation point that pro-duced the chunk and the chunk size, Memoro records the following chunk metadata:
• The time of the first memory access to the chunk.
• The time of the last memory access to the chunk (be-fore deallocation or program termination).
• Theaccess interval, defined as the address range of bytes within the chunk that were accessed by a pro-gram.
• The number of reads and number of writes to the chunk. The maximum of this value is configurable, but larger maximums can increase the metadata size over-head as more bits are required to store larger numbers.
• Whether the chunk was accessed by multiple threads. 3.2 Static Instrumentation
To collect this information, memory accesses in a program are instrumented. We use static instrumentation in the com-piler because it is a low-overhead method to collect a large amount of data about low-level program activity. Binary instrumentation is possible as well. Dynamic instrumenta-tion (like Valgrind) is more costly, but it has the advantage that program source is not necessary and it need not be recompiled.
In effect, every memory access is transformed from: *address = ...; // or: ... = *address;
to:
if (IsHeapChunk(address)) {
MemoroRecord(address, kAccessSize, kIsWrite); }
*address = ...; // or: ... = *address;
The compiler inserts a runtime function call before a mem-ory accessing instruction. First, a predicate provided by the runtime system determines if an address points into heap memory. This is possible because the runtime system imple-ments the memory allocator and is aware of all of the heap address spaces. If the predicate evaluates true, the runtime 2In recent multicore architectures, the timestamp counter (accessed via rdtscon Intel processors) is synchronized across cores, making this ap-proach time-distortion free. Although the execution of the timestamp in-struction can be reordered by an out-of-order processor [10], introducing uncertainty, the events that we log are relatively infrequent and unlikely to be affected by this.
records the access to a chunk in the chunk’s metadata. The memory access then executes as normal in either case.
In the compiler, the instrumentation pass runs after the op-timization passes, to avoid instrumenting memory accesses that are optimized away. This approach to instrumentation is similar to other tools in the sanitizer framework [23].
Because we are only interested in heap memory accesses, notallmemory accesses need be instrumented. There are several regions of memory in a program: global, stack and heap. Ideally we would only instrument the heap accesses.3 However, in the LLVM IR, global, stack and heap memory are all accessed via the same instructions (loads and stores), so it is necessary to examine the pointer operand to determine which type of memory is being accessed. In many cases, it is easy to deduce that a reference points to a local stack object produced byalloca; in this case we omit instrumentation because the memory is not in the heap. In the future, it might be valuable to analyze references to stack-allocated memory, but since its behavior is quite different from heap-allocated memory, Memoro does not currently track it.
Other cases are more complex. For example, an object may be allocated on the stack, and a pointer to the object passed to another function. It is difficult to tell at compile time what type of memory a pointer points to without interprocedual analysis similar to escape analysis [7]. Without this analysis, an access must be instrumented conservatively and a pointer checked at runtime, or we risk missing a potential heap access.
Our instrumentation follows a single link in the static single assignment (SSA) of the LLVM IR to determine if an access is to stack allocated memory. By examining whether the pointer operand came directly from a stack allocation (alloca) instruction, we are able to identify references to stack allocated variables and avoid instrumenting a large number of loads and stores, reducing the instrumentation overhead. More complex computations that produce pointers to the stack are currently not fully analyzed and their mem-ory access is instrumented. In the future, a more thorough propagation analysis might eliminate more unnecessary in-strumentation.
3.2.1 Type Extraction
We have found that it is useful to know the data type of a chunk when visualizing and analyzing collected data. For example, objects of a class such as a tree node may be allo-cated at several different points in a program, and it is often convenient to aggregate these allocations and treat them as if they occurred at one call site. To this end, we have modi-fied the instrumentation pass in the compiler associate type information with allocation points.
3This is not to say that stack objects are not interesting, but they are beyond
the scope of this paper. Future work could integrate stack memory analysis into Memoro.
Many allocations correspond semantically to allocating typed objects or arrays of typed objects, even though the allocate routines returnvoid*(newormalloc). In the LLVM IR, an allocation function call isusuallyfollowed by a cast instruction. The type for a particular allocation point can be inferred from this cast. In the absence of a cast, a byte type (e.g.,char*) is assumed. In the rare case of multiple cast instructions, the first type that is not a byte type is preferred. The compiler pass writes (code location, type) pairs to a file, which the visualizer uses in displaying the other data. Oc-casionally, in templated code or at allocation code in header files, we see multiple different types mapped to one alloca-tion point. This occurs because the compiler scope is limited to a single compilation unit (i.e.,a source file), and an alloca-tion point in a header can therefore appear in multiple places. Rather than make complex modifications to the compiler, the instrumentation pass emits all types encountered for an allocation point. The visualizer, having access to full stack traces from the runtime system, will display the first type that is compatible with the stack trace. Although this tech-nique is a heuristic, we find it is correct in the vast majority of cases.
3.3 Runtime System
The runtime system for Memoro provides two types of func-tionality: 1) a memory allocator to keep track of which ad-dress ranges are heap allocated, and 2) mechanisms to log and store metadata corresponding to individual heap chunks. Metadata for a chunk includes the chunk size, where it was allocated (stacktrace), timestamps recording the times of the first and last reads/writes to the chunk, the byte access inter-val, the number of reads and writes, and whether the chunk was accessed by multiple threads (§3.1). This data must be updated every time a chunk is accessed.
As described above in §3.2, memory references in the program are conservatively instrumented, and not all instru-mented references will be to heap memory. The runtime must first determine whether the pointer in question is actu-ally pointing to memory owned by the heap, andthenupdate the associated chunk metadata. To keep runtime overhead low, both the pointer ownership check and metadata lookup and update must be donequickly, as memory accesses occur frequently in programs.
The amount of metadata per allocated heap chunk, cur-rently 60 bytes, is large because timestamps need to be 64 bits. 64 bits are required since time is measured in CPU cycles; even unsigned 32 bit counters would overflow before most programs finish executing. Chunk metadata can be stored in memory, which is fast, but sometimes the region for the stored metadata of freed chunks needs to be expanded, which involves copying and is expensive. We believe a better idea would be to log data to disk at this point, but care must be taken to ensure the runtime does not block.
Our runtime system borrows from the AddressSanitizer framework, whose runtime implements both the allocator and the allocation routine interception. The allocator consists of two components: a thread-localprimaryallocator, and a sharedsecondaryallocator. The primary can allocate chunks efficientlywithoutlocking, but is limited in the alignments/-sizes of chunks it can allocate. The secondary is a fallback that can allocate any size/alignment, but must be locked to ensure safety when accessing shared data structures used to allocate/deallocate chunks, and when determining pointer ownership.
The primary allocator maps up-front a large portion of address space from the OS viammap. Regions, divided into freelists of chunks of varying size, utilize this space. Meta-data for each chunk resides at the upper end of the address space of a region. The metadata for a chunk is thus accessed at a fixed offset, which is fast and does not require condi-tional branches. Because the primary allocator is aware of its address space, pointer ownership can be determined in constant time by a simple boundary comparison.
The secondary allocator is meant to service large and rare allocations, and willmmapchunks and metadata directly, with the metadata being placed in extra space at a page boundary. This requires locking for thread safety. The chunk metadata, however, can still be accessed in constant time because it is at a known offset. However, because the set of chunks is now disjoint, the secondary allocator must traverse the array of chunks when determining whether it owns a pointer. In addi-tion, the allocator must be locked to do so safely. Therefore, programs that allocate large chunks accessed by multiple threads will experience higher than average overhead4due
to linear traversal, and lock contention in the secondary allocator.
To reduce this overhead, Memoro provides the option to use a modified allocator that avoids locking while determin-ing pointer ownership or lookdetermin-ing up metadata. This relies on the assumption that the user has correctly synchronized accesses to shared memory, and will not deallocate shared chunks while another thread is accessing them. The trade-off however, is that if unrelated chunks are allocated/deallocated (modifying the array of chunks that the allocator manages), the array traversal during a pointer ownership testmight miss an owned pointer, resulting in a false negative and a missed access to a heap chunk. Program semantics and safety are preserved, provided the user’s program has no race con-ditions as described above. We examine and quantify the overhead and benefit of the allocator modifications in more detail in §5.
While active chunk metadata is stored and managed by the allocator, freed chunk metadata is copied and stored in a separate memory-mapped array associated with the 4This is simply an artifact of the current implementation; in §6we discuss
corresponding allocation point. At program exit, a routine compresses and records the chunk metadata array of each allocation point in a compact binary file. The metadata itself, as well as the runtime storage of active and freed chunk metadata, will lead to slightly higher memory use compared to uninstrumented programs.
The runtime system also intercepts a variety of standard library calls that access memory (e.g.,memset, memcpy), as opposed to providing an instrumented standard library. Many of these interceptions aggregate multiple accesses (individual loads and stores) into one large access, which helps reduce overhead.
The compiler modification source and binaries are avail-able [8].
4
Memoro Visualizer
While the instrumentation and runtime system collect a large amount of raw data, the Memoro visualizer provides insight into program behavior using that data. As the name suggests, the visualizer makes heavy use of visual cues, produced by aggregating and analyzing data, to direct a developer to areas of a program that display inefficient usage or performance-detrimental allocation patterns. As there are many inefficient usage and allocation patterns that can be difficult to see in raw data, Memoro employs a new technique to distill and quantify these patterns intoscores. Scores form the primary analysis that helps prioritize the visual cues used in the visu-alizer. These scores run on a scale between 0 and 1, where 0 is undesirable or inefficient behavior and 1 is the most desirable, efficient behavior. Alongside data visuals, scores provide a developer with a specific indication of the problem with heap usage and the ability to quickly pinpoint the locations that are most likely responsible for poor behavior/performance. The following subsections describe the scoring algorithms, the visual displays that use the scores, and how they inform a developer.
4.1 Data Analysis and Scoring Algorithm
Memoro takes into account several aspects of heap usage when measuring how efficiently a program has used the heap, generating scores quantifyinglifetime, usageanduseful lifetime.
4.1.1 Lifetime
Lifetimerefers to how long heap chunks are active before be-ing freed. Memoro pays particular attention to short lifetime chunks, especially those that are grouped tightly in time. These patterns indicate regions of code in which chunks are constantly being allocated and deallocated, typically with very few reads and writes to the chunks. An example is when a developer (perhaps mistakenly) explicitly creates an object inside an inner loop. Often, these objects are not explicitly malloced, but rather are a stack-allocated container object
whose constructor allocates heap memory. In a tight loop, re-peatedly allocating memory, particularly if not heavily used, can have significant performance impacts.
Memoro builds alifetime scoreby looking for short lifetime chunks from the same allocation point that were allocated close together in time, where “short” is a modifiable parame-ter. To build thesegroupsof short lifetime chunks, the array of all chunks for an allocation point is sorted by time and traversed. Any chunks allocated within some threshold time of each other are added to the same group. The threshold interval is a parameter, with a default of 0.1% of total run time. Then, a scoreSдfor each groupGin allocation point Ais computed as follows: Sд= P C∈GCl |Cд| Gl
whereCl is lifetime of chunkl,|Cд|is the number of chunks
in groupд, andGl is the group lifetime. The group lifetime is
defined as the time difference between the earliest allocation and the latest deallocation.
The lifetime scoreSl for allocation pointAis then
com-puted as:
Sl = P
G∈ASд
|G|
where|G|is the total number of groups.
In essence, the average chunk lifetime of each group is normalized by the group lifetimeGl and the allocation point
lifetime scoreSl is the average of all the group scores,
re-sulting in a normalized value between 0 and 1, where 1 is best and 0 is worst. The group normalization avoids the situ-ation in which a few abnormal short-lived allocsitu-ations exert a strong influence on the final score.
4.1.2 Usage
Theusage scorefor an allocation point provides a measure of how well a program makes use of the bytes of memory that it allocates. In an ideal situation, every allocated chunk will be fully written and read by a program, preferably many times (good reuse). A poor usage score can indicate that areas in a heap chunk are unused or write-only, or that only a fraction of the bytes of a heap chunk are read or written. For example, a larger than necessary buffer may contain a number of unused elements. Eliminating these can reduce the total heap usage and improve allocator behavior.
The usage scoreSu is computed for an allocation pointA
as follows: Su = P C∈AUc·CByt esAccessed P C∈ACT ot al Byt es Uc = ( 0 Cr d =0||Cwr =0 1 otherwise
Ucis theUselessfunction, which returns 0 if a chunk has no
reads or no writes. The usage score is thus a normalized av-erage of the number of bytes actually accessed by a program relative to the total bytes allocated. To keep overheads rea-sonable, the profiler does not collect the full byte-level access statistics, but rather anaccess interval(lowest and highest accessed location), which is updated whenever a chunk is accessed.
4.1.3 Useful Lifetime
Even when chunks on the heap live for a long period of time, a program may not make good use of them during their entire life. Chunks may be allocated and not written or read for a long period, or vice-versa, chunks may be allocated and used but then sit idle for a long time. Heap usage over time could be reduced by allocating these chunks when they are needed and freeing them when they are no longer needed. Theuseful lifetimescore quantifies this concept for an allocation point:
Sul =
P
C∈ACact ivel if e
Cl
|C|
whereactive lifeis the time difference between the first and last accesses to the chunk (recorded via instrumentation) and
Cl is the total chunk lifetime. The sum is then normalized
by the number of chunks to produce another score between 0 and 1.
Finally, global scores are calculated by determining the geometric mean of each score across all allocation points. Variances of global scores are also calculated to give the programmer an estimate of the score distribution across the program.
4.1.4 Discussion
These scores are intended to provide developers with clear, digestible measures of how efficiently their program uses the heap. They do not always convey an unequivocal truth and can be context dependent, occasionally requiring a manual examination of a program. For example, different inputs or workloads for a given program may affect which bytes are accessed in a chunk or how long a chunks lives. In general, it is not possible to modify a program to achieve a score of 1.0. However, we have found in practice that the scores provide very helpful information to pinpoint heap usage issues. The case study in §5.2provides some examples.
4.1.5 Other Inferences
Memoro will make several other metrics based on the col-lected data and display them for each allocation point, to help a developer prioritize issues. These include:
• Top percentile of bytes allocated: Memoro marks an allocation point if it is in the top 90th percentile of maximum heap usage.
• Top percentile of chunks allocated: Memoro marks an allocation point if it is in the top 90th percentile of total chunks allocated.
• Read- or write-only chunks (i.e.,useless chunks).
• Runs of monotonically increasing allocation sizes, in-dicative that early allocations were too small. 4.2 Visualizer Application
Modern applications, even small ones, can perform millions of allocations at thousands of different locations. Presen-tation and meaningful analysis of this mountain of data is crucial to properly interpreting and quickly diagnosing prob-lems. The visualizer application of Memoro is a separate tool that provides a visualization of the data that the instrumen-tation and runtime system collects. Aglobal view gives a developer a bird’s eye view of the entire dataset, with the option to “zoom in” to specific data points in thedetailed view. In both views, the user can filter and aggregate by stack trace function name, time interval, or object type. Memoro scores are used throughout to give intuitive visual cues to the user, in order to guide them to areas of interest. 4.2.1 Global View
The global view aims to provide a developer with an overview and summary of a program’s behavior as a whole. This is achieved via two visuals, a flame graph [13] (Figure2) and a line graph showing the total (aggregate) heap usage across the program lifetime (Figure3e). A flame graph is a visualiza-tion that shows stack depth in theyaxis, and stack frames in thexaxis, sized proportionally according to some value, typically the number of samples in a CPU profile. The pro-portional size of a frame is equal to the aggregate size of all of its children plus the frame’s own value. For example, Figure2shows a flame graph in which the frame sizes are proportional to the number of allocations over the program lifetime. Functionmainincontrived.cppcontains three allocation points, one of which is contained deeper inside a std::vector::push_back()call. Flame graphs are useful because they give an overall summary of how the memory usage occurs at different points in a program, over its entire execution.
The Memoro flame graph can display several categories of data values, including total number of allocations per alloca-tion point (as seen in Figure2), and total bytes per allocation point at a given point in time (selectable by the user). This is similar to memory flame graphs described in [14]. The flame graph “tips” correspond to unique allocation points, and are colored with aseverity indicator, a visual cue that maps Mem-oro scores for that allocation point to a set of colors. The mapping is from the geometric average of all scores to a set of 12 colors, roughly, from blue to green to yellow to red. In addition, global scores for lifetime, usage, and useful lifetime are displayed along with total allocations, maximum heap
usage, total allocation points, and the approximate time the program spent in allocation routines.
Figure 2.Visualizer flamegraph representation, showing a global view of all allocation points in the program. It can be organized by number of allocations (shown here), or by byte usage at any point in time. The severity indicator that color codes an allocation point score is mapped to the flamegraph allocation points. Long stack traces can be viewed fully in the bottom left, or via the tooltip.
4.3 Detailed View
While the global view can identify problematic allocation points, a developer may need to examine these points in more detail. The detailed view allows a developer to drill down and examine individual allocation points, view their allocation patterns over time, and easily identify the cause of low scores. Figure3ashows how individual allocation points are displayed, along with their aggregate heap usage – the line graph overlaid on the global aggregate graph. This makes it easy to see how individual points contribute to the total heap usage. The severity indicator in the top right corner of each allocation point again provides a visual cue flagging points with poor overall scores. Full stack traces are also displayed, with the ability to open source files and jump to the corresponding line of code. Statistics and inferences for an allocation point are displayed separately, including their individual scores. Allocation points can be sorted by heap usage, average score, individual score values, and number of allocations.
Allocation patterns over time can also provide a visual indication of poor allocation strategies or inefficient usage that are not always obvious in an aggregated line graph or simple statistics like the number of chunks allocated. Be-cause programs can make many allocations, fidelity can be lost when aggregating data. To this end, the visualizer also displays individual chunks of an allocation point as blocks, whose length corresponds to lifetime and whose color shade corresponds to their size. Black vertical lines indicate the access interval as recorded by the runtime system. Figure3
shows some examples of this display, including common inefficient patterns in an actual program, all of which are screenshots from Memoro.
In Figure3b, chunks are allocated inside a loop, where they are written, read, and then freed – and then allocated again in the next iteration. Figure3cshows the reallocation pattern
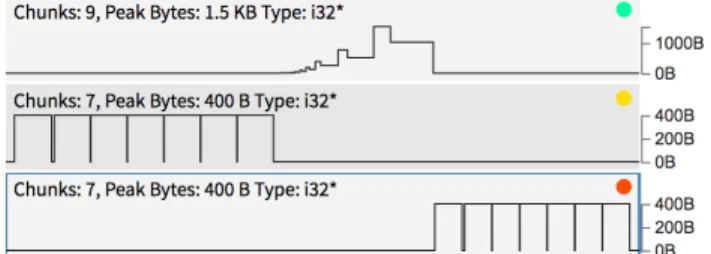
(a)Visualizer allocation point representation, showing number of chunks allocated, peak heap usage, object type, severity indicator, and aggregate line graph.
(b)Heap chunk allocated inside a loop, written/read, and freed.
(c)std::vectorreallocation pattern, with darker chunks indicate larger byte sizes, and the chunk tooltip.
(d)Low useful life chunks, as indicated by extremely short access interval.
(e)The aggregate total heap usage graph. A cursor shows the exact cycle time and total heap usage at that time.
Figure 3.The detailed data presentation of Memoro. Time increases from left to right and is measured in cycles. In Figures b, c, and d, a rectangle represents an individual heap chunk. The tool will draw short lifetime chunks with a mini-mum size for legibility. Vertical lines indicate the time range within which the program read or wrote the chunk (the ac-cess interval). Note that Figures a through e are all on the same time scale shown in Figure e.
for astd::vector. As integers are pushed into the vector, it allocates a larger array, copies existing data, and frees the old, smaller array. This happens several times as the vector
grows exponentially. The visualizer marks larger byte size chunks with darker colors. In addition, the visualizer tooltip shows a developer additional detailed information about individual chunks, including the number of reads, writes, size, access interval, and whether or not the chunk was accessed by multiple threads. Figure3dshows chunks allocated and freed in a loop with very short access intervals, indicating low useful lifetimes. Finally, Figure3eshows the combined aggregate heap usage across time.
As can be seen in Figure3a, the scores for each allocation point are again translated to a clear visual cue for the user — the color-coded severity indicator in the upper right cor-ner of each allocation point displayed. We can see that the third has the lowest score, because it allocates short lifetime chunks that also have a short useful life, while accessing only four bytes out of 400, giving a low usage score as well. In contrast, the first point is much better, allocating longer lived chunks that have a long useful life and in which every byte is accessed. Note that this point could be reduced to a single allocation had we calledvector::reserve()before pushing values.
The visualizer also contains a comprehensive filtering sys-tem that allows a user to filter data by function name in stack traces, by data type, or by time intervals. Aggregates, graphs and visuals are updated according to the filters applied.
The visualizer application is available [8].
5
Evaluation and Case Study
5.1 Instrumentation and Runtime Overhead
We first evaluate the effectiveness of static analysis at reduc-ing the number of memory references that must be instru-mented (§3.2). Recall that our approach follows a single link in the LLVM SSA graph to see if a load or store is accessing a stack-allocated value. If this is the case, the instructions can safely be left uninstrumented. On average, in all programs in our study, we found that∼66% of memory access passed to the runtime were heap accesses. This means that∼34% of accessescould have been left uninstrumented, thereby reducing overhead. However, as discussed in §3.2, this im-provement requires more advanced program analysis.
Runtime system overhead is heavily dependent on how a program uses its heap. To break down this overhead and un-derstand which factors influence it, we use Memoro to profile two large, popular open-source programs — LevelDB [12] and Memcached [4]. LevelDB is exercised using its internal benchmark utility (db_bench) running thefillseqbenchmark, which sequentially writes a series of values to the database. Mutilate [17], a Memcached load generator and measure-ment tool, is used to generate Memcachedgetrequests over 5 seconds, while Memcached itself is run with a single thread. Mutilate is run with default values. LevelDB performance is measured in MB/s while Memcached throughput is mea-sured in Queries per Second. Experiments are run locally on
Table 1.Throughput and slowdown of Memcached and Lev-elDB when unmodified, with no-op compiler instrumenta-tion only, with full runtime data collecinstrumenta-tion, and with the modified non-locking secondary allocator to reduce over-head. Memcached (Q/s) LevelDB (MB/s) Unmodified 52184.4 55.5 No-op Inst. 47668.3 (1.1×) 26.8 (2.1×) Full Collection 18051.4 (2.89×) 1.8 (30.8×) No-lock Sec. 22521.8 (2.32×) 4.1 (13.5×)
a server with two Xeon E5–2680v3 CPUs at 2.5 GHz with 256GB of RAM running Ubuntu 16.04. Results are show in Table1.
First, we examine the effect of the aggregate static instru-mentation on performance, by replacing runtime instrumen-tation library with empty functions, and hence recording no data. Memcached has 1.1×lower throughput, while LevelDB has 2.1×lower throughput. We find that this is primarily a function of the number of instrumentation points — LevelDB has significantly more loads and stores to be instrumented; at the LLVM IR level, LevelDB contains 39% loads and stores as opposed to Memcached’s 19% loads and stores.
Second, we fully enable Memoro instrumentation and data collection. There is a large difference in overhead cost be-tween the two programs, ranging from 2.89×for Memcached to 30.8×for LevelDB. To understand why, we use a stan-dard CPU profiler (Intel VTune 2017) to see where time is spent. Profiling indicates nearly half of the time in LevelDB is spent in the secondary allocator acquiring locks5to safely record Memoro metadata. As it turns out, LevelDB uses an arena allocator that obtains large memory blocks viamalloc. These allocations are served by the secondary allocator in the Memoro runtime, as the primary thread-caching alloca-tor is unable to handle such large allocations. The remainder of the overhead (and the majority of overhead in the Mem-cached experiment) comes from looking up the metadata for a chunk and updating statistic counters.
This result prompted us to modify the secondary allocator to eliminate locking when determining pointer ownership, as discussed in §3.3. The final row of Table1shows that with the modified secondary allocator with lock-free owner-ship checking, overhead for Memcached is slightly reduced, while overhead for LevelDB is reduced by over 50% to 13.5×. Overhead for LevelDB is still higher primarily because the ownership check in the secondary allocator is linear in com-plexity, exacerbated by the fact that LevelDB had a high number of instrumentation points. Furthermore, of all our tests, LevelDB had the lowest proportion of heap accesses rel-ative to all memory accesses, resulting in many full traversals of the secondary allocator chunk list.
In terms of memory use overhead, the more allocations that a program makes, the higher the overhead cost, because Memoro records metadata for every allocated heap chunk. Metadata is also the same size for all chunks, meaning that small allocated chunks will have higher memory use over-head relative to large chunks. In longer running profiles, memory overhead may start to impact performance, how-ever we have not experienced this in any program we have profiled so far. Regardless, we are investigating static buffer-ing techniques to eliminate this, also discussed in §6. 5.2 Case Study
In this section we illustrate a use of Memoro that leads to improvements in heap efficiency and program runtime, as well as examples that demonstrate the utility of the data analysis that Memoro performs. All tests were performed on a 2.5GHz Intel Core i7 processor with 16GB of RAM running MacOS v10.12.16 (Sierra). The Memoro instrumentation used was built into LLVM/Clang [16,19] release version 4.0. 5.2.1 Protocol Buffers
Protocol buffers (protobuf) [15] is a popular framework from Google for data serialization. In protobuf,messagesare de-fined using a declarative language, which the protobuf com-piler compiles to classes in various languages that can serial-ize themselves. The protocol buffer implementations makes heavy use of the heap, especially when messages contain repeatedfields, or arrays of data. These can be arrays of ba-sic supported data types or arrays of sub-messages. In either case, deserializing or constructing protocol buffer messages may perform many allocations, which can incur significant performance overhead, especially in latency-sensitive sys-tems that must process many messages per second.
Recently, the protocol buffer implementation addedarena allocationto alleviate this issue. An arena pre-allocates a large block of memory and uses it for internal message data, so as to avoid repetitive OS heap allocations when construct-ing or deserializconstruct-ing messages. The point of our study is to show that Memoro will correctly identify the problem allo-cations that prompted this change, and present correct and meaningful analyzed data.
We construct a benchmark using the following protobuf message, which consists of a string field, a repeated field of integers (an array), and a repeated field of a sub-message that itself contains a repeated field of integers.
The benchmark serializes an instance of aRecordwith 1000 integers, and five sub-messages each with 1000 integers. Then, the message is deserialized 1000 times in a loop, cre-ating a new instance each time, and then destroying it. We run the benchmark with and without the arena allocation, after having compiled it with the Memoro instrumentation and runtime system. The total number of allocations and global scores generated by Memoro for each are summarized in Table2.
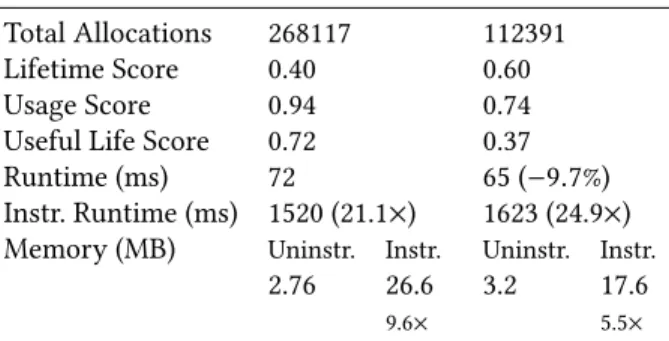
Table 2.Protobuf benchmark with and without arena allo-cation. Note that the overheads are abnormally high because the benchmark does very little work relative to the number of allocations it makes.
Without Arena With Arena Total Allocations 268117 112391
Lifetime Score 0.40 0.60
Usage Score 0.94 0.74
Useful Life Score 0.72 0.37
Runtime (ms) 72 65 (−9.7%)
Instr. Runtime (ms) 1520 (21.1×) 1623 (24.9×) Memory (MB) Uninstr. Instr. Uninstr. Instr.
2.76 26.6 3.2 17.6
9.6× 5.5×
Without arena allocation, Memoro reports a global aver-age lifetime score of only 0.40, indicating that many allo-cation points in the program produce chunks that do not live long and that we may have allocations in a tight loop, as expected. Average usage is high however, since every chunk allocated has been almost fully read and written by the program. The useful life score is also relatively high at 0.72, since chunks are read and written during most of their lifetime.
With arena allocation, however, we see a near reversal of values. The lifetime score has increased to 0.60, showing that the new allocation scheme has reduced the number of short lifetime allocations. While we might expect a higher value, the current implementation does not allocate strings in the arena, and the arena itself allocates several short-lived items. In addition, the loop is simply deserializing and not doing any real work. The total number of allocations has been cut nearly in half. The usage score has decreased, which may seem counter-intuitive, but it is what we expect — because the arena allocates large blocks up front, some parts of them inevitably go unused. Likewise the useful lifetime score has decreased to 0.37, because the arena blocks live for longer than the period during which they are read and written by the program.
In effect, Memoro shows clearly the trade-off that pro-tobuf arena allocation makes: slightly less efficient use of heap chunks in return for fewer, higher lifetime allocations, ultimately resulting in lower runtimes. In the case of this benchmark, a 9.7% improvement in execution time. 5.2.2 Bioinformatics
Our second case study takes us to the bioinformatics field, whose workloads are an interesting combination of big data and computation. The particular toolset we analyze is the bamtools API [6], a library and associated toolkit written in
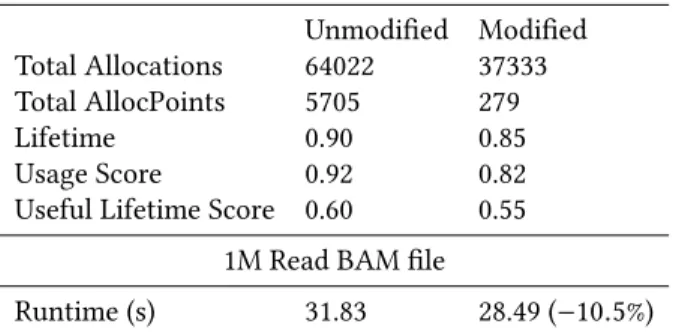
Table 3.Memoro profiling results when sorting a 4000 read BAM file. Note how the large number of allocation points with few allocations has skewed scores of the unmodified version.
4K Read BAM file
Unmodified Modified Total Allocations 64022 37333 Total AllocPoints 5705 279
Lifetime 0.90 0.85
Usage Score 0.92 0.82
Useful Lifetime Score 0.60 0.55 1M Read BAM file
Runtime (s) 31.83 28.49 (−10.5%) C++ for manipulating BAM files [18], one of the most com-mon file formats in bioinformatics. BAM is the binary coun-terpart of SAM (Sequence Alignment Map), a format used to store alignments of sequenced genomic data. Common operations include data conversion, sorting, and filtering. In this case study, we analyze two tools that use the bamtools API: sorting and filtering.
We first compile the bamtools source code using Memoro instrumentation, and run the sort tool using a BAM file containing approximately 4000 aligned reads (snippets of genomic data aligned to a reference genome). Each read is 101 bases long, where a base is a genetic alphabet letter — A, T, C, G, or N (an ambiguous base). After visualizing the results using the Memoro visualizer, we make several observations:
• The number of allocation points is very high — there are over 5000 unique points in the code that allocate memory in the heap.
• The total number of allocations is very high — over 64000 heap allocations over the program lifetime.
• The majority of points with many allocations have extremely low lifetime scores, zero or close to zero. A glance at the flamegraph shows that the vast majority of these allocations are within thestd::sortroutine used for sorting sub arrays of reads before merging them. Com-paring the stacktraces of the high-allocation points, we see that many of them involve either creating alignment data structures, or copying the alignment data structures. When we filter the data based on the primary alignment data struc-ture copy constructor, we find that it is called in over half of all allocation contexts. A quick look at the data structure re-veals the issue: copying the structure is expensive, because it contains severalstd::stringandstd::vectorfields that also allocate memory and copy data. Because this structure is used as the template value for the sort, a great number of allocations and copies are generated as the algorithm swaps values.
Table 4.Instrumentation and runtime overhead sorting a 4000 read BAM file.
Uninstrumented Instrumented Runtime (ms) 134 404 (3.01×) Memory (KB) 7888.9 45674.5 (5.78×)
To reduce these costs, we identify the fields in the align-ment structure that are read-only, and wrap them in shared pointers. This way, the cost of copies is much reduced as only a shared reference count is incremented. The result is that the total number of allocations is reduced to∼37000, and the number of unique allocation points reduced dra-matically to 279. All results of the sort analysis are display in Tables3through4. While the number of allocations is still high, they have been removed from the computationally intense portion of the program (along with associated copy-ing), resulting in a execution time improvement of 10.5% when tested with a BAM file containing one million reads. A more extensive redesign of the data structure to avoid usingstringaltogether could produce further allocation reductions, but would require pervasive changes to the code base. The runtime overhead imposed by the instrumentation was relatively low, approximately 3.0×.
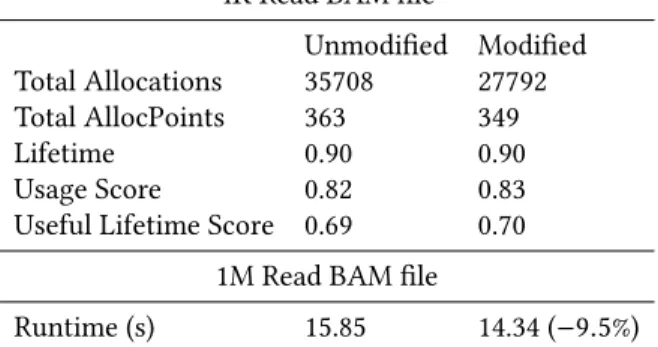
We also analyze the filtering tool included with the bam-tools API, profiling with the 4000 read BAM file and single filter predicate that removes any read with a mapping qual-ity below a value of 50. The visualizer quickly gives us a rundown of potential problems. There are again a large num-ber of allocations, primarily from constructing all of the string data that comprises the alignment structure. The visu-alizer also flags two allocation points in particular with very low scores (and red indicators) — particularly low lifetimes and low usage, and allocations proportional to input size. The stack traces show these are caused by two data struc-tures:std::queueandstd::stack. The queue allocations are caused by copying another queue, simply to iterate over it without destroying the original since the queue interface provides no iterators. The stack is used to parse and evaluate boolean filter expressions, but since it is allocated on the program stack, it is constantly created and destroyed (thus allocating and freeing internal memory). In addition, the underlyingstd::dequecontainer allocates blocks of 4KB, only a few bytes of which are actually used, causing the low usage score.
We make two minor fixes to reduce the number of alloca-tions and increase overall scores. First, we make the stack object static in its function (safe since the program is not multithreaded), which preserves its memory across invoca-tions. Second, we change the queue object to a double-ended queue (deque) to gain iterators and avoid copying. The net result is that total allocations are reduced to∼38000 and the global average usage and useful life scores increase by
Table 5.Memoro profiling results when filtering a 4000 read BAM file, pre and post modification.
4K Read BAM file
Unmodified Modified Total Allocations 35708 27792
Total AllocPoints 363 349
Lifetime 0.90 0.90
Usage Score 0.82 0.83
Useful Lifetime Score 0.69 0.70 1M Read BAM file
Runtime (s) 15.85 14.34 (−9.5%) Table 6.Instrumentation and runtime overhead filtering a 4000 read BAM file.
Uninstrumented Instrumented Runtime (ms) 71 388 (5.46×) Memory (KB) 3739.6 16297.9 (4.36×)
1%. Tables5through6summarize the results. Total execu-tion time when filtering a BAM file with one million reads using a single predicate is reduced by 9.5%. Thus we can see that by improving Memoro scores, we can also improve overall performance. The runtime overhead imposed by the instrumentation is 5.5×, slightly higher than the previous example.
5.3 Discussion
Using Memoro has helped us to design the visualization and data presentation in a way that helps pinpoint issues very quickly. In all of our case studies, Memoro made heap usage issues plainly obvious. The majority of our time was spent gaining familiarity with the code bases so as to identify and understand the changes suggested by the data presentation. We have not yet found an occasion when Memoro pro-vided misleading information or false positives in terms of lifetime, usage or useful life, or any other visualization. When a low (poor) score is appears, it is usually very easy to un-derstand by examining the allocation point in the detailed view.
6
Future Work
Memoro currently works well and is easy to understand and use. Nevertheless, we have plans to improve it by reducing its runtime overhead. Currently, the compiler pass only traces the address operand from a load or store instruction across one arc in the SSA graph to see if it was produced by an allocainstruction. Although simple, this analysis reduces runtime overhead by roughly 10%. As we have seen with the LevelDB experiment, a large proportion of instrumented
load/store instructions are not actually heap accesses. More sophisticated analysis could trace more pointer operands fromallocainstructions, and eliminate more instrumen-tation points and reduce overhead further. Moreover, it is possible to detect strided access patterns (e.g.,to a string or array) and track all of their access with a single runtime system call, rather than separately recording each memory reference.
In addition, Memoro currently stores the metadata for all freed chunks in arrays in memory until the program termi-nates. We believe the memory pressure and array resizing overhead could be reduced by fixing the amount of buffering and using a separate runtime thread to periodically write this data to disk.
Our goal is to include Memoro in the sanitizer framework that is part of the Clang and GCC distributions. This will make this tool for detailed heap analysis readily available to users of these compilers on all platforms.
Moreover, the collection methods and data analysis pre-sented in this paper are applicable to other languages and runtime systems. Managed or dynamic language runtimes could track the same data that Memoro collects and generate output in our compact binary format. The Memoro visualizer could then be used for these systems as well, performing the same analyses and score generation, and offering the same insight into heap and memory efficiency.
The Memoro visualizer also contains a C++ library for fast processing of collected data. Advanced users have the op-tion of writing addiop-tional methods in this library to provide custom scores or other metrics drawn from the raw data.
7
Conclusion
In this paper, we have described Memoro, a new detailed heap profiler that uses a combination of static instrumenta-tion, intercepinstrumenta-tion, and runtime data collection to provide a clear view of how efficiently a program uses the heap. This is implemented in a cross-platform, low-overhead package (3.3–5.7×overhead for typical software). The Memoro visu-alizer presents collected information and analysis in a clear, concise manner and automatically flags instances of low-efficiency heap usage for a developer to investigate. The result is quick and accurate diagnoses of problems, which, in three evaluations, lead to significant performance improve-ments. Memoro is open source and available [8].
References
[1] 2017. Google Perftools. https://github.com/gperftools/gperftools [2] 2017. heaptrack: A heap memory profiler for Linux. https://github.
com/KDE/heaptrack
[3] 2017. Massif. http://valgrind.org/docs/manual/ms-manual.html [4] 2017. Memcached: A Distributed Memory Object Caching System.
https://memcached.org. Accessed: 02-02-2018.
[5] Glenn Ammons and James R Larus. 1998. Improving Data-Flow Analy-sis with Path Profiles. InACM SIGPLAN Notices, Vol. 33. ACM, 72–84.
[6] Derek W Barnett, Erik K Garrison, Aaron R Quinlan, Michael P Ström-berg, and Gabor T Marth. 2011. BamTools: a C++ API and Toolkit for Analyzing and Managing BAM Files.Bioinformatics27, 12 (2011), 1691–1692.
[7] Bruno Blanchet. 2003. Escape Analysis for JavaTM: Theory and Prac-tice.ACM Transactions on Programming Languages and Systems25, 6 (Nov. 2003), 713–775. https://doi.org/10.1145/945885.945886 [8] Stuart Byma. 2017. Memoro.https://github.com/epfl-vlsc/memoro.
Accessed: 01-11-2017.
[9] Adriana Chis, Nick Mitchell, Edith Schonberg, Gary Sevitsky, Patrick O’Sullivan, Trevor Parsons, and John Murphy. 2011. Patterns of Mem-ory Inefficiency.ECOOP Object-Oriented Programming(2011), 383–407. [10] Intel Corporation. 2017. Intel 64 and IA-32
Architec-tures Software Developer’s Manual. https://www.intel. com/content/dam/www/public/us/en/documents/manuals/ 64-ia-32-architectures-software-developer-vol-3b-part-2-manual. pdf. Accessed: 01-11-2017.
[11] Bruno Dufour, Barbara G. Ryder, and Gary Sevitsky. 2007. Blended Analysis for Performance Understanding of Framework-based Appli-cations. InInternational Symposium on Software Testing and Analysis (ISSTA ’07). ACM, New York, NY, USA, 118–128. https://doi.org/10. 1145/1273463.1273480
[12] Sanjay Ghemawat and Jeff Dean. 2017. LevelDB.https://github.com/ google/leveldb. Accessed: 02-02-2018.
[13] Brendan Gregg. 2017. Flame Graphs.http://www.brendangregg.com/ flamegraphs.html. Accessed: 01-11-2017.
[14] Brendan Gregg. 2017. Memory Flame Graphs. http://www. brendangregg.com/FlameGraphs/memoryflamegraphs.html. Ac-cessed: 01-11-2017.
[15] Google Inc. 2017. Protocol Buffers. https://developers.google.com/ protocol-buffers/. Accessed: 01-11-2017.
[16] Chris Lattner and Vikram Adve. 2004. LLVM: A Compilation Frame-work for Lifelong Program Analysis & Transformation. InProceedings of the international symposium on Code generation and optimization:
feedback-directed and runtime optimization. IEEE Computer Society, 75.
[17] Jacob Leverich. 2014. Mutilate: A High-Performance Memcached Load Generator.
[18] Heng Li, Bob Handsaker, Alec Wysoker, Tim Fennell, Jue Ruan, Nils Homer, Gabor Marth, Goncalo Abecasis, and Richard Durbin. 2009. The Sequence Alignment/Map Format and SAMtools.Bioinformatics
25, 16 (2009), 2078–2079.
[19] LLVM. 2017. Clang: A C Language Family Frontend for LLVM.https: //clang.llvm.org/. Accessed: 01-11-2017.
[20] Svetozar Miucin, Conor Brady, and Alexandra Fedorova. 2016. DINA-MITE: A Modern Approach to Memory Performance Profiling.CoRR
abs/1606.00396 (2016). arXiv:1606.00396 http://arxiv.org/abs/1606. 00396
[21] Nicholas Nethercote and Julian Seward. [n. d.]. Valgrind: A Framework for Heavyweight Dynamic Binary Instrumentation. InProceedings of the 28th ACM SIGPLAN Conference on Programming Language Design and Implementation (PLDI ’07). ACM, New York, NY, USA, 89–100. http://doi.acm.org/10.1145/1250734.1250746
[22] Tony Printezis and Richard Jones. 2002.GCspy: An Adaptable Heap Visualisation Framework. Vol. 37. ACM.
[23] Konstantin Serebryany, Derek Bruening, Alexander Potapenko, and Dmitriy Vyukov. 2012. AddressSanitizer: A Fast Address Sanity Checker.. InUSENIX Annual Technical Conference. 309–318. [24] Ran Shaham, Elliot K. Kolodner, and Mooly Sagiv. 2001. Heap
Pro-filing for Space-efficient Java. InProceedings of the ACM SIGPLAN 2001 Conference on Programming Language Design and Implementation (PLDI ’01). ACM, New York, NY, USA, 104–113. https://doi.org/10. 1145/378795.378820
[25] Milos Tosic. 2017. MTuner: a C/C++ memory profiler and memory leak finder for Windows, PlayStation 4, PlayStation 3, etc. https: //github.com/milostosic/MTuner
[26] Valgrind. 2017. DHAT. http://valgrind.org/docs/manual/dh-manual. html