The Function of Peroxisome Proliferator-Activated Receptor-Gamma in the Urothelium
Chang Liu
Submitted in partial fulfillment of the requirements for the degree of
Doctor of Philosophy under the Executive Committee of the Graduate School of Arts and Sciences
COLUMBIA UNIVERSITY 2018
© 2018
Chang Liu
All rights reserved
ABSTRACT
The Function of Peroxisome Proliferator-Activated Receptor-Gamma in the Urothelium Chang Liu
The urothelium is a stratified epithelium that serves as a barrier between the urinary tract and blood. It consists of terminally differentiated umbrella cells, which are specialized for
synthesizing and assembling uroplakins into a tough apical plaque and responsible for the barrier function; intermediate cells which are few in number but serve as umbrella cell progenitors; and unipotent basal cells, which populate the majority of the urothelium. The urothelium is one of the most quiescent epithelia in the body but can rapidly regenerate in response to damage.
The urothelium is also a source of cells that give rise to bladder cancer. Patients with chronic inflammation caused by indwelling catheters or repeated urinary tract infections have a higher risk of developing bladder cancer. Bladder cancers with squamous histological features are considered to be more aggressive with poor prognosis and the majority are categorized as basal subtype. The expression of Peroxisome Proliferator-Activated Receptor-gamma (PPARG) is strongly down regulated in the basal subtype of bladder cancer, suggesting that its removal might be essential in tumorigenesis.
PPARG is a nuclear hormone receptor that was originally described as a master regulator of adipogenesis but could also promote cellular differentiation in a number of epithelium.
PPARG also serves as an important regulator in anti-inflammatory activity after a variety of injuries, acting in part by antagonizing the NF-kB pathway. In urothelial cells, it has been shown that PPARG promotes urothelial differentiation in vitro, but its function in vivo remains
To determine the role of PPARG in vivo, we used Cre-Lox recombination to
conditionally delete the Pparg gene in the mouse urothelium using the ShhCre driver, which
drives recombination in basal and intermediate cells, and their respective daughters.
Interestingly, ShhCre;Ppargfl/fl mutants lack umbrella and intermediate cells which normally
populate the luminal and sub-luminal layers, and are instead populated with an abnormal cell population negative for classical urothelial markers. The basal compartment, which in wild type mice is largely populated by P63+ KRT5+ basal cells with a small sub-population expressing KRT14; has an increased number of KRT14-expressing cells in the mutants and exhibits squamous features that are not present in the normal urothelium.
In wild type animals, urinary tract infection (UTI) with uropathogenic E.coli results in a transient innate immune response, followed by proliferation and repair, which is largely
complete within 2 weeks. When ShhCre;Ppargfl/fl mutants were challenged with urinary tract
infection, the innate immune response was not resolved even after several weeks, as
characterized by persistent NF-kB activity, excessive influx of neutrophils and macrophages, and massive granulation tissue in the stroma. In addition, the Pparg-knockout urothelium exhibited squamous metaplasia. The Krt14+ basal cell population, which is considered to be the cells of origin of bladder cancer, greatly expanded in the Pparg-deleted urothelium after infection, and some lesions progressed to acquire invasive features.
Together these findings suggest that PPARG is essential for the normal differentiation of the urothelium and is a potent regulator of the inflammatory response after UTI. Understanding the link between the loss of PPARG, chronic inflammation and tumorigenesis in the urothelium could shed light on the urothelial differentiation network and pave the way for the development of therapeutic approaches to various urinary diseases.
Table of Contents
List of Figures ... iv
List of Tables ... vii
Chapter 1 Introduction ... 1
1.1 Urothelium... 2
1.1.1 Cell types of the urothelium ... 2
1.1.2 Urothelial cell lineages ... 5
1.1.3 Uroplakins ... 6
1.1.4 Signaling pathways important in urothelial formation and regeneration ... 8
1.2 Urinary Tract infection (UTI)... 9
1.2.1 Uropathogenic Escherichia coli (UPEC) ... 10
1.2.2 Host defense ... 11
1.2.3 Regeneration of the urothelium ... 16
1.3 Peroxisome proliferator-activated receptors (PPARs) ... 16
1.4 PPARG ... 20
1.4.1 PPARG ligands ... 20
1.4.2 The function of PPARG in different tissue ... 21
1.4.3 PPARG in the urothelium ... 24
1.5 Summary ... 27
Chapter 2 Materials and methods ... 28
2.1 Mouse strains and genotyping ... 29
2.3 Transmission electron microscopy ... 34
2.4 RNA-seq ... 34
2.5 Dye-retention assay ... 35
2.6 Tamoxifen administration ... 36
2.7 Bacterial culture and experimental bladder infection ... 36
2.8 Immune cell isolation and fluorescence activated cell sorting (FACS) ... 37
2.9 Quantification and statistical analysis ... 38
Chapter 3 The function of PPARG in urothelial differentiation ... 39
3.1 Introduction ... 40
3.2 Results... 42
3.2.1 PPARG expression in the urothelium ... 42
3.2.2 Knockout Pparg in the urothelium in vivo ... 42
3.2.3 Pparg is essential for the formation of superficial and intermediate cells ... 43
3.2.4 The mutant urothelium retained its barrier function but is hyperplasic... 44
3.2.5 The phenotype in ShhCre;Ppargfl/flurothelium is non-progressive ... 45
3.2.6 PPARG is required for maintaining superficial cells ... 46
3.2.7 Downstream targets of PPARG in the urothelium ... 47
3.3 Discussion ... 49
Chapter 4 The function of PPARG in response to UTI ... 71
4.1 Introduction ... 72
4.2 Results... 74 4.2.1 Pparg ablation in basal cell population resulted in an increase of KRT14+ basal cells
4.2.2 Urinary tract infection could be established in ShhCre;Ppargfl/fl mutants ... 75
4.2.3 Early inflammatory and regenerative responses in ShhCre;Ppargfl/fl mutants after UTI
... 76 4.2.4 ShhCre;Ppargfl/fl mutant failed to repopulate its UPK1A-expressing cells after UTI ... 76
4.2.5 Pparg-ablation in the urothelium leads to squamous metaplasia post infection ... 77 4.2.6 Knockout urothelial Pparg led to persistent inflammation after UTI ... 79 4.2.7 Urothelial cells in the ShhCre;Ppargfl/flmutants exhibit invasive behavior after UTI ... 81
4.3 Discussion ... 83 Chapter 5 Discussion ... 106 References ... 111
List of Figures
Chapter 1
Figure 1.1 Ultrastructure of umbrella cells ... 4
Figure 1.2 Assembly of uroplakins. ... 7
Figure 1.3 UPEC pathogenic cycle. ... 11
Figure 1.4 Host responses to UPEC infection in the bladder. ... 15
Figure 1.5 Domain structure of PPARs. ... 17
Figure 1.6 The interactions of PPARs with corepressors and coactivators. ... 18
Figure 1.7 Mechanisms of PPAR-mediated transrepression. ... 19
Chapter 3 Figure 3.1 PPARG expression in adult murine urothelium in vivo. ... 52
Figure 3.2 ShhCre;Ppargfl/fl line efficiently ablates PPARG expression in the urothelium. ... 52
Figure 3.3 Absence of umbrella cell in the urothelium of ShhCre;Ppargfl/fl mutants. ... 53
Figure 3.4 Ultrastructure of the top cells in the urothelium. ... 54
Figure 3.5 Uroplakin expression is significant lower in ShhCre;Ppargfl/fl mutants. ... 55
Figure 3.6 Pparg-ablated urothelium has altered cell population. ... 56
Figure 3.7 Barrier permeability is maintained in ShhCre;Ppargfl/fl mutants... 57
Figure 3.8 No spontaneous inflammation in the ShhCre;Ppargfl/fl mutants. ... 58
Figure 3.9 PPARG-ablated urothelium is hyperplastic. ... 59
Figure 3.10 The phenotype in ShhCre;Ppargfl/fl mutants is stable and non-progressive. ... 60
Figure 3.11 PPARG is essential for the maintenance of mature umbrella cells. ... 61 Figure 3.12 Ablation of PPARG in Upk2-expressing cells partially recapitulates the phenotype of
Figure 3.13 Ablation of PPARG in the Upk2-expressing cells induced proliferation in the
urothelium. ... ... 63
Figure 3.14 Altered cell populations in Upk2CreERT2; Ppargfl/fl mutants ... 64
Figure 3.15 Flow chart outlining combined analysis of RNAseq and ChIPseq datasets. ... 65
Figure 3.16 GRHL3 is identified as a direct target of urothelial PPARG. ... 66
Chapter 4 Figure 4.1 Schema of UPEC-induced inflammatory and regenerative responses in the bladder.. 86
Figure 4.2 Pparg-ablated urothelium has increased number of KRT14+ basal cells. ... 87
Figure 4.3 Pparg deletion in the basal cells led to the increase of KRT14+ cells. ... 88
Figure 4.4 Urinary tract infection can be established in the ShhCre;Ppargfl/fl mutants. ... 89
Figure 4.5 Bacteria clearance after urinary tract infection. ... 90
Figure 4.6 ShhCre;Ppargfl/fl mutants were able to initiate inflammatory and regenerative responses after UTI... ... 91
Figure 4.7 ShhCre;Ppargfl/fl mutants were unable to repopulate UPK expressing cells after UTI. 92 Figure 4.8 Expansion of KRT14+ basal cell population after UTI. ... 93
Figure 4.9 Pparg-ablated urothelium developed lesions with squamous metaplasia 4 weeks post infection. ... ... 94
Figure 4.10 Dramatic abnormalities in the stroma of ShhCre;Ppargfl/fl mutants 4 weeks post infection. ... ... 95
Figure 4.11 Chronic inflammation in the ShhCre;Ppargfl/fl bladders 4 weeks post infection. ... 96
Figure 4.12 No B cell presence in the bladder 4 weeks post infection ... 97
Figure 4.14 Immune cells in ShhCre;Ppargfl/fl mutants have wild-type Pparg gene. ... 99
Figure 4.15 Persistent NF-kB and STAT3 activation contributed to prolonged inflammation in the bladder of ShhCre;Ppargfl/fl mutants. ... 100
Figure 4.16 Pparg-ablated urothelium exhibited invasive features 4 weeks post infection. ... 101 Figure 4.17 Lesions in ShhCre;Ppargfl/fl mutants 6 weeks post infection exhibit features of basal
subtype of bladder cancer. ... 102 Figure 4.18 Inflammation was resolved 1 year post infection ... 103
List of Tables
Chapter 1
Table 1.1 Markers for urothelial cells.. ... 5
Chapter 2 Table 2.1 Mouse lines used in this study ... 29
Table 2.2 PCR primers used for genotyping ... 30
Table 2.3 PCR programs for genotyping ... 31
Table 2.4 Primary antibodies used in this study ... 32
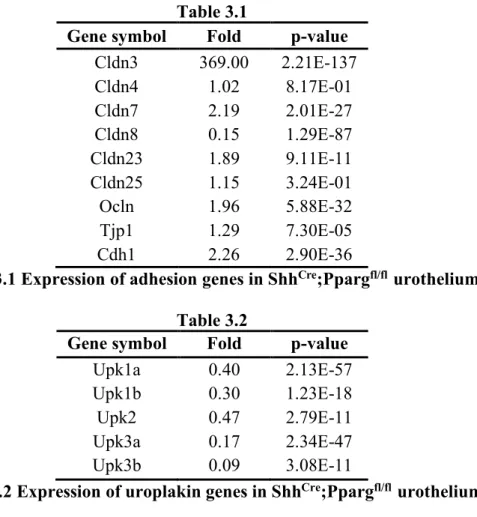
Chpater 3 Table 3.1 Expression of adhesion genes in ShhCre;Ppargfl/fl urothelium ... 67
Table 3.2 Expression of uroplakin genes in ShhCre;Ppargfl/fl urothelium ... 67
Table 3.3 Enrichment analysis of gene ontology (GO) of genes down-regulated in ShhCre;Ppargfl/fl urothelium ... 68
Table 3.4 Enrichment analysis of gene ontology (GO) of genes up-regulated in ShhCre;Ppargfl/fl urothelium... ... 69
Table 3.5 Potential direct targets of urothelial PPARG ... 70
Chapter 4 Table 4.1 Enrichment analysis of gene ontology (GO) of genes down-regulated in ShhCre;Ppargfl/fl urothelium ... 104
Table 4.2 Enrichment analysis of gene ontology (GO) of genes down-regulated in ShhCre;Ppargfl/fl urothelium ... 105
Acknowledgements
It has been a long and bumpy journey for me and I never could come this far without the support and encouragement of a large number of people.
First and foremost, I am sincerely grateful to my thesis advisor and mentor, Dr. Cathy Mendelsohn, for her outstanding mentorship, incredible support, remarkable patience,
encouragement and kindness. I cannot thank her enough for taking me into her lab when I was in a very difficult time during my Ph.D. and for believing in me even when I lost confidence. She always made herself available to offer invaluable advice and help, ranging from lab work to career choice to life planning. I would also like to thank my first mentor in graduate school, Dr. Fiona Doetsch, for giving me the initial training; and my undergraduate summer program research advisor, Dr. Yang Fan, for cultivating my critical thinking and independence and encouraging me to apply for graduate school at the first place. I am grateful that I have met so many brilliant female scientists along the way to learn how to become one.
I would also like to thank the members of my thesis committee, Dr. Peter Canoll, Dr. David Owens, Dr. Piero Dalerba for their insightful discussions and advice along these years. Special thanks to Dr. Molly Ingersoll for being my outside thesis committee member and provided fresh insights on my project. I must thank all of my collaborators around the world, who generously provided me reagents, experiential support and fresh ideas. Special thanks to Dr. Joo-Seop Park, for not only generating the ChIPseq data for me and introducing the work flow to me.I am also grateful for the Pathology and Molecular Medicine graduate program at Columbia University, especially Zaia Sivo, for her continuous support during the course of my Ph.D. studies.
I must thank all the present and past Mendelsohn lab members and Doetsch lab members, who have provided me tremendous support throughout my graduate studies. Special thanks to my lab sisters Dr. Elizabeth Crouch, Kerry Schneider and Tiffany Tate for always offering me intellectual inputs as well as technical and spiritual support. I also owe a debt of gratitude to our lab manager Ekatherina Batourina, for getting me all the reagents and supplies in time for experiments. I must also offer thanks to members at the core facilities for their high-quality works and wiliness to adjust their process to best suit my needs.
I have been fortunate to have many incredible friends who supported me in science and beyond. I need to offer many thanks to my best friends Dr. Ming Sun, Dr. Boyang Zhang, Dr. Jing He, Dr. Ruijun Zhu, Dr. Lujin Song and Jing Du, who accompanied me through all my ups and downs in graduate school. Special thanks to my classmate Dr. Jennifer Crowe, who provided me tremendous help in lab and beyond. I want to thank all my dearest friends that I met at
different stages of my life, they are too many to mention but dear to me.
Finally, I would like to express my deepest gratitude to my family. Without their unconditional support and understanding, I would not have made it. And thanks to my love Dr. Cheng Wang, who has provided me endless support and inspiration in science and in life.
Chapter 1
1.1 Urothelium
The urothelium is a stratified epithelium that serves as a crucial barrier between the urine and the inside of the body. It has an exceptionally high transepithelial electric resistance up to 75,000 Ω/cm2 to prevent unregulated exchange of ions, metabolites, and toxic substances [1]. The urothelium lines the inner surface of the distal portion of the urinary tract, including the renal pelvis, ureters, urinary bladder, and prostatic urethra, with distinct features at each region [2]. In the bladder, the surface area is highly distensible in order to accommodate large changes in urine volume [3]. In addition to its role as a barrier, the urothelium actively regulates the passage of substances across the mucosal surface of the bladder [4]–[7]. Furthermore, the urothelium can sense external stimuli and release various mediators, which allow it to
communicate information with adjoining cells and the underlying tissues. This enables an active response to changes in metabolism and in the environment by modifying ion and protein
composition of the urine accordingly [8], [9].
1.1.1 Cell types of the urothelium
The urothelium is comprised of three major cell types: umbrella cells, intermediate cells, and basal cells.
Umbrella cells, or superficial cells, are highly differentiated cells that occupy the outermost layer of urothelium. They are large polyploid polyhedral cells that typically have 5-6 sides and range from 25 to 250um in diameter, covering up to 50 underlying cells, hence the name umbrella cell [10]. Their shape changes according to the filling state of the bladder:
cuboidal in the empty bladder and highly stretched and flat when the bladder is full [3]. Umbrella cells are responsible for the low permeability of the urothelial barrier [4], [11]. They are
specialized for synthesis and transport of a family of transmembrane proteins called uroplakins, which assemble into apical plaques, forming an asymmetric unit membrane (AUM) with an outer leaflet twice as thick as the inner leaflet [12], [13]. Discoidal or fusiform-shaped vesicles (DFV) are specialized in delivering and recycling uroplakins to and from the apical surface of the umbrella cells in response to filling and voiding of the bladder to expand and decrease apical surface area accordingly [14]–[16]. Approximately 90% of the apical membrane is covered by plaques, and the remaining surface is known as the hinge region [11]. The plaque regions are highly rigid and detergent insoluble while the hinge regions are relatively more flexible, giving the apical membrane a distinct scalloped appearance [17], [18]. Paracellular spaces between adjacent umbrella cells are sealed by high-resistance tight junctions, which effectively demarcate distinct apical and basolateral membrane domains in umbrella cells [19]–[21]. Urothelial tight junctions are comprised of tight junction protein 1 (zonula occludens, ZO-1), occludin, claudin-4, 8, and 12 [19], [22]. Just above the tight junction, interdigitations of apical membrane from adjacent cells zip the cell periphery [23]. The crystalline plaques combined with tight junctions result in the high-resistance barrier.
Figure 1.1
Figure 2.1 Ultrastructure of umbrella cells. (A) Discoidal or fusiform-shaped vesicles (DFVs). (B) asymmetric unit membrane (C) tight junctions. TJ: tight junctions, Ds: desmosomes (Figure modified from [24])
Intermediate cells are located below and in close proximity with umbrella cells. They are relatively few in number in murine urothelium [25]. Intermediate cells are often pyriform in shape, mono- or double- nucleated, and around 10–25 um in diameter [10]. Intermediate cells just beneath the umbrella cells are partially differentiated, which could enable them to rapidly differentiate when the overlying umbrella cells are dead and fallen off due to bacterial infection or exposure to toxins [26]–[28]. Some intermediate cells form long, thin cytoplasmic extensions that contact the basement membrane [3], [29].
Basal cells are the largest population, comprising more than 80% of the urothelium in mice. Basal cells reside in both basal and suprabasal layers [25]. They are diploid and of regular size, approximately 5-10 um diameter [10]. Basal cells adhere to the basement membrane by hemidesmosomes mediated by beta4-integrin [24].
Different urothelial cell populations can be identified based on their expression of distinct sets of molecular makers. Cytokeratin-20 (KRT20) is solely expressed in the mature umbrella cells [30]. Uroplakins (UPK) are expressed by both umbrella and intermediate cells, but highly enriched in umbrella cells [25]. P63, a homologue of the P53 tumor suppressor gene, and sonic
hedgehog (SHH) are expressed in both intermediate and basal cells but are absent in umbrella cells [25], [31]. Cytokeratin-5 (KRT5) is specific to the basal cell population. Cytokeratin-14 (KRT14) is expressed by a sub-population of the basal cells, which has been implied to be the progenitor population in the murine bladder [32], [33]. In addition, all urothelial cells express forkhead box A1 (FOXA1) and cytokeratin-7 (KRT7), [30], [34] (Table 2.1).
Table 1.1
KRT20 UPK P63 SHH KRT5 KRT14
Umbrella cell + + - - - -
Intermediate cell - + + + - -
Basal cell - - + + + +/-
Table 1.1 Markers for urothelial cells.
1.1.2 Urothelial cell lineages
The embryonic urothelium is derived from cloacal endoderm. The urothelium was initially thought to differentiate in a linear sequence as occurs in skin, starting from basal stem cells which progressively differentiate to intermediate cells then mature into umbrella cells [35]– [38]. However, ongoing developmental studies in our lab discovered a transient population of progenitors P-cells (FOXA2+ P63+ KRT5- UPK-), which gives rise to intermediate and
superficial cells between E12 and E14, and produce basal cells between E15-E17. Recent studies suggested that during homeostasis and acute injury, intermediate cells are responsible for
producing new superficial cell daughters, wherease basal cells repopulate themselves. Basal cells only act as stem cells in response to chronic or repetitive damage, which depletes the
which genetic or epigenetic pathways are altered in basal cells after repetitive damage, nor is it known whether these changes are triggered by inflammation.
1.1.3 Uroplakins
Uroplakins (UPK) are a family of transmembrane proteins that contribute to the
formation of urothelial paques and asymmetric unit membranes (AUMs), which play an essential role in the permeability barrier function of the urothelium [39]. The uroplakin family is
composed of at least five proteins: Uroplakins 1a, 1b, 2, 3a and 3b [40]. UPK1A and UPK1B both have four transmembrane domains (TMD) with a major and a minor hydrophilic domain extending extracellularly [41]. UPK2, UPK3A and UPK3B only have a single-span. UPK2 has a non-glycosylated N-terminal domain and a very small C-terminal domain [42]. UPK3A, on the other hand, has a heavily glycosylated N-terminal domain and possesses a significant C-terminal domain, which may be involved in anchoring urothelial plaques and/or transducing signals [43], [44]. UPK3B is the latest addition to the uroplakin family and seems to only play a minor role in the urothelium [45]. Overall, the massive extracellular domains of uroplakins compared to their cytoplasmic domains explain why the outer leaflets of the AUMs appear thicker.
The four major uroplakins form two specific pairs: UPK1A/2 and UPK1B/3A
heterodimers, which are required for their exit from the ER [46], [47].They further assemble into 16nm hexagon crystalline AUM particles when they reach the apical membrane of umbrella cells, with six subunits arranged in inner and outer rings [13], [48]. A urothelial plaque contains approximately 1000–3000 AUM particles [24].
Uroplakins are essential for the barrier function of the urothelium. Upk3a knockout mice have a 70-80% reduction of urothelial plaques, partially compensated by Upk3b, and develop
hydronephrosis [49]. Knockout of the Upk2 gene results in a complete loss of urothelial plaques and a hyperplastic urothelium [50]. Both Upk3a knockout mice and Upk2 knockout mice have increased barrier permeability to water and urea [11], [51]. Altered uroplakin expression is also found in urothelial carcinoma [52].
Uroplakins are transported by discoidal or fusiform-shaped vesicles (DFVs), which are accumulated under and fuse with the apical surface of the umbrella cells in response to bladder filling through exocytosis and endocytosis [14]–[16]. DFVs are concentrated ~150-300nm below the apical membrane, stopped by a dense cytokeratin network including KRT20. The wall of this meshwork is perpendicular to the apical plasma membrane, forming parallel tunnels with tapered openings towards the apical membrane, guiding DFVs to the surface during bladder filling [30], [34]. Under hydrostatic pressure, the apical surface area of the umbrella cells could increase as much as 50% through exocytosis of uroplakins [16].
1.1.4 Signaling pathways important in urothelial formation and regeneration
Communication between epithelial and stromal compartments is critical for urothelial specification, maintenance and regeneration.
Proper urothelial differentiation relies on inductive signals secreted by urothelial cells and the underlying stroma. The role of retinoic acid, the active form of vitamin A, in maintaining urothelial phenotype has long been appreciated since vitamin A deficiency results in keratinizing squamous metaplasia in the urothelium and other epithelia [53]–[55]. Blocking retinoid signaling in the urothelium led to impaired umbrella cell formation during development and regeneration [25]. Fibroblast growth factor 7 (FGF7) is secreted by stromal cells and acts on urothelial cells through a paracrine manner to regulate urothelial stratification [56]. Mutations in the fibroblast growth factor receptor 3 (FGFR3) gene are prevalent in low grade urothelial tumors [57], [58]. Bone morphogenetic protein 4 (BMP4) and its receptor BMPR1A is another pair that is
important for urothelial-stromal cross talk [28]. Knocking out Bmpr1a in the urothelium results in aberrant urothelial proliferation and failed umbrella cell differentiation after urinary tract infection [59].
Likewise, the urothelium also sends reciprocal signals to influence the stroma. SHH pathway is essential for normal bladder development and regeneration. During development, SHH is expressed by the cloacal epithelia, while SHH-responsive cells are located in the peri-cloacal mesenchyme, which later gives rise to bladder stroma. Abrogation of SHH signaling results in mesenchymal hypoplasia [60], [61]. Release of SHH ligand has also been shown to be increased in injured urothelium, which is responsible for the upregulation of genes like Wnt2/4 and Bmp4/5. This gene upregulation forms a feedback loop to stimulate stromal and urothelial proliferation and to promote urothelial differentiation [37], [62].
The differentiation state of urothelial cells also depends on their internal transcriptional network to integrate and react to signals from the microenvironment. Transcription factors that have been implicated in urothelial differentiation include FOXA1, PPARG, P63, E74-like factor 3 (ELF3), and grainyhead like transcription factor 3 (GRHL3) [32], [63]–[66]. ELF3 has been identified as an early transcriptional regulator in the urothelium through analyzing short time series data. Knocking down ELF3 in normal human urothelial (NHU) cells results in reduced UPK3A expression as well as decreased transepithelial electrical resistance [65]. FOXA1 is important in maintaining urothelial phenotype. Loss of FOXA1 in the urothelium leads to urothelial hyperplasia in male mice and keratinizing squamous metaplasia in female mice [32]. PPARG activation has been associated with urothelial differentiation. Treating urothelial cells with PPARG agnoist reverses squamous metaplasia and induces uroplakin expression [64], [67]. GRHL3 is essential for terminal differentiation of umbrella cells. Ablation of GRHL3 results in failure of apical membrane specialization [68]. P63 is important in maintaining the progenitor states of the cells. The urothelium of P63-null mouse embryos is comprised by a single layer of cuboidal-shaped UPK3A expressing cells without intermediate or basal layers [63].
1.2 Urinary Tract infection (UTI)
Urinary tract infection is one of the most common bacterial infections worldwide.
Around 150 million people develop UTIs each year and the number has been increasing steadily, partially attributed to a rise in the elderly population and the use of indwelling urinary catheters. [69], [70]. Around half of women and 5% of men will experience at least one UTI during their life time, and 25% of women will suffer from recurrent UTIs within 6 months of their first episode [71], [72]. Current treatments for UTI faces serious challenges from the rise of
multidrug-resistant uropathogenic bacteria and from the limitation that antibiotic therapy does not preclude recurrences [73], [74]. New discoveries on the fundamental biology of UTIs could provide new insights for developing alternative therapeutic approaches.
1.2.1 Uropathogenic Escherichia coli (UPEC)
A number of microbes can cause UTI, but uropathogenic Escherichia coli, which usually originates from the gut, accounts for more than 80% of infections [69]. UPEC expresses FimH adhesin at the distal tip of hair-like organelles called type 1 pili, which is critical for its
attachment and invasion [75]. FimH can bind to mannosylated receptors on the umbrella cells, primarily UPK1A [76]. Attached bacteria then invade into umbrella cells by hijacking the innate vesicular trafficking system designed for accommodating the change in bladder volume [77]. Once UPEC is internalized into the cytoplasm, they are protected from expulsion by urination or infiltrating phagocytes [78]. Successfully invaded UPEC then initiates intracellular growth and the mass later mature into biofilm-like foci designated intracellular bacterial communities (IBCs). Bacteria within the IBCs periodically detach and flux the host cell to initiate another round of infection [75], [79], [80]. Those bacteria acquire a filamentous morphology, which may facilitate their evasion from immune cells and dissemination [81], [82].
Figure 1.3
Figure 1.3 UPEC pathogenic cycle. UPEC binds to UPK1A expressing umbrella cells and subsequently invades into the cytoplasm by harnessing the cycling vesicles for trafficking apical membrane segments. Intracelluar UPEC develops IBCs, from which a subset of bacteria detach and reemerge for a second round of infection. Eventually a quiescent reservoir is formed, which could contribute to the recurrence of infection, although the trigger of the reemergence is unkown. (Figure taken from [75])
1.2.2 Host defense
Most of the time, UTIs are contained within the tract and resolves within days even without treatment [83]. This resistance is largely attributed to the robust innate immune defense in the bladder, whereas the adaptive immune responses are limited [78].
The urothelium is the first line of defense against UPEC infection. Urothelial cells continuously secret antimicrobial peptides and other factors to inhibit bacterial growth in the urine [78]. Host responses in the umbrella cells are triggered upon UPEC attachment. FimH
activate intracellular signaling pathways [76], [84]. Internalized UPEC can be detected by toll-like receptor 4 (TLR4) or mucolipin 3 (TRPML3), which then activate pathways that direct exocytosis of UPEC-containing vesicles, expelling bacteria back to the lumen in a matter of minutes [85], [86]. The invasion of bacteria also triggers an apoptotic response in the umbrella cells and results in exfoliation of this layer [87]. Sloughing IBC-containing cells into urine and excreting them from the body help eliminate thousands of bacteria. Studies in mouse models have shown that there are shedded umbrella cells in the urine 6 hours after transurethral inoculation of UPEC [28]. Furthermore, pattern recognition receptors, like TLR4, trigger
inflammatory responses by activating the NF-kB pathway, which in turn initiates the production of pro-inflammatory cytokines and chemoattractants, such as interleukin (IL) -1, -8 and tumor necrosis factor (TNF) [88]. These inflammatory mediators result in a vigorous influx of immune cells to the bladder to counter the bacterial challenge.
Innate immune responses play a major role in defending against UPEC and an array of proinflammatory cytokines and chemokines have been identified to be upreagulated over the course of UTI. These include IL1B, IL6, IL17, granulocyte colony-stimulating factor (G-CSF) and keratinocyte-derived cytokine (KC). Most of the mediators reach their peak expression level 24 hours post infection and then decrease over time to baseline 2 weeks after infection [89].
The first immune cells to get recruited by this inflammatory milieu are neutrophils, which are present in urine as early as 2 hours post-infection, and their numbers peak by 6 hours in mouse models [90]. Massive neutrophil infiltration is a diagnostic hallmark of UTI and the number of neutrophils closely correlates with the bacterial load in the urinary tract [91], [92]. Neutrophils play a predominant role in antibacterial defense in the bladder through their phagocytic ability as well as the release of an array of cytotoxic products [93]. Blocking
granulocyte infiltration to the bladder by GR1 antibody resulted in poor bacteria clearance [91]. However, neutrophil influx is a double-edged sword. Excessive neutrophil responses could cause substantial damage to the bladder tissue as they release cytotoxic products and break through cell junctions between adjoining urothelial cells, predisposing the bladder to worse infection
outcomes [94], [95]. Consistent with this, neutralization of granulocyte colony-stimulating factor (CSF3), a pro-inflammatory cytokine inducing neutrophils emigration from the bone marrow into the blood stream, decreases neutrophil recruitment to the bladder after UTI and resulted in a lower bacterial load [89].
Macrophages, another kind of phagocytes, play a central role in modulating the innate immune defense against UPEC infection. Tissue-resident macrophages are present in the bladder stroma and responsible for immune surveillance during homeostasis. Upon infection, resident macrophages produce pro-inflammatory cytokines to recruit other immune cells and coordinate their activities [78], [96]. It has been shown that inflammatory macrophages recruited from the periphery by resident macrophages are essential for neutrophil migration across the basement membrane to reach bacteria in the urothelium [97]. After bacteria clearance, macrophages are considered as the major cell type that is responsible for promoting resolution of inflammation by producing anti-inflammatory cytokines as well as phagocytizing apoptotic neutrophils, as
observed in other organs [96], [98], [99]. However, the function of macrophages in the resolution phase has not yet been demonstrated specifically in the bladder. Studies show mast cells may also have similar roles to macrophages in response to UPEC infection [100]. One study showed that IL10, a major inhibitor of the proinflammatory immune response, was produced by mast cells 6 hours post infection [101].
γδ T cells, a distinct T cell sub-population has been considered to be a bridge between the innate and adaptive immune system, have an intriguing role in the bladder upon UPEC infection [102]. Investigating genetic knockout mice revealed that mice without γδ T cells are more susceptible to UTI, suggesting γδ T cells are important for defending against UPEC infection [103]. Further studies showed that γδ T cells are the main source of IL17 in the bladder. IL17 has been shown to be critical for autoimmune disease and in bacterial infection, which spans both the innate and adaptive arms of the immune system. IL17 deficiency leads to defects in bacterial clearance after UTI, suggesting it contributes to the innate immune defense. Interestingly, IL17 does not appear to contribute to the adaptive immune response after UPEC infection, suggesting γδ T cells mainly participate in innate responses after UTI [104].
Adaptive immune responses are considered limited in response to infections explicit in the bladder. But some evidence suggests that the adaptive immune response also participates in defending against UPEC, although the data remains controversial. Immunization with FimH-adhesin-based systemic vaccines inhibits UPEC colonization in the bladder, suggesting humoral immunity plays a role [105]. However, examination of urine specimens from acute cycstitis patients failed to detect an antibody response, raising the question wthether humoral immune responses are naturally evoked by UPEC infections in the bladder [106]. Potential cellular responses to UPEC infection has been studied using an engineered UPEC strain which expresses ovalbumin (OVA) as an antigenic marker [107]. However, when OVA is introduced into the urothelium, it could also serve as a foreign antigen, and this study did not address the question of whether the cellular response is specific for UPEC or for OVA. Recent studies showed that macrophages and mast cells contribute to muting adaptive immune response during UTI. It has been showed that depletion of resident macrophages improves bacteria clearance after a second
infection, and the effect is lost in mice depleted of T cells [108]. Another study showed that mast cell derived IL10 decreased the activation of dendritic cells and in turn tempered adaptive immne responses [101]. It is still unclear under what condition adaptive immune responses could be evoked effectively.
Figure 1.4
1.2.3 Regeneration of the urothelium
The urothelium is one of the most quiescent epithelium in the body, with a turnover rate about 3-6 months [110]. However, the urothelium can regenerate rapidly in response to acute injury such as UTI.
Exfoliation of umbrella cells triggered by UPEC attachment and invasion results in disrupted barrier function and gives UPEC and other toxic substances access to the underlying tissue. To minimize the harmful effects, the quiescent urothelium promptly shifts to a rapid regenerating state. Intriguingly, the expression of genes involved in urothelial proliferation and differentiation, such as Elf3 and delta-like 1(Dll1), has already changed within 1.5-3 hours of infection, prior to umbrella cell exfoliation [28], [111]. Urothelial proliferation starts around 12 hours post infection, peaks at 24 hours, and ceases around 72 hours [37]. After 7 days, the urothelial barrier is restored, except some of the newly generated umbrella cells are smaller in size [28]. By 2 weeks, the urothlium is completely repaired itself.
1.3 Peroxisome proliferator-activated receptors (PPARs)
Peroxisome proliferator-activated receptors (PPARs) belong to the nuclear hormone receptor superfamily, which play central roles in regulation normal biological processes and diseases. The term peroxisome proliferator-activated receptor came from the observations that PPARs bind to peroxisome proliferator and are responsible for their effects in modulating gene expression and peroxisomes proliferation [112]. Peroxisomes are organelles essential for
breaking down fatty acids and generating reactive orxgen and nitrogen species. Its function of β-oxidation is inducible by peroxisome proliferators [113]. There are three PPAR genes in this family: PPARA, PPARD, and PPARG [114]. They are expressed in a broad range of tissues and
exert multiple functions involved in energy metabolism and storage, inflammation, cellular differentiation, and other important biological processes [115].
PPARs share a similar structure with four major functional domains: A N-terminal domain (A/B), a DNA binding domain (DBD), a hinge region, and a C-terminal ligand binding domain (LBD). The A/B domain harbors a ligand-independent transactivation domain AF-1 (activation function 1) at its extreme N-terminal region. The DBD is formed by two zinc finger-like motifs and highly conserved. The LBD could bind a variety of ligands and incorporates a ligand-dependent transactivation domain AF-2 (activation function 2) at its C-terminus, which is responsible for the interaction with other co-factors [115]. The specificity of the three PPARs to target genes is in part determined by their AF-1 domain. Deletion of the N-terminus leads to nonselective activation of downstream targets [116].
Figure 1.5
Figure 1.5 Domain structure of PPARs. PPARs contain a A/B domain, a DNA-binding domain (DBD), a hinge region and a ligand-binding domain (LBD). (Figure modified from [117] )
PPARs can regulate gene transcription by different mechanisms. PPARs can serve as ligand-activated transcription factors that form heterodimers with RXR. The non liganded form of the PPAR/RXR heterodimer normally resides in the cell nucleus and binds to DNA response elements in the promoter region of target genes designated as peroxisome proliferator response elements (PPREs). PPREs are consensus sequences containing a direct repeat of AGGTCA, separated by one or two nucleotides (DR-1 or DR-2) [115]. The heterodimer complex is kept
repressor 2 (NCOR2), which possesses histone deacetylase (HDAC) activities to maintain a tightly packed structure of chromatin, and therefore repress gene transcription [118], [119]. Ligand binding induces a conformational change of the LBD of PPARs, which leads to an affinity switch that releases corepressors and recruits coactivators [120]. Numerous coactivators have been identified, including PPARG coactivator 1-α (PPARGC1A), CREB-binding protein (CREBBP) and E1A binding protein p300 (EP300), which are responsible for chromatin
modification. Acetylation of histone proteins relieves the tight chromatin structure and open it up for the RNA polymerase II complex to access the promoter and initiate transcription [121].
Figure 1.6
Figure 1.6 The interactions of PPARs with corepressors and coactivators. PPAR/RXR heterodimer is kept inactive in the unliganded state by corepressor complexes. Ligand binding releases corepressors and recruits coactivators to remodel the chromatin structure, which gives RNA polymerase II complex access to the promoter region of target genes for transcription. (Figure taken from [121])
PPARs can also repress gene transcription by transrepression, which is independent of its DNA binding ability but through interacting with other transcription factors at protein level [122]. For instance, PPARs could bind directly with nuclear factor-κB (NF-κB) and sequester their activities by preventing their binding to DNA and exporting them back to cytoplasm for degradation [123]–[125]. Alternatively, PPARs could compete with other transcription factors for an overlapping though limiting set of coactivators [126]. In addition, it has also been suggested that PPARs could interfere with the clearance of corepressors of other transcriotion factors and therefore repress their transcription [127], [128].
Figure 1.7
Figure 1.7 Mechanisms of PPAR-mediated transrepression. PPARs could interfere other pathways by direct interactions with other transcription factors to (a) prevent their binding to DNA, (b) shuttle their back to cytosol, (c) target them for degradation, by (d) competing for shared coactivators, or by (e) blocking corepressor clearance. (Figure modified from [122], [129])
1.4 PPARG
PPARG exists in two isoforms, PPARG1 and PPARG2, both encoded by the same gene but utilizing two distinct promoter and alternate splicing, hence PPARG2 harbors 30 additional amino acids at its N-terminus [130]. PPARG2 is exclusively expressed in adipose tissue [131], whereas PPARG1 is expressed in several other tissues in addition to fat, including muscle, intestine, kidney, and immune cells [132]–[136].
1.4.1 PPARG ligands
A vast number of natural and synthetic ligands could bind to PPARG. Natural ligands for PPARG include polyunsaturated fatty acids, arachidonate metabolites, eicosanoids and certain prostanoids such as 15-deoxy-Δ12, 14-prostaglandin J2 (15-dPGJ2) [137]. Various natural compounds can bind PPARG at a micromolar level, but in vivo they usually are present in a much lower level. Whether it is sufficient to activate PPARG remains unclear [138]. Despite intensive research efforts, the identification of specific endogenous PPARG ligand turns out to be difficult, and raises the question whether PPARG has one highly specific ligand or if it is activated by the combined concentration of a set of weakly activating fatty acids and their
derivatives. In contrast, synthetic agonists, such as thiazolidinediones (TZDs), are potent PPARG activators. Members of the TZD family like troglitazones, rosiglitazone and pioglitazone have been used for treating type 2 diabetic patients [129], [139]. Synthetic antagonists include
bisphenol A diglycidyl ether 7 (BADGE), nitrobenzanilide 9 (GW9662) and nitrobenzanilide 10 (T0070907), all of which are widely used in cell-based and cell-free assays for PPARG research [140].
1.4.2 The function of PPARG in different tissue Adipose tissue
PPARG was initially identified as a receptor that regulates adipogenesis. Indeed, PPARG plays a critical role in promoting adipocyte differentiation and maturation while suppressing osteogenesis [141]. Knocking down Pparg in 3T3-L1 cells, a preadiopcyte cell line, suppresses their differentiation to adipocyte, whereas ectopic expression of Pparg in NIH 3T3 cells, a fibroblast cell line, in combination with PPARG agonist treatment, is sufficient to stimulate adipose differentiation of the fibroblast cells [142], [143]. Examination of Pparg-null mice revealed that all types of adipose tissue are absent [144]. These observations provided direct evidence that PPARG is indispensatble for adipogenesis both in vitro and in vivo. Lineage tracking studies of PPARG expressing cells in the adipose tissue uncovered an adipogenic progenitor population residing in the adipose vasculature compartment. Treating those cells with TZD promoted their proliferation and differentiation. However, long-term TZD treatment resulted in exhaustion of the progenitor pool, suggesting that over activation of PPARG could also lead to deleterious consequences [145].
A number of genes involved in lipid metabolism and adipogenesis are regulated by PPARG, such as lipoprotein lipase (Lpl), acyl-CoA synthetase (Acsl), and fatty acid binding protein 4 (Fabp4) [115]. It has been shown that PPARG cooperates with CCAAT/enhancer-binding protein alpha (CEBPA) to form a positive feedback loop and promote the adiopogneic program [143], [146].
In addition, PPARG controls lipid homeostasis and its activation increases insulin
sensitivity in adipose tissue. TZD treatment can efficiently alleviate insulin resistence induced by a high-fat diet, but the effect is lost in mice with adipose-specific Pparg knockout [147].
PPARG activation improves insulin sensitivity at several levels. First of all, PPARG directly modulates adipocyte lipid intake through upregulating the expression of fatty acid transport proteins, which facilitate the entry of free fatty acids into adipocytes, therefore lowering their circulating levels [148]. Secondly, PPARG promotes the storage of FFAs in adipocytes by increasing the expression of phosphenolpyruvate carboxykinase (PCK1), which is essential for triglyceride synthesis [149]. Moreover, PPARG regulates the production of numerous
adipokines, including adiponectin (ADIPOQ), resistin (RETN), TNF and IL6, all of which have been implicated in insulin resistance [150].
Immune cells
PPARG plays critical roles in various immune cells. Its function is most well-studied in macrophages and dendritic cells.
In macrophages, PPARG has been implicated for its role in regulating the lipid intake by macrophages from the circulation. CD36, the scavenger receptor on macrophage, is a direct target of PPARG [151]. PPARG is also essential for macrophage intracellular lipid metabolism [152], [153]. Deletion of the Pparg gene in macrophages causes remarkable reduction of gene expression involved in cholesterol flux, including Cd36, Lpl and Abcg1, resulting in higher lipid concentration in the blood [154]. Moreover, PPARG has been demonstrated as a master regulator of macrophage polarization. Activating PPARG in macrophages downregulated the production of pro-inflammatory cytokines such as TNF and IL6 while upregulating the production of anti-inflammatory cytokines like IL10, shifting the macrophages from M1 phenotype to M2
In dendritic cells (DCs), PPARG activation has an effect on their differentiation and maturation. Activation of PPARG during DC differentiation changes the expression pattern of cell surface receptors of DCs, including down-regulation of CD1A1 and CD80 expression and up-regulation of CD86 expression. Challenging those cells with lipopolysaccharides (LPS) resulted in reduced cytokine production including IL10, IL12 and IL15, suggesting PPARG activation inhibits DC maturation [156]. Furthermore, PPARG in DCs modulates the
T-helper1/T-helper2 (Th1/Th2) balance via regulating the production of cytokine and chemokine in DCs. Activation of PPARG in immature human monocyte-derived dendritic cells resulted in a dramatic decrease of IL12 secretion, a Th1 promoting cytokine, after stimulated the cells with LPS. In addition, PPARG also reduced the secretion of C-X-C Motif Chemokine Ligand 10 (CXCL10) and C-C Motif Chemokine Ligand 5 (CCL5) from DCs, both of which are involved in the Th1 cell recruitment [157].
Placenta
PPARG is required for placental development. Deficiency of PPARG leads to embryonic death at E10.5 due to placental abnormalities, including small labyrinth, decreased number of spongiotrophoblasts, and expanded giant cell layers [138], [144]. Further studies demonstrated that PPARG contributes to both maintenance of undifferentiatied trophoblast and differentiation towards the labyrinthine lineages. Knockout of Pparg in trophoblast stem (TS) cells resulted in reduced proliferation of TS cells and premature differentiation towards trophoblast giant cells at the expense of synctiotrophoblasts [158]. Direct targets of placental PPARG include Muc1, which is critical in forming protective mucous barriers on epithelial surfaces, and Cgb5, a subunit in the chorionic gonadotropin hormone that is essential for sustaining pregenency [159].
Epithelium
Increasing amount of data imply that PPARG promotes cellular differentiation and regulates inflammatory responses of several epithelia.
In the lung, ablation of Pparg specifically in the airway epithelium led to insufficient lung maturation and abnormal lung structure and physiology [160]. Further challenging the Pparg-deleted lung with chronic cigarette smoke resulted in excessive macrophage accumulation in the lung and elevated levels of chemokines, including CCL5, CXCL10 and CXCL15, which in turn increased the susceptibility to emphysema [161]. In accordance with this result, another study reported that treating human lung epithelial cells with PPARG agonists decreased the expression of cytokine-induced inflammatory mediators [162].
In the gut, PPARG collaborates with Hic-5 to promote terminal specialization of intestinal epithelial cells [163]. Ablation of Pparg in the colon epithelium in vivo results in increased susceptibility to inflammatory bowel disease [164]. In contrast, treatment of PPARG agonists prior to intestinal ischemia-reperfusion reduced injury by downregulating TNF and ICAM1 expression and reducing neutrophil infiltration [165], [166]. Similarly, in Caco-2 cells, a human colon cancer cell line, it has been shown that PPARG attenuates inflammation through antagonizing the function of NF-kB, a pro-inflammatory transcription factor, by exporting the RELA subunit of NF-kB complex from the nucleaus to cytoplasm [124].
1.4.3 PPARG in the urothelium
PPARG expression can be detected as early as embryonic day 13.5 in mice and has been suggested to promote the differentiation of the urogenital sinus into mature urothelium [167].
The Southgate group has studied PPARG functions in normal human urothelial (NHU) cell from the ureters for years using PPARG agonists and antagonists [64], [67], [168]–[170]. They found that treating cultured NHU cells with a PPARG agonist in combination with an EGFR inhibitor reverses squamous metaplasia and promotes urothelial differentiation [64], [67]. In this in vitro system, PPARG activation induces uroplakin expression through intermediary transcriptional regulators such as forkhead box A1 (FOXA1) and interferon regulatory factor-1 (IRF-1). Potential FOXA1 and IRF-1 binding sites have been identified in the promoter regions of UPK1A, 1B, 2 and 3A, and knocking down FOXA1 and IRF-1 abolishes PPARG agonist induced urothelial differentiation [170]. Moreover, PPARG and EGFR pathways have been implicated in the regulation of tight junction formation in NHU cells, another integral part of urothelial differentiation. Activating PPARG and blocking EGFR shift the cells from expressing a proliferation-associated profile of claudin to a more differentiation-associated profile including claudin 3, 4 and 5 [169].
Gene expression profiling of bladder cancer samples revealed that PPARG is involved in the development of bladder cancer, but its function still remains unclear. Since PPARG
activation can promote urothelial differentiation, it is not surprising that early research showed that PPARG agonist treatment led to tumor growth arrest in several bladder cancer cell lines, and that PPARG expression level is inversely correlated to the stage and grade of bladder cancer [171]–[175]. However, PPARG has also been implicated in promoting bladder tumorigenesis in other studies. Thiazolidinediones or TZDs, which are synthetic agonists for PPARG, were used for treating patients with type 2 diabetes but have been withdrawn from the market by several countries due to an increased risk of bladder cancer [174]. Several PPARG and dual PPARA/G agonists were listed as having carcinogenic activities in the bladder of rats [176]. Genetic
analysis of bladder cancer cells revealed a significant increase in PPARG gene copy number, which is positively correlated to cancer cell migration and invasive ability [177], [178].
Whole-genome analyses of muscle-invasive bladder cancer (MIBC) in recent years revealed its heterogeneous nature. MIBC could be roughly grouped into luminal and basal subtypes. Luminal subtype expresses high level of UPK, KRT20 and other low molecular weight keratins that are enriched in umbrella cells, has elevated FGFR3 activation via copy number gain or translocation which results in a FGF3-TACC3 fusion protein, and is enriched with papillary morphology. Basal subtype highly expresses high molecular weight keratins including KRT5, KRT6A, KRT6B and KRT14, which are more abundant in basal cells, and is enriched with
squamous features. Intriguingly, PPARG expression is elevated in luminal tumors, of which over 15% also has an increase in PPARG gene copy number, whereas PPARG expression is
significantly downregulated in basal tumors [179]–[183]. The discovery of intrinsic
heterogeneity of bladder cancer serves as a starting point to reconcile the conflicting results from the past.
The function of PPARG in the luminal type of tumors has been further examined in vitro. Activating PPARG turned on other luminal transcriptional pathways, suggesting PPARG plays a central role in controlling luminal biomarker expression [181]. The exact contribution of PPARG in the basal subtype is less clear. Expression profiles showed that PPARG-regulated lipid
metabolic genes are significantly down-regulated in squamous cell carcinoma-like tumors and in vitro studies found deficiency of PPARG in combination of PTEN drove keratinizing squamous metaplasia[184], [185]. Moreover, low PPARG activity has been observed in claudin-low subtype of bladder tumors, where it has been implicated as the cause of unrestraint NF-kB activity, and in turn led to elevated levels of cytokine and chemokine [186].
1.5 Summary
The urothelium is severely understudied and our knowledge of its differentiation and maintenance lags far behind studies in other epithelium. Understanding the transcriptional network that regulates barrier formation in the bladder will provide insights for a variety of urinary diseases caused by a compromised barrier. Increased attention has been drawn to PPARG for its therapeutic potential for bladder cancer and other diseases. A deeper understanding of its actions in the urothelium is required to further advance the development of PPARG agonists for therapeutic use while avoiding undesired side effects. The experiments in this study were designed to explore the function of PPARG in urothelial formation and regeneration in vivo, in an effort to further connect the transcriptional network in urothelial differentiation. By using novel mouse models, this study will also contribute to bridge the gap between in vitro studies and research of human patient samples.
Chapter 2
2.1 Mouse strains and genotyping
Experiments were performed according to protocols approved by the Institutional Animal Care and Use Committee of Columbia University. Mice were maintained under specified
pathogen-free conditions in a barrier facility and under a 12-hour light cycle. All mouse lines carried on a Swiss Webster background. ShhCre, Up2CreERT2 and mTmG mice were obtained from
the Jackson Laboratory. K5CreERT2 mice were obtained from D. Metzger and P. Chambon at the
IGBMC, France. Pparg floxed mice were generated in the Gonzalez laboratory (UCSD). All mouse lines used in this study are listed in Table 2.1.
Genotyping was done by PCR of the tail using a PCR Mastercycler pro (Eppendorf). Genotyping primers are listed in Table 2.2 and PCR programs used are listed in Table 2.3.
Table 2.1
Allele Name in text Source Ref
Shhtm1(EGFP/cre)Cjt/J ShhCre Jackson Laboratory
(stock #005622)
[187]
Tg(Upk2-icre/ERT2)1Ccc/J Upk2CreERT2 Jackson Laboratory
(stock #024768)
[188]
Tg(KRT5–cre/ERT2)2Ipc/JeldJ Krt5CreERT2 Daniel Metzger,
IGBMC,France
[189]
Pparg (tm1.1Gonz) Pparg Dr. Frank Gonzalez, UCSD [154] Gt(ROSA)26Sor
tm4(ACTBtdTomato,-EGFP)Luo/J
mTmG Jackson Laboratory (stock # 007576)
[190]
Table 2.2
Mouse line Primers Product length
ShhCre 5’-TGATGAGGTTCGCAAGAACC-3’ 400bp 5’-CCATGAGTGAACGAACCTGG-3’ Up2CreERT2 5’- GCGGGAGTTCCAGAAAGA G-3’ WT band: 338bp 5’-AGGACAGCCAGCAGAATCAG-3’
5’- GCGGGAGTTCCAGAAAGA G-3’ Mut band: 600bp
5’-AGATC CCTGTGCAGCATG-3’ K5CreERT2 5’-ATTTGCCTGCATTACCGGTC-3’ 350bp 5’- ATCAACGTTTTGTTTTCGGA-3’ Pparg 5’-CTCCAATGTTCTCAAACTTAC-3’ WT band: 250bp Flox band: 285bp 5’- GATGAGTCATGTAAGTTGACC-3’ mTmG 5’- CTCTGCTGCCTCCTGGCTTCT-3’ WT band: 250bp 5’- CGAGGCGGATCACAAGCAATA-3’ 5’- CTCTGCTGCCTCCTGGCTTCT-3’ Mut band: 250bp 5’-TCAATGGGCGGGGGTCGTT-3’
Table 2.3
Step 1 Step 2 Step 3 Step 4 Step 5 Step 6
ShhCre 95℃ 94℃ 60℃ 72℃ Repeat step 2-4 for 40 cycles 72℃
5min 30s 30s 45s 7min
Up2CreERT2 94℃ 94℃ 65℃ 68℃ Repeat step 2-4 for 10 cycles 94℃
2min 20s 15s 10s 15s
K5CreERT2 94℃ 94℃ 55℃ 72℃ Repeat step 2-4 for 35 cycles 72℃
5min 30s 30s 30s 7min
Pparg 94℃ 94℃ 60℃ 72℃ Repeat step 2-4 for 40 cycles 72℃
6min 1min 30s 30s 7min
mTmG 94℃ 94℃ 58℃ 72℃ Repeat step 2-4 for 35 cycles 72℃
3min 30s 1min 1min 2min
Table 2.3 PCR programs for genotyping
2.2 Histological and immunofluorescence analysis
Bladders were dissected in PBS then fixed in either 4% paraformaldehyde (PFA) or zinc fixative overnight at 4℃ on a horizontal shaker. Following fixation, bladders were transferred to 70% ethanol and stored at 4℃ until paraffin embedding. Paraffin blocks were sectioned at 5um thickness using RM2125 RTS Microtome (Leica), then dried on a slide warmer (Fisher
Scientific) overnight or in 37℃ incubator for several days. Sections were stained with Hematoxylin and Eosin (H&E) for histology analysis.
For immunofluorescence staining, slides were deparaffinized in histoclear for 10min twice, then dehydrated by washing 10min in 100% ethanol twice, 10min in 95% ethanol twice, then 10min in running water. For antigen retrieval, depending on the antibody used, one of the following methods was performed: 1) boiling the slide in PH6 buffer for 30min, 2) boiling the slides in PH9 buffer for 15min, 3) treating the section with 0.1ug/ml proteinase K solution for 1min followed by boiling in PH6 or PH9 buffer for 10min, 4) treating the section with 0.1% trypsin for 1min followed by boiling in PH6 or PH9 buffer for 10min. After boiling, slides were cooled for around 40min before transferred to 1xPBS/0.3% Triton X-100 for 20min to
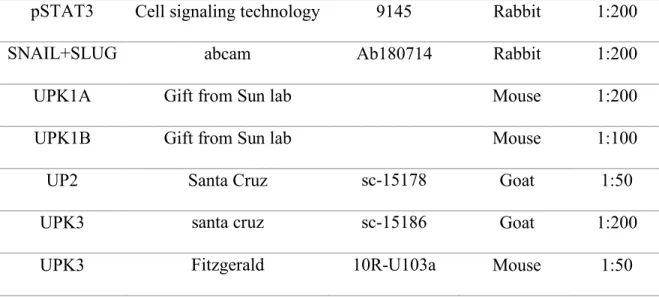
permeabilize the tissue. Then slides were incubated in 10% horse serum in 1xPBS/0.3% Triton X-100 for 1 hour. Primary antibodies were diluted in 1xPBS/0.3% Triton X-100 with 1% horse serum as specified in Table 2.4. 150ul primary antibody cocktail was applied to each slide. The slides were incubated overnight in dark moisture chamber at 4℃. The following day, excessive primary antibodies were washed out by washing the slides 10min in 1xPBS for three times. Secondary antibodies (Jackson Immunoresearch) were diluted 1:700 in 1xPBS/0.3% Triton X-100 with DAPI. 150ul secondary antibody cocktail was applied to each slide and left on for 30-120 min at room temperature. Excessive secondary antibodies were washed out by washing the slides 10min in 1xPBS for three times. Then sections were mounted and imaged using Zeiss Axiovert 200M with Apotome.
Table 2.4
Antigen Supplier Cat# Host species Dilution
α-SMA Sigma C6198 Mouse 1:300
CD19 eBioscience 14-0194-80 Rat 1:100
CD45 BDsciences 550539 Rat 1:50
E-Cadherin R&D system AF748 Goat 1:400
E.coli USBiological E3500-10 Rabbit 1:300
F4-80 ebioscience 14-4801-82 Rat 1:100
GRHL3 Aviva ARP33196 Rabbit 1:100
KRT1 abcam Ab24643 Rabbit 1:200
KRT5 Biolegend 905901 Chick 1:500
KRT5 Biolegend 905501 Rabbit 1:500
KRT10 Santa cruz Sc-53252 Mouse 1:500
KRT13 LSBio LS-B10431 Rabbit 1:400
KRT14 BioGenex MU146-5UC Mouse 1:50
KRT14 Biolegend 906001 Chick 1:500
KRT14 Biolegend 905301 Rabbit 1:300
KRT20 Dako M7019 Mouse 1:200
Ki67 abcam Ab15580 Rabbit 1:200
Laminin Sigma L9393 Rabbit 1:100
NF-kB p65 abcam Ab19870 Rabbit 1:300
p63 GeneTex GTX102425 Rabbit 1:400
p63 R&D system AF1916 Goat 1:200
PPARG Santa cruz sc-7273 Mouse 1:100
pSTAT3 Cell signaling technology 9145 Rabbit 1:200
SNAIL+SLUG abcam Ab180714 Rabbit 1:200
UPK1A Gift from Sun lab Mouse 1:200
UPK1B Gift from Sun lab Mouse 1:100
UP2 Santa Cruz sc-15178 Goat 1:50
UPK3 santa cruz sc-15186 Goat 1:200
UPK3 Fitzgerald 10R-U103a Mouse 1:50
Table 2.4 Primary antibodies used in this study
2.3 Transmission electron microscopy
Bladders were dissected in 0.1M Phosphate Buffer (PB) then fixed in 4% glutaraldehyde overnight at 4℃ on a horizontal shaker. The following day, bladders were washed in PB
thoroughly then transferred to 1% osmium tetroxide. After the tissue turned black, the bladders were dehydrated through increasing concentrations of ethanol (from 70% to 100%). Then the bladders were incubated in propylene oxide (PO) for 15min. The bladders were transferred to PO:Epon 1:1 mixture and left overnight at room temperature to allow PO evaporate. The Epon was replaced daily for the following two days. Then the bladders were placed into BEEM™ capsules and filled with fresh Epon. The samples were incubated at 60℃ for 3 days to harden. Then the blocks were sectioned and imaged by transmission electron microscopy.
2.4 RNA-seq
Bladders were dissected in OPTI-MEM media, cut open from the neck to the dome, then transferred to 20mM EDTA solution in PBS and incubated for 20min to loosen the urothelium
from the stroma. Bladders were transferred to fresh OPTI-MEM media and the urothelium were manually scrapped off from the stroma. The media containing urothelial cell patches was collected and spinned down at 500 xg for 5min at 4℃ (Eppendorf Centrifuge 5417C). The supernatant was discarded and the pellet was processed for total RNA extraction.
Only samples having a total amount more than 100ng and a RIN>8 were used for RNA-seq. mRNA were enriched using poly-A pull-down before proceed for library preparation using Illumina TruSeq RNA prep kit. Libraries were then sequenced using Illumina
HiSeq2500/HiSeq4000 at Columbia Genome Center. 30 million of single-end 100bp reads were acquired per sample.
Sequencing data were processed by RTA (Illumina) for base calling and bcl2fastq2 (version 2.17) for converting BCL to fastq format, coupled with adaptor trimming. Then the reads were mapped to Mouse: UCSC/mm10 as reference genome using STAR(2.5.2b) and featureCounts(v1.5.0-p3). Differentially expressed genes were identified using DEseq, an R package based on a negative binomial distribution that models the number reads from RNA-seq experiments and test for differential expression.
Differentially expressed genes were filtered by average expression level (FPKM) greater than 10, differential expression greater than 2 fold, and adjusted p-value less than 0.05 by Benjamini-Hochberg multiple testing correction. GO categories were obtained with q-value less than 0.05 by Benjamini-Hochberg multiple testing correction.
2.5 Dye-retention assay
Female adult mice were induced voiding to empty their bladders before anaesthetized using isoflurane. Then the animals were catheterized using a PE10 tube to instill 200ul of 0.1%
methylene blue in 0.9% NaCl [49]. The animals were maintained under anesthesia for 20min before sacrifice. The bladders were harvested and washed extensively in 0.9% NaCl solution. Bladders with mechanical damage to the lining were excluded. The retained dye in the bladders was extracted by 1ml chloroform per sample at 50℃ overnight, and its concentration was measured at OD 660 nm.
2.6 Tamoxifen administration
For Up2CreERT2; Ppargfl/fl line, adult mice (> 8 weeks old) were injected with 5mg
tamoxifen intraperitoneally three times over a period of 7 days. For K5CreERT2; Ppargfl/fl line,
neonatal pups were injected with 0.7mg tamoxifen subcutaneously at postnatal day 2.
2.7 Bacterial culture and experimental bladder infection
UTI89, a type 1-fimbriated uropathogenic E. coli (T1F-UPEC) isolate from an acute cystitis patient [80], was used in all the experiment. The bacteria were prepared fresh for each experiment from frozen glycerol stock. A small aliquot of inoculum was picked up by dipping a sterile inoculating loop into the frozen glycerol stock and then streak out on a LB agar plate for overnight culture at 37℃. A single colony was picked and grown in 10ml LB broth at 37℃ statically. The following day, 50ul of the culture was inoculated into 50ml fresh LB broth and grown statically for at least 18hr to facilitate fimbriation. Bacteria were pelleted by centrifuging (Eppendorf Centrifuge 5810R) at 3000rpm for 15min and then re-suspended in PBS. The concentration of the bacteria was measured by OD600 and adjusted to 108 cfu/ml.
Eight to fourteen-week-old female mice were induced voiding before anesthetized using isoflurane. 100ul of the bacteria suspension (total 107 cfu) were inoculated into the bladder by
transurethral catheterization. The animals were maintained under anesthesia for 7min to avoid immediate voiding. To label proliferating cells, EdU was dissolved in PBS to a final
concentration of 1mg/ml, and 150ul of the EdU solution was administered through intraperitoneal injection (i.p.) 23hr post inoculation. Antibiotics (Sulfamethoxazole and Trimethoprim) were given to the mice in the drinking water starting 30hr post inoculation to make sure the infection was cleared.
To assess the extent of bladder infections, urine was collected from the animals 12hr, 24hr and 4 weeks post inoculation. 10ul urine was serially diluted and plated on LB agar plates for enumeration of colony formation unites. The rest of urine was used for cytospin followed by Hema3 staining to visualize urine sediment.
2.8 Immune cell isolation and fluorescence activated cell sorting (FACS)
Immune cells were isolated from whole blood and from the spleens. Blood samples were collected via cardiac puncture, then spleens were excised and mechanically disrupted before passing through a 100um cell strainer. Red blood cells are lysed by adding ACK lysis buffer and incubating at room temperature for 5min. Then immune cells were collected by spinning down at 300xg for 5min (Eppendorf Centrifuge 5417C). Single cell suspension was obtained by
re-suspending the pellet in 300ul FACS buffer then passing through a 35um filter. Cells were sorted on a BD Aria II Cell sorter using 30 psi pressure and 100um nozzle aperture. Around 1000 sorted cells were plated into a well of 96-well plate and imaged using Zeiss Axiovert 200M.
2.9 Quantification and statistical analysis
For all graphs, data were collected from at least 3 mice per group. For each sample, 5um FFPE sections were collected every 50um to represent different part of the bladder. 8 sections were stained for quantification and at least 500 cells were counted per sample. Data were presented as the mean±s.d. Unpaired two-tailed Student's t-test was used to determine
significance between two groups, as indicated in the Results. P-values <0.05 were considered statistically significant.