Geosciences Theses Department of Geosciences
Summer 8-13-2019
Clay Mineralogy and Porosity Estimates of the
Lower Permian Wolfcamp Shale
Morgan Garner
Follow this and additional works at:https://scholarworks.gsu.edu/geosciences_theses
This Thesis is brought to you for free and open access by the Department of Geosciences at ScholarWorks @ Georgia State University. It has been accepted for inclusion in Geosciences Theses by an authorized administrator of ScholarWorks @ Georgia State University. For more information, please [email protected].
Recommended Citation
Garner, Morgan, "Clay Mineralogy and Porosity Estimates of the Lower Permian Wolfcamp Shale." Thesis, Georgia State University, 2019.
by
MORGAN KENNEDY GARNER
Under the Direction of W. CRAWFORD ELLIOTT, Ph.D.
ABSTRACT
Diagenetic controls (pressure, temperature, and time) altered petrophysical properties in black
shale petroleum source rocks. Several samples of the lower Permian Wolfcamp Shale, a prominent
tight gas oil play from the mid-continent US, were collected from a range of thermal maturity
values (0.8-1.07% VRo) to test this hypothesized relation among the formation of diagenetic illite,
over-pressuring, and porosity generation. Microporosity was observed between clay aggregates,
organic material, and cementing materials. Moldic porosity was seen within POM. Microporosity
measured 5.5% for the most thermally mature sample and 7.1% for the least mature sample. Based
on preliminary measurements on partially reduced small angle scattering data (SAXS), packets of
particles 30 Å, consistent with fundamental particles were visible. These preliminary results
suggest that both micro- and possibly nano-porosity decreased with thermal maturity. Lithification,
diagenetic mineral formation/pore fill, as well as organic matter migration have been attributed to
disaggregating porosity at increased thermal maturities.
INDEX WORDS: Diagenesis, Shale, Thermal maturity, Illitization, Porosity, Clay mineralogy,
by
MORGAN KENNEDY GARNER
A Thesis Submitted in Partial Fulfillment of the Requirements for the Degree of
Master of Science
in the College of Arts and Sciences
Georgia State University
Copyright by
by
Morgan Kennedy Garner
Committee Chair: W. Crawford Elliott
Committee: Brian K. Meyer
Hassan A. Babaie
Electronic Version Approved:
Office of Graduate Studies
College of Arts and Sciences
Georgia State University
DEDICATION
I want to dedicate this scientific achievement to the best landlord I could ever have. Thank you to
my Sissy Bird for creating such a warm, supportive, and loving environment. This document
would not be possible without that yellow house on Berkeley Road. I will never forget those
wonderful two years spent together. You inspire me every day to be a better person.
This thesis is also dedicated to my mama, Suzianne Garner. Thank you for teaching me to dance
in the rain even when I forget my umbrella. I can never thank you enough for inspiring my love
of sciences. You taught me to care for things that are bigger than myself. You are my hero.
Thank you to my mini mojo, my beautiful sister. I am so proud to be your big sis. If I could write
this thesis, you accomplish anything… starting with cleaning your room. Thank you to my (not
so) baby brother for teaching me patience and unconditional love. A special thank you to my dad
for reminding me not to sweat the small things and all the other tidbits of life advice hidden
underneath an off-key singing voice. The last thank you is for the other Christopher in my life. I
now see life in hues of yellow, purple, and orange I never saw before. Our pack has nestled into a
place in my heart I never knew existed. Cheers to the next adventure, may it contain many more
ACKNOWLEDGEMENTS
This thesis would not be possible without the support of Georgia State University, Geosciences
Department. Geosciences provided a teaching assistantship and stipend for the duration of this
study. This research used resources of the Advanced Photon Source, a U.S. Department of Energy
(DOE) Office of Science User Facility operated for the DOE Office of Science by Argonne
National Laboratory under Contract No. DE-AC02-6CH11357. Lawrence Anovitz, Jan Ilavsky
provided commentary and advice when needed which was appreciated. The Panalytical Xpert Pro
X-ray diffractometer was purchased with funds from NSF to D.M. Deocampo and W.C. Elliott
(NSF Award 1029020). Thanks to Richard Whittington and Mark Longman from QEP, and Prof.
R. Douglas Elmore (Oklahoma University) for providing these samples. Thank you to Katie
Garrett for being extremely helpful and insightful with all FE-SEM measurements. Thank you to
Dr. Elmore for all your help and allowing me to borrow one of your brilliant graduate students.
Thanks to John Tougas for always coming to the rescue for the many technical difficulties.
A giant thank you to my committee for being instrumental in my undergraduate and
graduate success. Dr. Meyer and Dr. Babaie are both uniquely brilliant and I will always cherish
all of our thoughtful conversations. The knowledge and skills taught to me by my advisor, Dr.
Elliott, are absolutely priceless. Thank you for your patience, your unwavering support, and cat
TABLE OF CONTENTS
ACKNOWLEDGEMENTS ... V
LIST OF TABLES ... IX
LIST OF FIGURES ... X
LIST OF ABBREVIATIONS ... XV
1 INTRODUCTION ... 1
1.1 Focus of Study... 1
1.2 Geologic History ... 3
1.3 Lithology of Wolfcamp Shale ... 7
1.4 Diagenetic Features ... 10
1.4.1 Smectite... 13
1.4.2 Illite ... 14
1.4.3 Kinetics ... 17
1.4.4 Illite and Petroleum ... 18
1.5 Thermal Maturity Estimates of the Wolfcamp Shale ... 19
1.6 Effects of Thermal Maturity on Porosity ... 22
2 METHODS ... 28
2.1 Sample Preparation... 29
2.1.1 Sample Pretreatment ... 31
2.3 X-ray Diffraction ... 33
2.4 Porosity Determination ... 35
2.5 SEM Imaging ... 41
3 RESULTS ... 45
3.1 Clay Fraction Mineralogy ... 45
3.2 Porosity Measurements... 49
3.3 FE SEM Examination ... 56
4 DISCUSSION ... 67
4.1 Mineralogy Comparisons ... 67
4.2 Porosity ... 69
4.2.1 Microporosity ... 69
4.3 Limitations of Data... 73
5 CONCLUSION ... 77
REFERENCES ... 79
APPENDICES ... 88
Appendix A: XRD Pattern Key... 88
Appendix B: Air Dry, Ethylene Glycol Solvated and Heated Sample Patterns .... 88
Appendix C: Combined SAXS and USAXS Curves ... 88
Appendix D: FE SEM Images ... 88
Below is the XRD pattern key used to label these samples... 89
Appendix B... 91
Air gry, ethylene glycol solvated and heated sample patterns are shown below. .. 91
Appendix C ... 99
All scattering curves created by Igor are shown below. These curves were created
with combines SAXS and USAXS data. Each sample has two corresponding
patterns. ... 99
LIST OF TABLES
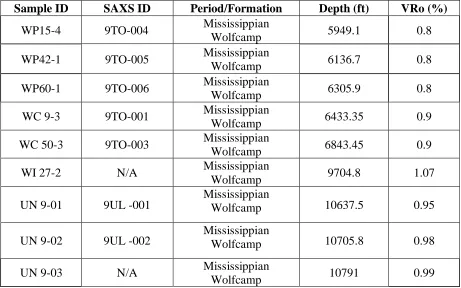
Table 1: In this sample ID depth, geologic formation, and thermal maturity are shown. ... 31
Table 2: Observed mineralsfound in the clay fractions. N/A not enough for XRD analysis.
... 46
Table 3: Each thin section provided various scattering curves. Each curve was compared
and averaged. This table represents the observed pore sizes seen via SAXS experiments. ‘B’
denotes broad peaks. ... 50
Table 4: Representatives of the average observed porosity at each sample site with three
different machine magnifications. *Insufficient sample size refer to the discussion section.
... 58
Table 5: Porosity estimates created by Fiji software (Schindelin et al., 2012). ... 64
LIST OF FIGURES
Figure 1: Map adapted from USGS National and Global Petroleum Assessment. This
figure shows the location of the midland basin and the extent of the Wolfcamp Shale. ... 5
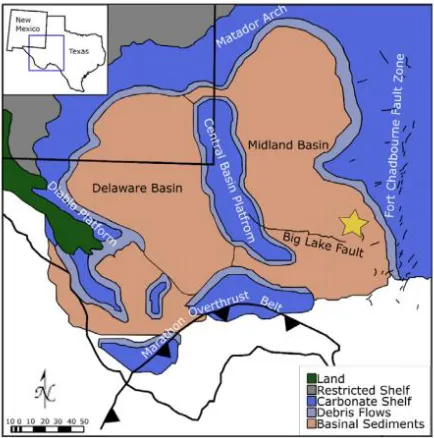
Figure 2: Map adapted from Wickard (2016) to show the Permian basin and surrounding
structural provinces. The star approximates the location of samples collected. Base map
modified from Stoudt (1998) and structural map modified from Ewing (1990). ... 6
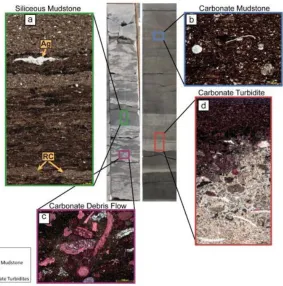
Figure 3: This figure adapted by Wickard et al. (2016) provided an in-depth description of
the core and facies of the Wolfcamp Shale. The four main facies can be seen to the right
and left of the core. This paragenetic sequence provides evidence of the spatial
relationships of each facies. ... 8
Figure 4 (left): This image adapted from Roberts and Elmore (2018) showed the
appearance of hydrocarbons, albite and dolomite within the Woodford shale under cross
polarized light. Figure 5 (right): This X-ray computer tomography (XRCT) image was
adapted from Roberts (2018) to demonstrate the pathway(s) of hydrothermal fluids (bright
red) within brine-filled veins (darker red). These images were taken of Woodford shale
samples but can be readily applicable to other mid-continental black shales, such as the
Wolfcamp Shale. ... 9
Figure 6: Two FE SEM images adapted from Roberts and Elmore (2018) showing
high-resolution imagery of porosity. This image depicts porosity between pyrite framboids.
Figure 7: FE SEM images with porosity shown between clay sheets. ... 11
Figure 8: SEM images adapted from Wickard et al., (2016) to show intercrystalline and
moldic porosity present in dolomitized intervals. This image was taken under
Figure 9: This figure is adapted from Moore and Reynolds (1997). This schematic diagram
shows the internal crystal structure of the expandable phyllosilicate mineral, smectite. .... 14
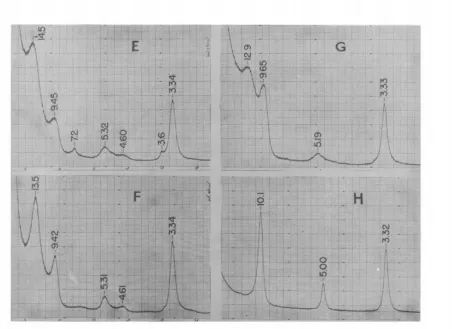
Figure 10: Ethylene glycol diffraction patterns adapted from Reynolds and Hower (1970).
The diffraction patterns show to conversion of interlayered I-S 70% (E) to end member
illite (H). ... 17
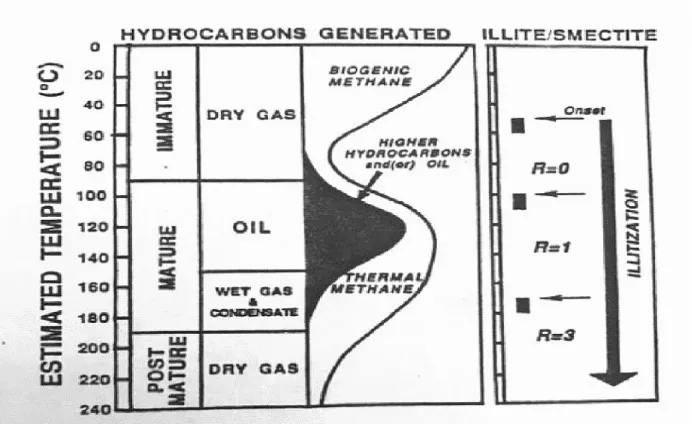
Figure 11: This table was adapted from Pollastro (1993). It is shown that the time and
temperature needed to created natural gas coincides with increasing illitization. ... 19
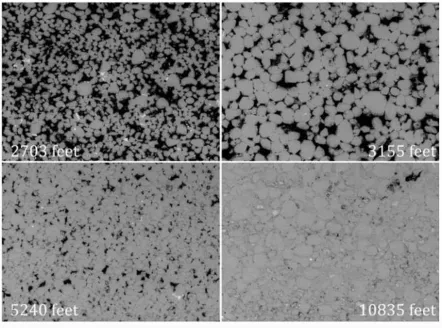
Figure 12: BSE images from Anovtiz et al. (2017) demonstrating the effect of cementation
and decrease in porosity with depth with the St. Peters sandstone. ... 26
Figure 13: The heterogenous nature of shales was apparent during sample preparation. .. 32
Figure 14: The approximate location of SAXS measurements is shown in this image.
Measurements were taken between the two pieces of metal tape. ... 37
Figure 15: Desmearing control panel found in Irena plug in for Igor. Each sample was
desmeared until all errors nromalized to 0.0.... 38
Figure 16: Corresponding USAXS and SAXS datasets were merged using the 'data
merging panel'. ... 39
Figure 17: This is the command panel seen in Igor in the size distribution function. The
values entered were consistent for every sample run except for the occasional variation in
the 'flat background'. This value varied based on the dataset, ranged from 0.9-0.17. ... 40
Figure 18: A FESEM image with manually traced pore data. The top number indicates the
length (in nm) of the La. The second number (in degrees) indicates the amount the line is
Figure 19: A FESEM image of 9TO-04 highlighted by the threshold feature in Fiji (Rueden
et al., 2017). The pore spaces were highlighted and then the bulk pore area was calculated.
... 44
Figure 20: The combined air dried diffraction patterns of all samples at the 1-2 um scale. 47
Figure 21:The combined air dried diffraction patterns of all samples at the 0.25-1 μm scale.
... 48
Figure 22: The combined air dried diffraction patterns of all samples at the 0.25 µm scale.
... 49
Figure 23: SAXS data processed using Igor with the Irena plugin. This processed data
created size distribution curve where intensity versus scattering sizes (Q) for sample 9TO-1
(9TO1_x_29_y25_R_0742) was plotted. Large volumes of pores are seen at 37 Å, 40 Å, 60 Å
and 90 Å. The green line indicates the measured data. The fitted curve is drawn with red
error bars and filled in with green and red vertical stripes. The horizontal dashed red line
indicates the background (Anovitz et al., 2017). WAXS diffraction peak can be seen on the
right in green. ... 51
Figure 24: SAXS data processed using Igor with the Irena plugin created size distribution
curve where intensity versus scattering sizes (Q) for sample 9TO3
(9TO3_x_1_y52_R_0766) was plotted. Large volumes of pores are seen at 35 Å, 60 Å, and
90 Å. The green line indicates the measured data. The fitted curve is drawn with red error
bars and filled in with green and red vertical stripes. The horizontal dashed red line
indicates the background (Anovitz et al., 2017). WAXS diffraction peak can be seen on the
Figure 25: SAXS data processed using Igor with the Irena plugin created size distribution
curve where intensity versus scattering sizes (Q) for sample 9TO4 (9TO4_x0_y41_R_0748)
was plotted. Large volumes of pores were seen at 25 Å, 40 Å, 65 Å, and 150 Å. The green
line indicates the measured data. The fitted curve is drawn with red error bars and filled in
with green and red vertical stripes. The horizontal dashed red line indicates the
background (Anovitz et al., 2017). WAXS diffraction peak can be seen on the right in
green. ... 53
Figure 26: SAXS data processed using Igor with the Irena plugin showing the intensity
versus scattering sizes (Q) for sample 9UL (9UL_x62_y0_0727) was plotted. Large volumes
of pores are seen as 45 Å, 75 Å, 100 Å, and 180 Å. The green line indicates the measured
data. The fitted curve is drawn with red error bars and filled in with green and red vertical
stripes. The horizontal dashed red line indicates the background (Anovitz et al., 2017).
WAXS diffraction peak can be seen on the right in green. ... 54
Figure 27: SAXS data processed using Igor with the Irena plugin showing intensity versus
scattering sizes (Q) for sample 9TO5 (9TO5_x3_y28_R_0220) was plotted. Large volumes
of pores are seen at 25 Å, 50 Å, 85 Å, and 120 Å. The green line indicates the measured
data. The fitted curve is drawn with red error bars and filled in with green and red vertical
stripes. The horizontal dashed red line indicates the background (Anovitz et al., 2017).
WAXS diffraction peak can be seen on the right in green. ... 55
Figure 28: This curve has shown volume distribution plotted versus scattering particles (in
angstrom) for sample 9TO1 (9TO1_x_29_y52_R_0738).The green curve shows where the
large volumes of pore sizes are. The blue curve shows where the majority of the surface
Figure 29: This is a FE SEM photo of sample 9TO-1 taken as 50X machine magnification.
The largest pores were categorized as intraparticle. This large pore can be seen between a
detrital grain and clay aggregates. ... 57
Figure 30: FE SEM image of 9TO-01 depicting diagenetic (1Md) from a detrital (2M1)
grain. ... 59
Figure 31: This is an FE SEM image of sample 9TO-04. The red arrow shows the growth of
diagenetic clay sheets. These sheets have grown perpendicular to the clay matrix fabric.
This image shows phyllosilicates growing around and into pre-existing pore spaces. ... 60
Figure 32: EDS provided the chemical composition confirming the dominant phyllosilicate
as illite. This spectrum shows the presence of Si, Al, K and lesser amounts of Ca, Na and
Fe. That elemental analysis is consistent with the presence of illite phyllosilicates. ... 61
Figure 33: Sponge-like pores observed with FE SEM. ... 62
Figure 34: Authigenic pore fill with hexagonal crystal shape quartz and clay laths captured
with SEM. ... 63
Figure 36: This histogram shows the distribution of pore areas of FE SEM images (50X). 65
Figure 37: SAXS curve showing the approximate location of pores seen via FE SEM
analysis. (Sample ID: 9TO1_x_29_y52_R_0738). ... 66
Figure 38: FE SEM image of 9UL at 2.8X magnification. This shows the estimates length of
organic macerals within these shales. Length was drawn with Fiji (Schindelinet al., 2012).
... 71
LIST OF ABBREVIATIONS
Å Ångstrom
Ar argon
CaCl calcium chloride
CBD sodium citrate, dosium bicarbonate, and sodium dithionate
Cm Centimeter
⁰C degree Celsius
DI deionized
EG ethylene glycol
G gram
> greater than
I-S illite-smectite
I illite
K potassium
K-Ar potassium-argon
km kilometer
< less than
Ma million years
m meter
mm millimeter
ml milliliter
mg milligram
µm micrometer
M molarity
Na sodium
NaOAc sodium acetate
NaAc-HAc sodium acetate-acetic acid buffer
O Oxygen
OM organic matter
% percent
RPM rotations per minute
R Reichweite
S smectite
SST solid state transformation
TOC total organic carbon
TTI Time Temperature Index
Θ theta
VRo Vitrinite Reflectance
λ wavelength of X-rays (Ångstrom)
1 INTRODUCTION
1.1 Focus of Study
Advances in unconventional drilling techniques, i.e., shale hydraulic fracturing and
horizontal drilling, have increased the productivity and the secondary recovery of crude oil and
natural gas from formerly inaccessible fine-grained source rocks. Black shales in the eastern and
midwestern United States (US), in particular, have been targeted for promising untapped natural
gas exploration via horizontal drilling and hydrofracturing. The Lower Permian Wolfcamp Shale
has become a significant site of hydrocarbon exploration in the US due to hydrofracturing and
related secondary recovery of crude oil and natural gas. The US Geological Survey assessed
technically recoverable mean resources of 20 billion barrels of oil and 16 trillion cubic feet of gas
in the Wolfcamp Shale in the Midland Basin, the largest estimate of continuous oil that USGS has
ever assessed in the United States (Gaswirth et al., 2016). All of the Wolfcamp shale is profitable
for oil and gas exploitation due to the predictable VRo content throughout the Permian Basin. The
Wolfcamp shale was chosen for its regional extent and stacked pay zones ideal for horizontal
drilling endeavors (Blomquist, 2016). This unit has been referred to as fine-grained ‘tight’ source
rock due to their low permeability, and low porosity (porosities ranging from 4-12%) which are
now viewed as reservoir rocks (Blomquist, 2016). The US has recently exported natural gas for
the first time in many decades. The exportationexploration of natural gas reflects the impact of the
use of hydraulic fracturing of Paleozoic black shale and related shale source rocks.
Geologic studies of black shales have become increasingly important due to our nation’s
domestic oil and gas production. The exploration of sedimentary basins has been guided by
knowledge of thermal maturity and by petrophysical features of both source and reservoir rocks.
indices (e.g., vitrinite reflectance, VRo) have provided useful information on the thermal maturity
of source rocks generating crude oil and natural gas. Clay mineral transformations (smectite to
illite) at diagenetic conditions have promoted over-pressuring among these shales in the Gulf Coast
(Magara, 1975; Burst, 1969; Bruce, 1984). Shale overpressure has led to the expulsion of crude
oil and natural gas from otherwise very tight source rocks to more porous and permeable reservoir
rocks. Overpressuring has also lead to the alteration of pore structures in these shales. New
secondary minerals precipitated in these newly developed pores (Roberts and Elmore, 2018). The
stacking order of illite layers in illite-smectite has been utilized in many studies as a
semi-quantitative geothermometer to study the thermal histories of sedimentary basins (Hower et al.,
1976; Pollastro, 1989; 1993). This semiquantitative thermometer is used in a way comparable to
vitrinite reflectance (VRo) and to time-temperature index (TTI) values (Waples, 1980). The age
of the illite-smectite as measured by K-Ar geochronology has been integrated with other index
values to understand further the thermal maturation of sedimentary basins, generation, and
trapping of hydrocarbons (Pevear, 1999). However, the role of mineral transformation
(illitization), and its role in the development of microporosity/fracturing and over-pressuring of
hydrocarbon source rocks requires further research.
Many issues arose in relating the thermal maturity to the creation and deformation of
porosity. While results have been concluded (Clarkston et al., 2013; Jin et al., 2013; Mastalerz et
al., 2013; Ruppert et al., 2013; Anovitz et al., 2015) none have yet correlated the amount, size, and
distribution and connectedness of pores to a timing of thermal maturation generating crude oil and
natural gas. Additional data are needed to understand the development of porosity and permeability
The Paleozoic basins in the mid-continent US are ideal locations for continued diagenetic
studies due to the range of mineralogy, thermal maturities, and existing wells within the region.
The focus of this study was to evaluate the petrophysical changes of black shale source rocks at
the nanometric scale. The measurement of nanoporosity by way of beam-line techniques is
relatively new (Anovitz et al., 2017). This research was conducted to assess the evolution and
connectedness of porosity within black shale source rocks at various thermal maturities. This
research goes beyond former works by examining micrometer (µm) and angstrom (Å) scales of
porosity. This comprehensive thesis will likely challenge previous knowledge of the formation of
petrophysical characteristics with progressive burial depth.
The ages of diagenetic events and authigenic mineral formation are vital in understanding
thermal histories of sedimentary basins. Multiscale pore structure evaluation is needed to describe
the porosity and its possible roles in hydrocarbon migration, diagenetic development, and overall
reservoir quality of US midcontinent black shales. This study intended to answer the following
questions (1) How do diagenetic controls (T, time) alter the reservoir quality of black shales? (2)
What pore networks are evident in this shale? (3) What is the development of nano and
micro-porosity in thermally mature systems?
1.2 Geologic History
Black shale samples were collected from Midland Basin (TX) for this study by Prof.
Elmore (Oklahoma University) and Richard Whittington, QEP Resources (Figure 1). This basin
has been actively explored for crude oil and vertical plays of shale gas since the 1950s
(Baumgardner et al., 2014). This unit is economically feasible to exploit due to its susceptibility
to brittle deformation and high TOC (Nygård et al., 2004; Wickard, 2016; Blomquist, 2016;
The US Energy Information Administration referred to this region as containing some of
the most profitable liquid-rich shale plays in North America (U.S. Energy Information
Administration, 2017). Extensive seismic and drilling data obtained during the exploration for US
midcontinent hydrocarbon resources have provided increased understanding of sedimentary basins
in context to the overall geology of the Texas region (e.g., Johnson and Cardott, 1992; Whittington,
2009). The stratigraphic development and basin geometry of midcontinent US Paleozoic basins,
such as the Midland, was influenced by depositional processes and uplift events. Areas of low
elevation, formed by regional tectonic activity, allowed for the accumulation of terrestrial and
marine sediments within the basin. Thick carbonates, turbidites, shales, sandstones were deposited
in during periods of prolonged crustal subsidence during the late Paleozoic Era. The combined
effects of tectonic activity and the overall climate of the region determined the nature of sediment,
the rate of sediment supply, total organic content (TOC), and vertical succession of different
sedimentary rocks. These depositional factors controlled the occurrence, thickness, and
composition of the Wolfcamp Shale. Structural and stratigraphic data provided useful information
Figure 1: Map adapted from USGS National and Global Petroleum Assessment. This figure shows the location of the midland basin and the extent of the Wolfcamp Shale.
The Greater Permian Basin was one of the largest sedimentary basins in the continental
US. This basin was located throughout west Texas and southeast New Mexico (Frenzel et al.,
tectonic uplift in this and other basins in the Midwest (Figure 2). This thrust belt was activated
during the assembly of the Pangea supercontinent (Sinclair, 2007). Movement along this thrust
belt caused tectonic uplift and the rotation of two hanging-wall fault blocks of the frontal Wichita
fault system at the southern margin of the Anadarko basin (Yang and Dorobeck, 1995). This
progression created the central basin platform that segmented the Greater Permian into three
sub-basins, Delaware, Central and the Midland Basin (Yang and Dorobeck, 1995). The cores of the
Wolfcamp Shale, whose shale samples were examined in this study, were drilled near the eastern
shelf of the Midland Basin. The region was bounded to the north by the Matador Arch. The Diablo
Platform and Pedernal Uplift were found directly west of this basin (Ball, 1995). A north trending
en echelon fault system, Fort Chadbourne fault zone, lies to the east and served as the eastern
[image:23.612.215.432.376.595.2]border of the basin (Ewing, 1990).
Figure 2: Map adapted from Wickard (2016) to show the Permian basin and surrounding structural provinces. The star approximates the location of samples collected. Base map modified from Stoudt (1998)
and structural map modified from Ewing (1990).
Rifting opened the proto Atlantic ocean during the late to Precambrian to Cambrian period
Cretaceous seaway, on the continental US from the late Cambrian to early Mississippian time
(Johnson, 1989). This broad shelf, which later was the site of the Cretaceous Western Interior
Seaway, experienced a long period of subsidence (Johnson, 1989). Shales, limestones, siltstones,
and sandstones were deposited as these basins experienced rapid subsidence (Denison et al., 1984;
Johnson, 1989). The late lower Permian deposits of an organic-rich mudstone, now known as the
Wolfcamp Shale, was deposited during these conditions (Frenzel et al., 1988).
1.3 Lithology of Wolfcamp Shale
The dominant grain size within this shale ranged from fine grained clays (< 5 μm) to fine
sand (< 75 µm). Sedimentation of mineral grains in this basin was controlled by rapid subsidence
and sea level fluctuations also associated with the initiation of the late Paleozoic icehouse (Brown,
1972; Montgomery, 1996; Mazzullo, 1997; Sarg et al., 1999; Golonka and Kiessling, 2002).
Post-rift subsidence influenced the stratigraphy and allowed for the accumulation and redistribution of
hemipelagic sediments throughout the midcontinental US region. Oceanic currents delivered
grains as suspended sediments. As the energy of currents deceased sedimentation occurred
allowing clay sized particles to flocculate (forming flocculants) within the water column and the
seafloor. Continental margin sediments (approx. >60%, clay minerals) were buried among marine
sources of organic carbon. The prevailing redox conditions showed that this epicontinental seaway
was euxinic (anoxic and sulfide-rich) allowing high preservation rates of organic matter (OM) and
sulfur (Connant and Swanson, 1961; Kirkland et al., 1992; Whittington, 2009). The bulk rock
volume is altered by effective stress that occurred during sediment loading. This change causes a
reduction in porosity and spaces between grain boundaries. The Wolfcamp Shale was lithified as
an organic-rich marine mudstone preserved within the Midland Basin. The predominant facies of
carbonate turbidites (Wickard et al., 2016). An in-depth look at the four dominant facies was
created by Wickard (2016) using images of core slabs and thin sections. This shale exhibited
heterogeneity in terms of its mineral composition and structural feature. However, the primary
constituents that make up an average shale are quartz, clays, carbonates, feldspars, albite, apatite,
pyrite and organic material was present throughout this shale. This formation has been classified
as a black to dark grey, fissile to blocky mudrock. The amount of TOC has been attributed to slow
[image:25.612.182.465.276.562.2]sedimentation rate and marine conditions (Kennedy et al., 2014).
Figure 3: This figure adapted by Wickard et al. (2016) provided an in-depth description of the core and facies of the Wolfcamp Shale. The four main facies can be seen to the right and left of the core. This
paragenetic sequence provides evidence of the spatial relationships of each facies.
In addition to the well-known suite of minerals in shales, hydrothermal minerals have been
shown in fractures through which hydrothermal fluids migrated (Wickard et al., 2016; Roberts and
petrographically in directions perpendicular to the bedding plane (Figure 4). Mineralized fractures
were abundant, contain hydrocarbons, calcite, and celestine-barite, and some contain porosity
within Paleozoic black shales (Figure 6) (Roberts and Elmore, 2018). These hydrothermal minerals
(assumed to be dolomite, quartz and pyrite) were formed by the infiltration of high salinity fluids
during diagenesis (Roberts and Elmore, 2018). Early diagenesis included precompactional veins
of ferrous minerals (Figure 5) as well as mineral precipitationprecipitation of calcite/phosphate
concretions, sphalerite, barite, quartz, dolomite, and ferroan dolomite. Horizontal and vertical
fractures were likely the result of overpressuring (Roberts and Elmore, 2018). The mineralized
fractures contained secondary porosity, dolomite, albite, chlorite, and quartz (along bedding)
perpendicular to fracture walls (Figure 5; Roberts and Elmore, 2018). The appearance of (detrital,
overgrowth) quartz, a mineral defined by its conchoidal fracture, increased the tendency of the
formation towards brittle deformation. This brittle behavior increases susceptibility to hydraulic
fracturing, a large factor influencing the viability of these shales (Nygård et al., 2004; Wickard et
al., 2016).
Figure 4 (left): This image adapted from Roberts and Elmore (2018) showed the appearance of hydrocarbons, albite and dolomite within the Woodford shale under cross polarized light. Figure 5 (right): This X-ray computer tomography (XRCT) image was adapted from Roberts (2018) to demonstrate the pathway(s) of hydrothermal fluids (bright red) within brine-filled veins (darker red). These images were taken of Woodford
The presence of hydrothermal minerals suggested that warm high salinity fluids migrated
throughout the Woodford, and assuming Wolfcamp, shale within fluid conduits sometime during
its burial history. Fluid inclusion analysis showed that mineralized fractures were conduits for
warm, high salinity brines that were observed to be externally derived (Wickard et al., 2016;
Roberts and Elmore, 2018). It was likely the conduits of fluid migration of hydrocarbons occluded
mesopores during middle to late diagenesis (Wickard et al., 2016; Roberts and Elmore, 2018).
Hydrothermal alterations started other diagenetic reactions during the middle to late diagenesis
(Wickard et al., 2016; Kennedy et al., 2014). Fracture and fluid inclusions caused complex
development of secondary pore systems within the organic and inorganic constituents. These
alterations and their distributions in the shale matrix affected the predictability of reservoir quality.
1.4 Diagenetic Features
The mechanical properties of black shales were directly influenced by the grain size,
sorting, and mineralogy. However, the original depositional texture was also altered by
mechanisms of diagenesis. Compaction, cementation, recrystallization, and neoformation occurred
in conjunction with diagenesis (Hester, 1992). The boundary conditions of this diagenetic process
are temperatures less than 200 °C and pressures between 1 and 1000 bar (Chapmin, 1983). These
mechanisms formed a range of diagenetic features within these boundary conditions.
This mudstone exhibited early, middle, and late diagenetic features such as pyrite
framboids, phosphatic concretions, calcareous concretions, and neoformation (Wickard et al,
2016; Roberts and Elmore, 2018). Structural features (such as porosity) were altered by the
intrusion of fluids (formation waters, connate brines or external fluids) (Wickard at al., 2016;
Secondary or diagenetic minerals precipitated from these fluids. Authigenic mineral precipitation
(chlorite, kaolinite, and dolomite) occurred through the segmentation of pore spaces reducing the
extent and connectedness of primary porosity.
Diagenesis influenced porosity, permeability, tendency to fracture, fluid-flow pathways,
and ultimately the capacity of a unit to maintain a sufficient amount of natural gas (Wickard et al.,
2016; Giles, 1997; Stroker et al., 2013). Through the use of scanning electron microscopy, Roberts
and Elmore (2018) observed the presence of meso-scale porosity in this Paleozoic black shale.
They captured images of meso- and microporosity that had occurred within pyrite framboids
(Figure 6), vugs in fractures and allochems, and between clay sheets (Figure 7). Similarly, in the
Wolfcamp Shale porosity was recorded to exist in pyrite framboids and between sheets of chlorite
(Wickard et al., 2016). Intercrystalline and moldic porosity is present in dolomitized intervals
(Figure 8). Overpressuring, hydrothermal alteration, and authigenic mineral formation destroyed
primary porosity during early diagenetic phases of these shales.
Figure 6: Two FE SEM images adapted from Roberts and Elmore (2018) showing high-resolution imagery of porosity. This image depicts porosity between pyrite framboids. Figure 7: FE
Figure 8: SEM images adapted from Wickard et al., (2016) to show intercrystalline and moldic porosity present in dolomitized intervals. This image was taken under cross-polarized light.
1.4.1 Illitization
It has been widely accepted that the progressive burial of argillaceous marine sediments
will prompt the formation of diagenetic illite from expandable smectite(Moore and Reynolds,
1997). Illitization has been used as a term to denote the growth of illite grains from smectite during
siliciclastic diagenesis. This reaction has been characterized by a number of distinct processes:
tetrahedral substitution of Al for Si in the tetrahedral sheet, dehydration (removal of water from
the smectite interlayer sites), collapse of layers after incorporation of K+ in the interlayer, and loss
of internal surface area (Equation 1; Moore and Reynolds, 1997). Layers of smectite are converted
to illite, once thought to occur as a conversion of an intact smectite layer to an illite layer. The
conversion of smectite to illite led to the formation of an interstratification of I-S where illite layers
are stacked on smectite layers parallel to the c-axis (turbostratic stacking). I-S was seen first at
temperatures as low as 50°C. The conversion of smectite layers to illite layers proceeded to an
at 200°C (Waples, 1980; Hoffman and Hower, 1979; Velde et al., 1986). Although this reaction
has limiting factors in which it will form (time, temperature, and availability of K+ (Elliott and
Matisoff, 1996)), I-S clay has been seen as the most commonly observed phyllosilicate mineral in
Phanerozoic argillaceous rocks than either smectite or diagenetic illite (Moore and Reynolds,
1997). The presence and availability of pore fluids has been an important parameter in the rate and
extent of the conversion mechanism of smectite to illite. Smectite has been thought to have been
converted to illite by one of three processes. These processes included: solid state conversion of
layers, dissolution of smectite (or illite) and precipitation illite, or Ostwaldt Ripening) (Altaner and
Ylagan, 1997; Eberl and Środoń, 1988).
Equation 1: This expression showed the direct gain of illite from smectite, adapted from Moore and Reynolds (1977) where H2O and quartz are expelled as products. Of note, K-feldspar was the source of K+
forming diagenetic illite in Gulf Coast shales (Hower et al., 1976).
1.4.1 Smectite
The presence of smectite has been essential to the preservation and burial of organic carbon
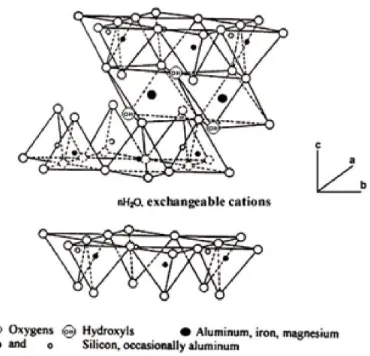
(OC) (Kennedy et al., 2014). Smectite species possessed layer charge between 0.2 – 0.6 identified
by (00l) d-spacing values, from 12.5 - 17 Angstroms (Å) (Moore and Reynolds, 1977). The
commonly observed smectite species (montmorillonite, beidellite and nontronite) are
characterized by their interlayer cation and the type of octahedral cations (Figure 9). When
compared with other phyllosilicates, smectite has a comparatively large mineral surface area and
expandable interlayer space due to its arrangement of tetrahedral and octahedral (TO) sheets
(Środoń, 1990). The presence of relatively weak bonds between layers and the low (and deep
positioned) layer charge in part originating from the octahedral sheet contributedto its expandable
degradation (Kennedy et al., 2014). Interlayer ions were expelled to accommodate the growth of
illite. This transformation also reduced the available mineral surface area for geochemical
reactions. K+ is fixed strongly in diagenetically formed illite. Diagentically formed illite has been
considered a useful phase for K-Ar geochronology at diagenetic temperatures (e.g., Elliott et al.,
[image:31.612.231.416.210.388.2]1991).
Figure 9: This figure is adapted from Moore and Reynolds (1997). This schematic diagram shows the internal crystal structure of the expandable phyllosilicate mineral, smectite.
1.4.2 Illite
Illite has been known to have been formed as a weathering byproduct of detrital muscovite.
In the 1970s, illite was begun to be considered to have formed through the conversion of smectite
to illite in the presence of K+ rich pore fluids in marine diagenetic systems. The formula for illite
is shown in Equation 2 below. Illite, a dioctahedral phyllosilicate mineral, is distinguished by the
presence of interlayer potassium fixed to siloxane surfaces between the 2:1 layers (Moore and
Reynolds, 1997). This micaceous clay possessed a slightly higher layer charge (0.6 < z < 0.9) and
smaller (00l) d-spacing value, 10 Å (Moore and Reynolds, 1997). The higher layer charge of illite
smectite grains was highly sensitive to temperature and therefore can provide useful information
regarding the thermal history of a sedimentary basin (Elliott et al., 1991).
Equation 2: General chemical formula for illite adapted from Nadeau and Bain (1986).
The extent and arrangement of illite (i.e. illite crystallinity) were probed via optical
properties (SEM) and through X-ray diffraction (XRD). The end-member illite has been identified
in straightforward manner via X-ray diffraction. The diffraction peaks for the mixed layer I-S were
depicted as asymmetrical peaks whose d-spacing values were between the pure illite or pure
smectite (Osborne, 2006; Moore and Reynolds, 1997). Characteristic I-S diffraction patterns were
used to distinguish illite polytype and stacking order. The illite polytype (1Md, 1M, and 2M1)
typically has corresponded with its petrogenetic origin. Illite polytypes are distinguished by
stacking arrangements through the study of random mounts. In shales, the smallest size fraction
(approximately <0.2 µm) typically contained the highest fraction of the 1Md polytype. This
polytype is that of diagenetic illite, as observed by Weaver and Wampler (1970) and Pevear (1999).
The coarser fractions in shale contained more 2M1 illite polytype. This polytype corresponded to
detrital illite or muscovite mica. Consequently, shale are considered binary mixtures of diagenetic
illite (1Md polytype) and detrital illite (2M1) polytype.
More typically, the classification of interstratified clays was based on the percentage of
illite layers in an I-S and the stacking order of illite layers with smectite Three stacking orders have
been observed (random, ordered and Kalkberg-ordered). The Reichweite (R) term is used to
express the stacking order seen in I-S. The Reichweite (German for reach back) descriptor is the
followed by I), smectite layers are followed by smectite layers such that illite was not observed in
two consecutive layers. This fraction of illite layers in this stacking order is typically 0% to 50%
illite in I-S. As illite increases to 50% of the I-S, the stacking order of illite and smectite evolved
to a “short-range” (R=1 ISISIS..) (Hoffman and Hower, 1979). In this stacking order, a smectite
layer is followed by one or more illite layers. The fraction of illite layers ranged from 50%- 80%
illite layers in I-S. With progressive burial conditions, I-S approaches the solid end member illite
and a “long range” stacking order was referred to as Kalkberg ordering, R=3 (SIIISIII) (Hoffman
and Hower, 1979). In this last stacking order, three or more illite layers followed one smectite
layer. The stacking layer of I-S can be determined by the change in diffraction peaks (Figure 10).
The stacking order has been used as a semi quantitative geothermometer for the study of the
Figure 10: Ethylene glycol diffraction patterns adapted from Reynolds and Hower (1970). The diffraction patterns show to conversion of interlayered I-S 70% (E) to end member illite (H).
1.4.3 Kinetics
The diagenetic growth of illite in black shales has corresponded to the time and temperature
conditions needed to generate crude oil and natural gas (i.e. oil generating window, Schieber, 2010;
Waples, 1980). Mature hydrocarbons were generated when 80% of the clay minerals are illite
(R=3) (Waples, 1980). The extent of illitization was limited also by cation (K+) availability, time,
and temperature. The rate of reactions across mineral faces can be shown through mathematical
modeling i.e. kinetics (duration of the reaction; Elliott and Matisoff, 1996). The theory of kinetics
determined the duration of a reaction as a system approached equilibrium (Giles, 1997). The loss
and Matisoff, 1996). Time and temperature in this reaction are independent parameters (Waples,
1980). At low temperatures, illite precipitated slowly. Conversely, rapid illitization occurred as an
instantaneous alteration of pore-water chemistry at higher burial temperatures.
Kinetic models of diagenetic evolution were used to derive a time and temperature history
to predict thermal maturation. These kinetic expressions (Equation 3 and Equation 4) can be
computed at a range of geologic setting using a time-depth burial curve, geothermal gradients, and
availability of K+ ions (Elliott and Matisoff, 1996). In this equation, S represents the amount of
smectite lost to form an ordered I-S (M). Time is represented by t and the variable k is the rate
constant (time -1).
Equation 3: This equation was adapted from Huang et al. (1992).
Equation 4: The parameter k1 is the illitization rate constant described in Equation 4. Where A is a pre-exponential rate constant (sec-1). Ea is the activation energy of this process. R and T are the gas
constant and absolute temperature, respectively.
1.4.4 Illite and Petroleum
Illite has been successfully employed by the petroleum industry as a semi-quantitative
geothermometer (Figure 11). Additionally, since K+ is fixed strongly within the interlayer,
diagenetic illite has been found to be a suitable for K-Ar geochronologic methods at diagenetic
temperatures. Consequently, the timing of thermal maturation in shales leading to the expulsion
of crude oil and natural gas can be estimated via a K-Ar age of diagenetic illite in shales. This
geothermometer is based on the tightly held 40K within the interlayer between two illite layers.
diagenetic events (e.g., Weaver and Wampler, 1970; Hower and Aronson, 1976; Elliott and
Haynes, 2002). Pevear (1999) combined illite polytype data with K-Ar ages of illite to estimate
the ages of diagenetic illite in shales (Illite Age Analysis, Pevear, 1999). IAA is a technique to
[image:36.612.152.498.185.397.2]derive the age of diagenetic illite in the presence of detrital illite.
Figure 11: This table was adapted from Pollastro (1993). It is shown that the time and temperature needed to created natural gas coincides with increasing illitization.
1.5 Thermal Maturity Estimates of the Wolfcamp Shale
The distribution and effectiveness of hydrocarbon maturation has been a function of
sedimentation (deposition and preservation of organic carbon), subsidence (temperature from
burial), and time. Carter et al. (1998) used burial history models to deduce that oil generation began
in basins (containing the Wolfcamp Shale) as early as late Mississippian Period. Per these models,
this formation has reached thermal maturity generating crude oil and natural gas by the end of the
late Cretaceous (Engle et al., 2016).
These determinations were based on assumptions that the reservoirs associated were
to no appreciable lateral migration of mature organic matter and expulsed crude oil and natural
gas. Thermal maturity measurements were essential parameters to determine the viability of source
rocks as producers of hydrocarbons. The degree of thermal maturity can be evaluated by changes
in petrographic, clay mineral, and/or organic indices (Osborn, 2006). Examples of thermal
maturity indicators relevant to this study were described in the following paragraphs.
Many diagenetic reactions occurred at the approximate temperature and pressure regime
needed to transform organic matter in shales or petroleum source rocks (OM) into crude oil and
natural gas (Velde and Lanson, 1993; Pevear, 1999; Velde and Vasseur, 1992). Time and
temperature both exerted considerable control in the generation of crude oils and natural gas from
OM in source rocks. Diagenetic parameters (temperature, time) lithostatic pressure, rate of
subsidence typically drive the extent and rate of the conversion of kerogen and related materials
(proteins, lipids, amino acids) to crude oil and natural gas. This shale was deposited in both deep
water and continental in the Midland Basin. The amounts of total organic carbon (TOC) measured
and recorded from well data varied laterally and vertically. TOC within the Wolfcamp Shale
ranged from 0.8 to 17 wt. % (Higley et al., 2014; Cardott and Lambert, 1985; Kirkland et al.,
1992).
The organic material fractions of black shales are composed of type-II kerogen and bitumen
(which forms from the thermal maturation of kerogen; Kirkland et al., 1992). The source of
type-II kerogen has been traced to marine phytoplankton, zooplankton, and remains of some of the first
terrestrial herbaceous plants (Kirkland et al., 1992; Sullivan, 1985). Immature kerogen
accumulated as micrometer pockets along with siliciclastic grains, in turn, created petroleum
source rocks. Covalent-bonded compounds composed alkanes and aromatic compounds of carbon
at temperatures well below the oil-generating window. Through the decay of this material during
diagenesis and thermal maturation, carbon-bearing compounds (alkanes, aromatic) became
incorporated in marine sediments so that global crude oil production 85 million barrels each day
or 31 billion barrels each year (Ryan, 2014). OM within this Paleozoic shale was highly preserved
due to anoxic burial conditions, found in pores that would otherwise contain water, ions, or mineral
cavities, and bonded within clay sheets.
The maximum temperature reached in a basin can be used to predict whether the shale will
produce, oil, wet-gas, or dry gas in addition to the characterization of the organic matter itself.
With increased temperature due to increased burial, the solubility of OM is increased. This change
in behavior allowed for the release of organic acids (such as acetate and bicarbonate), CH4, and
CO2 (Palandri and Reed, 2001; Harrison and Thyne, 1992). As the temperature was increased, CO2
was formed through the thermal breakdown of OM. The migration of these organic acids enhanced
the dissolution of feldspar thus providing a source of K+ and Al+3 to form diagenetic illite in shales
(Hower et al., 1976; MacGowan and Surdam, 1990). The dissolution of feldspar also provided Si
and Al for the precipitation of other minerals such as kaolinite. As the organic matter was maturing,
the stability of the silicate minerals were controlled by temperature, pore fluid chemistry, accessory
minerals, and the effects of organic acids.
In addition to the increase in temperature, the burial of sediment increased the effective
stress (σe) on underlying units. Wickard et al. (2016) noted the presence of relict hydrocarbons
within horizontal fractures of the Wolfcamp Shale. Overpressuring, a function of σe, occurred
during hydrocarbon migration (Marshall, 1982) common in sedimentary basins with high levels
of subsidence. Hydrocarbon migration was interpreted as occurring after secondary porosity due
fractures when the maximum principle stress was vertical (Eseme et al., 2007).
Hydraulically-induced fracture propagated in the same direction during the search for natural gas (Eseme et al.,
2007). Horizontal fractures occurred in relative shallow shales where there is a smaller discrepancy
between vertical and horizontal stress (Eseme et al., 2007). These fractures were propagated by
overpressuring.
Lastly, the time-temperature index (TTI) was formulated to evaluate thermal maturity and
related geochemical reactions. Organic petrologists correlated measured values of the vitrinite
reflectance (VRo) against the depth of burial to derive burial temperature. Vitrinite was formed
from the lignin in cell walls of vascular plants (Waples, 1980). This technique measured the
amount of incident light reflected from the surface of the organic material at a magnification of
500 x (Waples, 1980). Thermal maturity can be estimated knowing the maximum temperature
(Tmax; (Jarvie et al., 2001; Equation 5). The oil and gas generating window was correlated at a
range of vitrinite reflectance values from 0.55%-1.15%, reaching optimal maturity at 0.90%
(Waples, 1980). The earth’s crustal geothermal gradient, 25oC/km, paired with the estimated depth,
can be used to derive the maximum temperatures (Tmax) corresponding to specific depths of burial
in the absence of knowing a burial curve.
Equation 5: This equation, adapted from Jarvie et al. (2001) provides the calculation of %VRo from maximum temperature (Tmax).
Estimates of organic parameters of thermal maturity have been useful to prevent the cost
and environmental disturbances associated with an unsuccessful well. The extraction of
hydrocarbons trapped in black shales was based on knowledge of a source rocks’ thermal maturity.
processes producing hydrocarbons. It is assumed and typically observed that thermal maturity
increased with depth. Along with increased thermal maturation with increased depth, uniaxial
strain caused compaction of previously unconsolidated sediments with increased burial depth.
During burial, a shale’s low permeability prevented the lateral migration of generated oil and
natural gas and precursion organic compounds to adjacent reservoir rocks. Although the thermal
maturities of these basins are well known from extensive petroleum studies, there are fewer studies
addressing the effects of porosity and permeability of stored gas (Clarkston et al., 2013; Jin et al.,
2013; Masterlez et al., 2013; Ruppert et al., 2013; Anovitz and Cole, 2015). The performance of a
reservoir or well is dependent on the storage capacity (porosity), pathways of carbon migration
through accessible and connected pores (permeability) as well as knowing the presence of trapping
mechanism (Pevear, 1999). Increasing knowledge of the timing of hydrocarbon generation reduced
the risk of drilling inefficient wells due to the lack of a trapping mechanism (Pevear, 1999). It is
critical to establish a time-temperature history that correlates the formation of porosity and
trapping mechanism to the cracking of organic material into oil or natural gas.
1.6 Effects of Thermal Maturity on Porosity
Although the thermal maturity of black shales has been studied extensively for oil
exploration, there have been fewer number of studies addressing the effects of microporosity and
micropermeability on the migration and expulsion of crude oil from source rocks. The effect of
microstructure on transport and fluid production had renewed interest in petrophysical studies
(Nagaraj et al., 1990; Anovitz et al., 2017). Due to the existence of complex pore networks and
heterogeneous nature of shales, their complex pore morphology have not been well understood.
These discrepancies within shales required a range of field and lab techniques to characterize the
with time including innovative methods such as well logs, seismic data, ion beam milling, gas
adsorption, SEM, backscattering neutron/electron imaging, and X-ray scattering. Increased
knowledge and ability to recognize structural patterns in thermally mature source rocks will
improve performance and control production during the synthesis of natural gas. These studies are
important to denote conduits for fluid and gas migration are formed from micropores and
fracturesin nonporous rocks.
Black shales are relatively impermeable and nonporous. Shale has an extremely high range
(0-30%) of average porosity (Anovitz and Cole, 2018). Pores present in shales are known to have
been distributed heterogeneously, most on the nanometer scale. This micro and nano-porosity has
been attributed to organic content, mineral content and diagenetic processes alike. In turn, the
permeability of shales have also been recorded as very low due to the presence of micro and
nano-pore sizes. The effective porosity has been measured in the range of somewhere between 8-29%
although most are less than 15% (Anovitz and Cole, 2018). Variations of microstructures have
been attributed to diagenetic responses (interlayer ion expulsion) to discrepancies in texture,
chemistry, thermal maturity (Hester et al., 1990).
Porosity is defined by the total amount of void space divided by the volume of the entire
rock, including those pores that are not accessible for fluids or gas exchange (Equation 6). Porosity
can either be effective, allowing the migration of fluids or closed (Anovitz and Cole, 2015).
Hierarchies of pore structures are assessed by size, shape, and connectivity. Pores are typically
classified into three categories based on diameter, largest to smallest respectably: Macroporosity
(>10 μm), mesoporosity (Ashman and Puri, 2002), micropores (10- 75um) and nanopores (< 75
um) (Loucks et al., 2012) according to the IUPAC classification scheme. Micropores may connect
Equation 6: Mathematical expression for total effective rock porosity (Ashman and Puri, 2002).
The development of primary porosity has been seen as a function of arrangement of clastic
grains, presence of cements and C-org, and tectonic forces. Pore systems have been determined by
grain size distribution at deposition, lithostatic and effective stress, geothermal gradient, and
mineralogy. The accessibility and connectedness of microstructures are determined by mechanical
compaction as well as pore fluid reactions (precipitation, cementation, and dissolution; Anovitz,
2017). Compaction, cementation, and diagenetic mineral formation are attributed to a decrease in
porosity and permeability (Hester, 1980). Gravity anomaly increases thermal maturity due to
increase in sedimentary thickness/sedimentary load.
Lithification has been often associated with a decrease in porosity and permeability, thus
reducing the economic viability of a formation (Giles, 1997). Mechanical compaction during burial
directly controlled the reduction of pore space (Figure 12). Initial porosity has been diminished by
compaction with depth. The effective stress of these units can be calculated with each depth
interval. The lateral compression of sediment loading alters volume and pore space. Porosity
volume alteration also occurs during oil generation, chemical compaction, and clay mineral
transformations. The thermal expansion of minerals also affected the structure and properties of
these shales. The plasticity of kerogen deformation alters porosity by generating fluids and
Figure 12: BSE images from Anovtiz et al. (2017) demonstrating the effect of cementation and decrease in porosity with depth with the St. Peters sandstone.
Neoformation of minerals may disaggregate larger pores into smaller pores during
formation. An increase in micropores with depth is attributed to the disaggregation of preexisting
macropores (Anovitz et al., 2017). Modifications to pore geometry affect storage capacity as well
as sorption inclinations. Elongated pore structures in organic-rich shales allow higher rates of
sorption across pores, such as the sorption of potassium to form illite. Geochemical reactions may
even modify existing pores to accommodate gas expansion (Anovitz et al., 2017; Anovitz and
Cole, 2018).
Nagaraj et al. (1990) described various locations of types of pore spaces within clay-sized
grains (Schieber, 2010), between edges of minerals, and/or between mineral faces. Porosity can be
found between the edge-face and edge-edge boundary of clay particles. Porosity can also be found
between groups of clay minerals, also known as floccs. Pores have been found between grains or
minerals or clay aggregates or exist within organic matter (high internal surface area- affect gas
sorption). Porosity might be present with the inorganic or organic constituents of these shales.
These pockets of porosity impacted the mechanical strength, yield stress of pores. For instance,
the elastic moduli of shale is decreased with the compaction of pores and matrix minerals.
Kerogen, a more ductile material, has been seen to infiltrate pores during compaction more so than
siliciclastic matrix materials (Berger et al., 1997; Harrison and Thyne, 1992; Eseme et al., 2007,
Pommer and Milliken, 2015).
The Wolfcamp Shale demonstrated complex intra-organic microstructural features
throughout the evolution to complete thermal maturation (Wickard et al., 2016). Time-temperature
burial influenced the mineral matrix and organic matter composition by inhibiting the
mobility/storage of natural gas within a source rock. Immature kerogen was weaker than inorganic
constituents of the matrix; therefore, organic porosity was more susceptible to deformation.
Kerogen will more readily integrate into pore spaces when stress is applied. Shales with higher
amounts of organic material will experience a decrease in overall porosity.
Pores either contained moisture or air (Eseme et al., 2007). During heating, these fluids
(water or hydrocarbons) became more volatile, and deformed plastically (Eseme et al., 2007).
Upon increased heating, water stored within mineral structures (such as smectite) was expelled,
and kerogen continued to deform and decay (Eseme et al., 2007). The heating of pore fluids/water
during heating has led to the cracking of bitumen. Thermally mature hydrocarbon chains may flow
to decrease overall matrix porosity (Mohnhoff et al., 2016). Additionally the precipitation of
minerals during diagenesis may impede fluid and vapor migration throughout a source/reservoir
rock. Cementing minerals and flocculation of clay minerals may segment or completely destroy
primary porosity, often referred to as pore throating (Mohnhoff et al., 2016). Illite and mature
TOC occupied space that would otherwise have been void. This textural change was referred to as
'pore throating' or 'pore plugging' (Mohnhoff et al., 2016).
Knowledge of particle distribution and configuration played an important role in
determining reservoir vitality and further sedimentary basin modeling. The dispersion of
micron-size particles affected material performance; such as mature natural gas generation. Nagaraj et al.
(1990) noticed a bimodal distribution of porosity within shales that coincided with Anovitz’s et al.
(2017) observations of bimodal porosity in an Ordovician sandstone. However, there was an
observed considerable difference in the location and geometry of porosity between Paleozoic black
shale samples at different resolutions and grain sizes. Understanding porosity development was
crucial in predicting hydrocarbon production and storage (Nagaraj et al, 1990). The ability to
predict porosity trends is crucial to successful well placement and efficient resource extraction. To
better understand the qualitative characteristics of this basin, high-resolution techniques were used.
Pore networks carry fundamental information able to improve reservoir modeling and
petrophysical exploration.
2 METHODS
The existence of micrometer structures has been investigated through various methods.
Increased knowledge has improved technology and computing in-lab capabilities. These
radiological methods include SEM, TEM, Ct computer tomography, Neutron scattering, and
nanometer structures. High-resolution images can be used to probe samples with unprecedented
clarity. The analysis techniques were chosen based on their ability to accurately probe porosity
size, shape, and surface area and produce accurate representations when abetted with mineralogical
data.
Most laboratory-based techniques used in this study were conducted at Georgia State
University. These analytical approaches were purposefully designed to study the thermal history
of a black shale source rock. The techniques used in this research to study the thermal history of
the Wolfcamp Shales included X-ray diffraction, petrography of thin sections, scanning electron
microscopy (SEM), and preliminary data on small-angle X-ray scattering
(SAXS)/ultra-small-angle X-ray scattering (WAXS). These data were designed to provide new insights as to the
thermal history and the evolution of porosity in these shales. Isotope dating of samples at the
sub-micron level can also be used to date the timing of diagenetic processes, particularly a proxy for
the timing of the maturation of kerogen to crude oil and natural gas. The sample register can be
found in Table 1. K-Ar geochronology of clay fractions was planned for this study. The argon
vacuum extraction line is being brought back to operation after the move to Sparks Hall from Kell
Hall.
2.1 Sample Preparation
Nine samples of the Wolfcamp Shale from various depths in the Midland Basin. Six
Wolfcamp samples were provided by Dr. Elmore’s group (ConocoPhillips School of Geology and
Geophysics, Univ. of Oklahoma). The Wolfcamp Shale samples were collected by Devon Energy
from the eastern shelf of the Midland Basin from the Cortes (WC), Pizzaro (WP), and Pioneer
(WI) cores. Richard Whittington (QEP Research) provided the samples from the Wolfcamp
parallel to bedding. Accompanying well data provides depths and location of samples are shown
in Table 1. These samples were chosen for their varied thermal maturities (0.8 to 1.07% VRo).
The highest thermal maturity (1.07% VRo) occurred in the deepest Wolfcamp sample. The
observed maximum temperature estimated from VRo was 210 ⁰C (Roberts and Elmore, 2018).
After collection, samples of this blocky shale were manually disaggregated.
Approximately 25 grams of each sample was soaked in deionized water for three weeks. This
soaking encouraged further disaggregation needed to separate the clay from the sand and silt
materials. After soaking, the shale was lightly crushed to sizes <1 mm by eye. Several treatments
described in Section 3.2 were employed to remove cements and gross organic matter from soaked
and lightly crushed samples of the whole shale rock (Jackson, 1985). These treatments aided the
disaggregation of clay from these samples. Removal of these compounds promotes the parallel
orientation of clay minerals aiding in successful X-ray diffraction analyses. The following