1
Time-resolved synchrotron x-ray diffraction studies of the crystallization of
amorphous Co
(80-x)Fe
xB
20L M Simmons,1,a) D Greig,2 C A Lucas,3 S H Kilcoyne4
1
School of Engineering, Division of Electrical and Electronic Engineering, Manchester Metropolitan University,
Manchester, M1 5GD, UK
2
School of Physics and Astronomy, University of Leeds, Leeds, LS2 9JT, UK
3
Oliver Lodge Laboratory, Department of Physics, University of Liverpool, Liverpool, L69 7ZE, UK
4
School of Applied Sciences, University of Huddersfield, Huddersfield, HD1 3DH, UK
This paper addresses the time-dependent crystallization process occurring in ‘bulk’ amorphous Co80-xFexB20 (x = 20,
40) metallic ribbons by means of synchrotron x-ray diffraction (SXRD) and transmission electron microscopy
(TEM). Metallic ribbons, produced via melt-spinning technique, were annealed in-situ, with SXRD patterns collected every 60 seconds. SXRD reveals that Co40Fe40B20 alloys crystallize from an amorphous structure to a
primary bcc α-(Co,Fe) phase, whereas Co60Fe20B20 initially crystallizes into the same bcc α-(Co,Fe) but exhibits
cooperative growth of both stable and metastable boride phases later into the hold.
Johnson-Mehl-Avrami-Kolmogorov (JMAK) statistics was used on post annealed samples to determine the mechanisms of growth, and the
activation energy (Ea) of the α-(Co,Fe) phase. Results indicate that the growth mechanisms are similar for both alloy
compositions for all annealing temperatures, with an Avrami exponent of n = 1.51(1) and 2.02(6) for x = 20, and 40 respectively, suggesting one-dimensional growth, with a decreasing nucleation rate. Activation energy for α-(Co,Fe)
was determined to be 2.7(1) eV and 2.4(3) eV in x = 20 and 40 respectively suggesting that those alloys with a lower
Co content have a stronger resistance to crystallization. Based on these results, fabrication of CoFeB magnetic
tunnel junctions via depositing amorphous layers and subsequently annealing to induce lattice matching presents
itself as a viable and efficient method, for increasing the giant magnetoresistance in magnetic tunnel junctions.
I. INTRODUCTION
Tunnelling magnetoresistance is the change in electrical resistance with applied magnetic field that occurs in a thin trilayer consisting of an insulating barrier placed between two ferromagnetic conductors. The insulators are normally ionic bonded oxides such as AlOx and TiOx, with MgO the most common insulator at present, while the ferromagnets can be elements such as Fe or Co. The basic effect observed in magnetic tunnel junctions (now described as TMRs) has been known since 19751 but early changes of electrical resistance with applied field in a junction consisting of Fe/GeO/Co were only of order 14% at 4.2K.
2
earnest on possible alternatives or additions to the composition of both the ferromagnet and insulator layers. Revisiting the potential of TMR it was appreciated that an essential requirement was that the three components of the junction should be (a) crystalline and (b) lattice matched at the interfaces. Extensive developments using Al2O3 as the tunnel barrier resulted in
magnetoresistances of about 70% at room temperature2. A very significant advance was achieved by replacing Al2O3 with MgO. However, it proved very difficult to obtain lattice matching when it was attempted to grow bcc Fe or bcc Co onto (001) MgO. A solution was found by growing MgO on amorphous (CoFe)80B20 with the MgO then taking on a well-oriented (001) structure3. A (CoFe)80B20/MgO/(CoFe)80B20 trilayer is then formed and post-annealing this stack at about 633 K induces crystallization with the CoFeB obtaining a bcc structure closely matching the MgO lattice. Using this method TMR ratios of 600% and greater at room temperature have been obtained3. In addition, TMRs with ultra-thin CoFeB layers for use in spin-torque operated devices have been shown to exhibit perpendicular magnetic anisotropy4 and low-damping. However, as the thickness of the decreases damping increases5, therefore, efforts have turned towards understanding how the composition and thermal treatment of the CoFeB layer affects the magnetic behaviour6
It is now widely accepted that the low coercivities and high resistivities of CoFeB, coupled to their ability to induce crystallization and lattice matching with the barrier MgO, makes them ideal components of magnetic tunnel junctions. However, although there have been several publications on XRD and TEM studies of MgO/CoFeB bilayers, interfaces and capping layers7, there have been no studies of the effects of annealing on the amorphous alloys themselves. The purpose of this paper is to investigate this via two CoFeB ‘classical’ alloy compositions in the form of melt-spun amorphous ribbons, 3 to 5 mm wide by about 20 µm thick. The data for both compositions have been analysed in detail at three temperatures using a Rietveld refinement technique8. Likewise, the kinetics of growth including phase formation has been studied at the same three temperatures by the theory developed by Johnson-Mehl-Avrami-Kolmogorov (JMAK), showing time constants that are remarkably dependent on temperature.
II. EXPERIMENTS AND ANALYSIS
3
Polycrystalline precursor Co(80-x)FexB20 (x = 20, 40) ingots were prepared using an argon arc furnace. High purity (99.9%) Co, Fe and B ingots were melted together in a titanium-gettered argon atmosphere. To ensure homogeneity samples were turned several times and remelted. The total mass of each ingot was limited to 10 g. The resulting ingots were cut into small pieces (0.5 – 1 g), melted in a quartz tube using RF coils, and by a burst of Ar gas forced through a small hole onto a rapidly rotating copper wheel, cooling the sample at a rate of 106 Ks-1. This melt spinning technique produced high quality amorphous ribbons ~20 µm thick and over a metre long.
B. Synchrotron X-ray diffraction
A fragment of melt spun ribbon approximately 20 mm in length was secured onto a copper stub by silver paste, and mounted onto a heating stage of a Displex temperature controller in a cryofurnace on the synchrotron x-ray diffraction (SXRD) instrument XMaS at the European Synchrotron Radiation Facility (ESRF), France. With 10 keV (1.237 Å) X-rays and a sample-to-detector distance of 234.65 mm a 2θ of 16° to 56° could be explored.
The mounted melt spun ribbons were heated to the hold temperatures at 30 Kmin-1. For each alloy stoichiometry three isotherms were collected: Co40Fe40B20 was held at 660 K, 680 K and 690 K, and Co60Fe20B20 at 660 K, 675 K, and 690 K. Diffraction patterns were collected on a MAR CCD detector every 60 seconds with a counting time of 30 seconds.
With the beam in reflection geometry only a portion of the Debye Scherrer cone of diffraction was collected, in the form of an ellipse. The ESA Project9 software package was used to
geometrically transform these elliptical rings into straight lines using an algorithm analogous to Mercator’s theorem.
For each temperature scan treatment room temperature diffraction patterns were collected from a LaB6 powder, to determine wavelength, sample-to-detector distance and instrumental
contribution to peak width.
C. Transmission electron microscopy
4
mechanically thinned using the tripod method to approximately 10 µm on a EDC 300 GTL polisher using diamond polishing disks at 9, 6, 3, and 1 µm. Samples were reduced to electron transparency using a Precision Ion Polishing System (PIPS), performed on a GATAN 691 PIPS
machine. Argon ions accelerated through a potential of 4 kV with a beam current of 20 μA simultaneously polished the top and bottom of the sample at 5˚ and 3˚ relative to the plane of the sample.
Bright field TEM and selected area electron diffraction (SAED) images were collected at an
accelerating voltage of 300 kV on a JEOL 3010 transmission electron microscope and magnifications
up to x1.2 million were collected on a GATAN Orius CCD camera.
III. RESULTS AND DISCUSSION
A. Phase formation – Rietveld refinement
[image:4.612.74.539.343.503.2]1. Co40Fe40B20
FIG 1. Thermograms for Co40Fe40B20 annealed at a) 660 K, b) 680 K and c) 690 K. Insets show spectra collected at the onset of each anneal.
FIG 1 (a-c) shows SXRD thermograms collected during the annealing of Co40Fe40B20 at a) 660 K, b) 680 K and c) 690 K. At the onset of each anneal, time = t0, the predominantly amorphous nature of the sample is evident from the broad essentially featureless diffraction pattern.
5
[image:5.612.69.424.232.391.2]lattice parameters as a function of time annealed were determined. It should be noted that because Fe and Co are almost completely indistinguishable by x-rays a 50-50% occupation was assumed and site occupancies were kept constant. Typically in iron metalloid glasses, phase formation progresses with a primary phase formation of α-Fe11-13, while in CoFeB alloys Co and Fe atoms form continuous solid solutions in the α-Fe phase to form α-(Co,Fe)14.
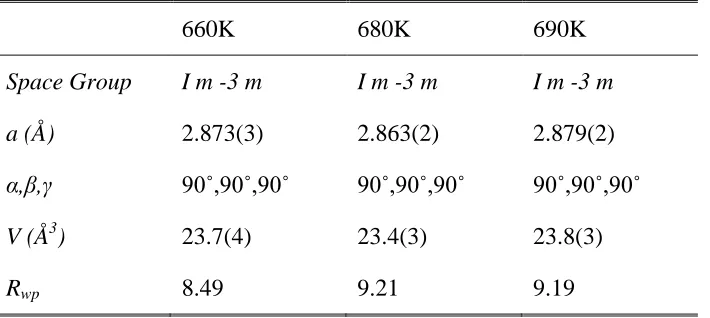
Table I. Final Rietveld refinement parameters for α-(Co,Fe) solid solution in Co40Fe40B20 alloys.
660K 680K 690K
Space Group I m -3 m I m -3 m I m -3 m
a (Å) 2.873(3) 2.863(2) 2.879(2)
α,β,γ 90˚,90˚,90˚ 90˚,90˚,90˚ 90˚,90˚,90˚
V (Å3) 23.7(4) 23.4(3) 23.8(3)
Rwp 8.49 9.21 9.19
Table I shows the final lattice parameters determined by Rietveld refinement for each sample at each of the annealing temperatures. The lattice parameter was shown to vary by less than 0.005 Å during the holds. The lattice parameter at 660 K is 2.873 Å, lower than that published for pure Fe15 (8.881(1) Å). For α-Fe with 12%at Co substitution the lattice parameter at 660 K would be 8.878(1) Å 16, and therefore a deviation in the lattice parameter from α-Fe is likely to be
associated with an increase of Co content. Similarly, the hold at 690 K has a reduced lattice parameter, when compared to Fe, but slightly higher than the hold at 660 K suggesting that fewer Co atoms have diffused into the unit cell. A deviation in the trend is noted in the lattice
behaviour at 680 K, showing a lower lattice parameter than in both the 660 K and 690 K holds. Unusually the lattice parameters should be higher than that at 660 K and lower than that at 690 K due to thermal expansion, although it appears to show contraction. It is likely that this difference is due to the similarity in scattering lengths between Fe and Co, and the assumption during the data analysis that the site occupancies are 50:50.
6
FIG 2 Thermograms for Co60Fe20B20 annealed at a) 660 K, b) 675 K and c) 690 K. Insets show spectra collected at the onset of each anneal.
FIG 2 (a-c) shows SXRD patterns collected during the annealing of Co60Fe20B20 at a) 660 K, b) 675 K and c) 690 K respectively. As with the Co40Fe40B20 alloy there are Bragg peaks associated with a α-(Co,Fe) at t0 in each temperature anneal, in addition, at 690 K there are low intensity peaks which can only be associated with secondary phase formation. The thermograms also show the growth of a second phase after 120 minutes and 20 minutes for the 660 K and 675 K isothermal holds respectively.
7
FIG 3 A typical synchrotron x-ray diffraction pattern from a crystallized Co60Fe20B20 ribbon sample. This pattern was collected after annealing for 100 minutes at 675 K. The black circles are the data points and the solid line is a three-phase Rietveld refinement. The tick marks for each refined pattern are given below the spectra. The lower trace shows the difference plot. The variations in lattice parameters as a function of time annealed determined through Rietveld refinement are shown to vary by less than 1.5% for all three phases. It is difficult to determine exact lattice parameters and weight fractions of three solid solution phases when the Co and Fe atoms are indistinguishable by x-rays, so that the final values given in Table II are a guide only and an indication of chemical composition of the phases formed.
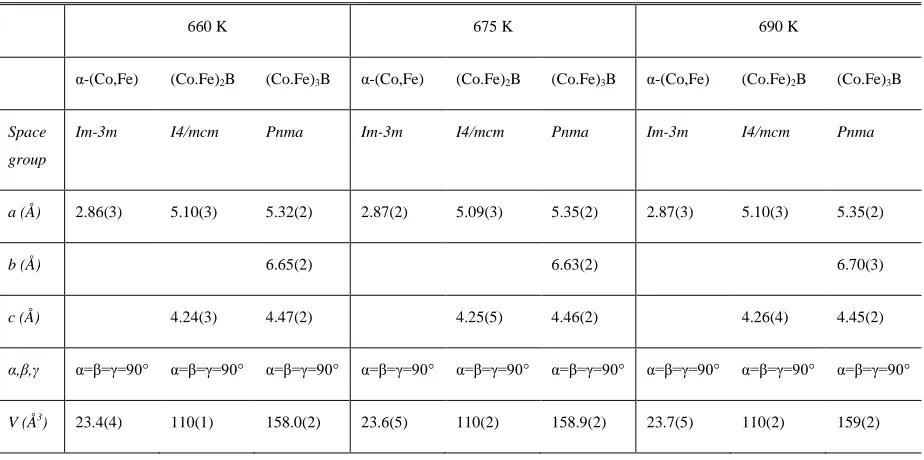
Table II Final Rietveld refinement parameters for three phase refinements
660 K 675 K 690 K
α-(Co,Fe) (Co.Fe)2B (Co.Fe)3B α-(Co,Fe) (Co.Fe)2B (Co.Fe)3B α-(Co,Fe) (Co.Fe)2B (Co.Fe)3B
Space group
Im-3m I4/mcm Pnma Im-3m I4/mcm Pnma Im-3m I4/mcm Pnma
a (Å) 2.86(3) 5.10(3) 5.32(2) 2.87(2) 5.09(3) 5.35(2) 2.87(3) 5.10(3) 5.35(2)
b (Å) 6.65(2) 6.63(2) 6.70(3)
c (Å) 4.24(3) 4.47(2) 4.25(5) 4.46(2) 4.26(4) 4.45(2) α,β,γ α=β=γ=90° α=β=γ=90° α=β=γ=90° α=β=γ=90° α=β=γ=90° α=β=γ=90° α=β=γ=90° α=β=γ=90° α=β=γ=90°
[image:7.612.68.530.491.721.2]8 Weight
(%)
71(3) 15(1) 14(2) 57(2) 22(1) 21(2) 69(2) 17(1) 14(2)
RBragg 1.5 0.3 0.2 0.9 0.8 0.7 1.06 0.5 0.3
B. Kinetics of growth – JMAK
Arguably the most widely accepted formalism for defining the growth kinetics of isothermal transformation curves is that developed by Kolmogorov19, Johnson and Mehl20 and Avrami21,22 (JMAK model). For example it has found uses in the description of amorphous materials, and crystalline phase transformations23. The model describes the time dependence of the crystallite volume fraction (VT) as,
𝑉𝑇= 1− 𝑒𝑥𝑝 �− �𝜏𝑡� 𝑛
� (1)
where τ is the inverse rate constant which represents the time constant for phase transformation and n is the Avrami exponent. In diffusion controlled growth processes, the fraction of volume transformed is associated with the volume of the phase transformed, and in the case of
synchrotron x-ray diffraction experiments can be determined from the integrated intensity of a single phase Bragg peak (assuming there are no effects due to strain or preferred orientation). The value of the Avrami exponent is directly related to the dimensions of grain growth22 and has been comprehensively defined by Christian24.
Taking the double natural logarithm of both sides of equation 1 and rearranging gives
𝑙𝑛𝑙𝑛 �1−𝑉1
𝑇�=𝑛𝑙𝑛 �
𝑡
𝜏� (2)
where a plot of lnln(1/1-VT) versus ln(t/τ) should be a straight line with a gradient of n. Assuming the rate constants follow the Arrhenius law, the activation energy, EA, and its
associated frequency factor (a measure of the probability that a molecule having an energy, Ea, will participate in the reaction), k0, are defined as:
𝑘= 𝑘0𝑒𝑥𝑝 − �𝑘𝐸𝑎
9 Linearizing equation (3) yields,
𝑙𝑛𝑘 =𝑙𝑛𝑘0−𝑘𝐸𝑎
𝐵𝑇 (4)
A plot of lnk versus 1/kBT will therefore be linear with a gradient Ea, the activation energy. During each isothermal anneal the intensity of the α-(Co,Fe) Bragg peak increases as the
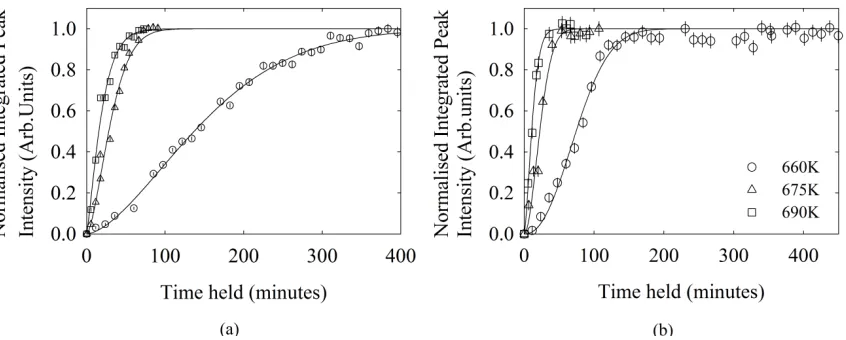
amorphous matrix transforms. In a diffusion controlled growth process the integrated intensity of an isolated Bragg peak is analogous to the volume of material transformed from one phase to another24. FIG 4 (a) and (b) shows the time and temperature dependence of the formation of α-(Co,Fe). The vertical axis is the integrated peak intensity and was determined by fitting a pseudo-voigtian to the (110) reflection and using a fitting routine based on trapezoidal rule in SigmaPlot25 to calculate the area under the curve. There is good agreement between the data points and the fit curves. The solid lines are fits to the JMAK equation (1). Each of the data points have been normalised to lie between 0 and 1. The larger error bars evident in FIG 4 (b) are a consequence of the shoulder peaks on the (110) reflection of the α-(Co,Fe) phase, most
noticeably the (211) reflection of the (Co,Fe)2B phase (shown in FIG 3).
Graphical and tabular representation of the Avrami exponent, n, and the time constant, τ, are
[image:9.612.80.503.466.636.2]given in FIG 5 and Table III respectively.
10
[image:10.612.78.516.96.287.2]FIG 5 Results of JMAK fitting for α-(Co,Fe) phase in CoxFe80-xB20 alloys a) Avrami exponent, n b) time constant τ
Table III Avrami exponents, n, and time constants, τ, from fits to the JMAK equation for CoxFe80-xB20 alloys.
Temperature (K) Avrami Exponent (n) Time constant (τ) (mins)
Co40Fe40B20 Co60Fe20B20 Co40Fe40B20 Co60Fe20B20
660 1.62(3) 2.30(1) 171(1) 87(1)
675 - 1.9(2) - 27(1)
680 1.59(9) - 35(1) -
690 1.25(1) 1.50(9) 20(1) 14(1)
FIG 5 (a) shows that there is little temperature dependence on the growth kinetics of the formation of α-(Co,Fe) phase in Co40Fe40B20, the solid line passing through the data points is a guide to the eye with n varying from 1.25(1) to 1.62(3). In contrast, the data for Co60Fe20B20 indicates a linear dependence on the Avrami exponent with temperature, suggesting there is a temperature dependence of the growth mechanism of the phase.
[image:10.612.68.479.384.541.2]11
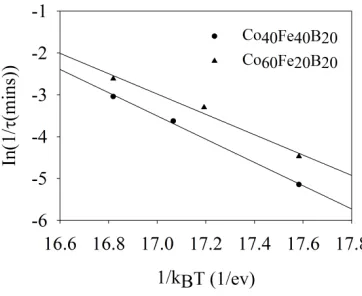
[image:11.612.75.493.146.332.2]for Co40Fe40B20 and Co60Fe20B20 alloys respectively. Extrapolation of the straight line regression to τ = 0 indicates that at 691 K and 692 K α-(Co,Fe) would form instantaneously
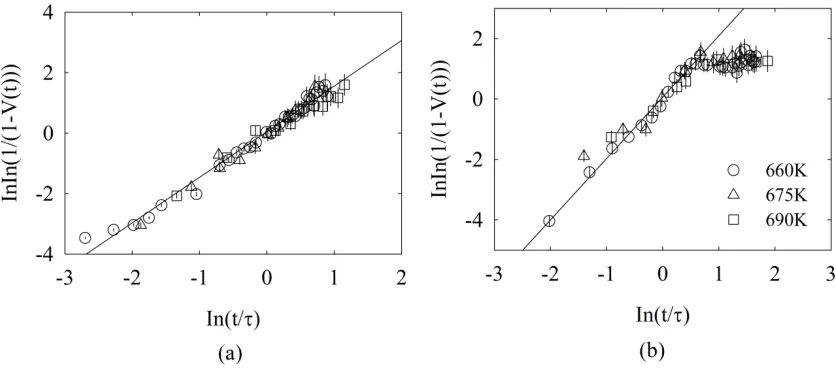
FIG 6 Linearized plot of the JMAK equation for a) Co40Fe40B20 and b) Co60Fe20B20 FIG 6 shows all three isothermal phase formation curves plotted on a single graph of
𝑙𝑛𝑙𝑛 �1−𝑉1
𝑇� vs 𝑙𝑛 �
𝑡
𝜏� (equation 2). In FIG 6 (a) all data points scale well with one another again
indicating universal growth mechanisms in the range 660 – 690K. The solid line through the data points is a fit to the linearized JMAK equation (2), giving an Avrami exponent n = 1.51(3), which is in agreement with the average of 1.5(1) calculated from Table III. This is significantly lower than n = 4 expected for 3D grain growth from the JMAK model, an Avrami exponent in the range 1<n<2 indicated one-dimensional or rod-like growth. Typical dimensions of metallic ribbons are ~50 µm×~2 mm×~1 m, i.e the thickness is 10,000 times smaller than the length, and the width is 1000 times smaller still. Our value of n suggests that the growth in these directions ceases very soon, restricting the growth to continue along the length of the ribbon.
12
In comparison although the curves in FIG 6 (b) scale well with one another there is deviation from the expected straight line at ln(t/τ)~0.5, suggesting a breakdown in the JMAK theory at longer annealing times, a process similar to non-isothermal kinetics at higher temperatures29. A straight line yields an Avrami exponent of n = 2.02(6). Reasons for deviation can be attributed to the saturation of nucleation sites evident in the final stages of crystallization30, or to the
restriction of crystal growth by smaller particles31. Alternatively, for these data the deviation from linearity could be an artefact of the data analysis and interference from secondary phase Bragg peaks in the calculation of the integrated peak intensities. The latter seems more likely as the deviation occurs at approximately 145 minutes into the isothermal hold, and SXRD data indicates that there is secondary phase formation after approximately 120 minutes. Nevertheless, a value of n between 1.5 and 2.5 is comparable to the value found for α-(Co,Fe) found in
[image:12.612.76.257.348.496.2]Co40Fe40B20 alloys.
FIG 7 Arrhenius law for the apparent activation energy of nucleation and diffusion-controlled growth of the α-(Co,Fe) phase (equation 3). The solid line is the straight-line fit to the data. Error bars lie within the data points.
13
more likely to crystallize into α-(Co,Fe). Based on this our results show that alloys with a lower Co content will be more likely to crystallize into α-(Co,Fe).
C. Transmission Electron Microscopy
14
FIG 8 TEM images retained after isothermal annealing at a) 660 K, b) 680 K and c) 690 K. Magnifications and scales are shown on each image.
D. Implications for the fabrication of CoFeB Magnetic Tunnel Junctions
It is clear from the work presented here that the stoichiometry of the initial amorphous CoFeB alloys has a marked effect on the phase formation and transformation during annealing. In epitaxial CoFeB/MgO/CoFeB MTJs high tunnelling magnetoresistance ratios are realised by the coherent tunnelling transport of Δ1 electrons35. Coupling between the Δ1 states of CoFeB and MgO is achieved because upon annealing of the entire MTJ the resultant grain-to-grain epitaxy satisfies the requirement for coherent tunnelling36.
In Co40Fe40B20 alloys it is shown that, irrespective of annealing temperature, a primary body-centre cubic α-(Co,Fe) phase is formed. In each of the isothermal holds the (110) reflection of the α-(Co,Fe) phase occurs at a d-spacing of 2.035 Å, 2.092 Å, and 2.039 Å for isothermal anneals at 660 K, 680 K, and 690 K respectively. The (200) reflection of Fm-3m MgO appears at 2.109 Å and therefore annealing at these temperatures generates the required epitaxial
15
completed and that as the annealing temperature increases the time for complete transformation decreases. In light of this, it is not unreasonable to suggest that the TMR value reaches a
maximum value with the completion of the α-(Co,Fe) phase formation.
In Co60Fe20B20 the crystallization process begins with the primary formation of α-(Co,Fe) followed by eutectic crystallization of (Co,Fe)2B and (Co,Fe)3B. In a study by Lee et al samples of Co80-xFexB20 with x = 20,40 were annealed at 748 K. They showed that the TMR ratio is strongly dependent on electrode composition, with the ratio falling from 480% to 180% for x = 40 and x = 20 alloys respectively38. The introduction of structural disorder with the growth of the secondary phases at the CoFeB/MgO interface has been shown to have a negative effect on the coherent tunnelling of majority spin Δ1 electrons39.
IV. CONCLUSION
Kinetic synchrotron x-ray diffraction has been used to study the time-dependence of phase formation, grain growth and nucleation during the crystallization of amorphous CoxFe80-xB20 alloys (x = 40, 60) annealed at three different temperatures with diffraction patterns being collected every 60 seconds during the anneals. Results of Rietveld refinements show that annealing Co40Fe40B20 alloys leads to primary crystallization of a α-(Co,Fe) phase, whereas amorphous Co60Fe20B20 alloys develop two additional stable and metastable boride phases upon crystallization.
The nucleation and growth kinetics of the α-(Co,Fe) phase formation has been determined by fitting the peak area of the (110) reflection. For both alloy compositions, irrespective of annealing temperatures growth mechanisms are from small dimensions with a decreasing nucleation rate, with growth in one dimension.
A detailed understanding of the mechanism of the crystallographic growth as a function of time and temperature of CoxFe40-xB20 alloys, will lead to more efficient fabrication of
CoFeB/MgO/CoFeB MTJs, where lattice matching between the layers is key to achieving high resistance ratios.
ACKNOWLEDGEMENTS
16
This work was performed on the EPSRC-funded CRG beamline (XMaS BM28) at the ESRF. We are grateful to P Thompson and S Brown (ESRF) for their invaluable assistance during the data collection. TEM images were taken with the help of C Pawley at the University of Salford, and the metallic ribbons were prepared by M. Walker at the University of Leeds. The authors are grateful for the advice from M Dowsett at the University of Warwick on data analysis and the use of the esaProject software package.
REFERENCES 1
M. Julliere, Physics Letters 54A, 225 (1975). 2
D. X. Wang, C. Nordman, J. M. Daughton, Z. H. Qian, and J. Fink, IEEE Transactions on Magnetics 40, 2269 (2004).
3
Ikeda S, Hayakawa J, Ashizawa Y, Lee Y. M, Miura K, Hasegawa H, Tsunoda T, Matsukura F, and Ohno H, Applied Physics Letters 93, 082508 (2008).
4
Ikeda S, Miura K, Yamamoto H, Mizunuma K, Gan H. D, Endo M, Kanai S, Hayakawa J, Matsukura F, and Ohno H, Nature Materials 9, 721 (2010).
5
Liu X, Zhang W, Carter M. J, and Xiao G, Journal of Applied Physics 110, 033910 (2011).
6
Devolder T, Ducrot P. H, Adam J. P, Barisic I, Vernier N, Kim J-V, Ockert B, and Ravelosona D, Applied Physics Letters 102, 022407 (2013).
7
Yuasa S and Djayaprawira D. D, Journal of Physics D: Applied Physics 40, R337 (2007); Zhu J. G and Park C, Materials Today 9, 36 (2007).
8
H. M. Rietveld, Journal of Applied Crystallography 2, 65 (1969). 9
Dowsett M. G, Adriaens A, Martin C, and Bouchenoire L, Analytical Chemistry 84, 4866 (2012).
10
Rodriguez-Carvajal J, (Toulouse, 1990), p. 127. 11
Bang J. Y and Lee R. Y, Journal of Materials Science 26, 4961 (1991). 12
Gibson M. A and Delamore G. W, Journal of Materials Science 22, 4550 (1987). 13
Greer A. L, Acta Metallurgica 30, 171 (1982). 14
Pearson W. B, A Handbook of lattice spacings and stuctures of metals and alloys. (Pergamon, New York, 1958).
15
Ridley N and Stuart H, Journal of Physics D: Applied Physics 1, 1291 (1968). 16
Stuart H and Ridley N, Journal of Physics D: Applied Physics 2, 485 (1969). 17
Gupta A, Ruwali K, Paul N, and Duhaj P, materials Science and Engineering: A 304-306, 371 (2001).
18
17 19
Kolmogorov A. N, Bulletin Academic Science 1, 335 (1937). 20
Johnson W. A and Mehl R. F, Transactions of the American Institute of Mining and Metallurgical Engineers 134, 416 (1939).
21
Avrami M, Journal of Chemical Physics 7, 1103 (1939). 22
Avrami M, Journal of Chemical Physics 8, 212 (1940); Avrami M, Journal of Chemical Physics 9, 177 (1941).
23
Sha P.F, Zhu Z. W, Tang M. Q, Fu H. M, Li Z. K, Li H, Wang A. M, Zhang H. W, Xhang H. F, and Hu Z. Q, Journal of Applied Physics 113, 033508 (2013);
Blazquez J. S, millan M, Conde C. F, and Conde A., Journal of Alloys and Compounds 505, 91 (2010).
24
Christian J. W, Theory of Transformation in Metals and Alloys. (Elsevier, Oxford, 2002). 25
Systat Software, SigmaPlot (San Jose, CA). 26
Baro M. D, Surinach S, Diego J. A, and Clavaguera-Mora M. T, Materials Science and Engineering 133, 807 (1991).
27
El-Shazly and Hafiz A, Journal of Physics D: Applied Physics 34, 483 (2001). 28
Taylor T. J, Khanna Y. P, and Liebermann H. H, Journal of Materials Science 23, 2613 (1988).
29
Meisel L. V and Cote P. J, Acta Metallurgica 31, 1053 (1983). 30
Duhaj P, Barancok D, and Ondrejka A, Journal of Non-Crystallisatine Solids 21, 411 (1976).
31
Speyer R. F and Risbud S. H, Physics and Chemistry of Glasses 24, 26 (1983). 32
Gupta R, Gupta A, Gupta M, Rajput P, and Wildes A, Journal of Applied Physics 114, 063903 (2013).
33
Chrissafis K, Maragakis M. I, Efthimiadis K. G, and Polychroniadis E. K, Journal of Alloys and Compounds 386, 165 (2005).
34
Burke J. E and Turnbull D, Progress in Metal Physics 3, 220 (1952). 35
Butler W. H, Physical Review B 63, 054416 (2001); Yuasa S, Nagahama T, Fukushima A, Suzuki Y, and Ando K, Nature Materials 3, 868 (2004).
36
Choi Y. S, Tsunekawa K, Nagamine Y, and Djayaprawira D, Journal of Applied Physics
101, 4 (2007); Djayaprawira D. D, Tsunekawa K, Nagai M, Maehara H, Yamagata S, Watanabe N, Yuasa S, and Ando K, Applied Physics Letters 86, 092502 (2005). 37
Wang W. G, Ni C, Rumaiz A, Wang Y, Fan X, Moriyama T, Cao R, Wen Q. Y, Zhang H. W, and Xiao J. Q, Applied Physics letters 92 (15), 152501 (2008).
38
Lee Y. M, Hayakawa J, Ikeda S, Matsukura F, and Ohno H, Applied Physics Letters 90, 212507 (2007).
39