Content based Image Retrieval System with Hybrid
Feature set and Recently Retrieved Image Library
Seema Haribhau Jadhav
Asst.Prof, Dept.of Instru&controlN.D.M.V.P.S’S K.B.Thakare College of Engg, Nashik, MH, India
Shah Aqueel Ahmed,
PhD.Head of the EIE Department Royal Institute of Science & T
Damergidda, A.P., India
ABSTRACT
Content based image retrieval system is a fast growing research area, where the visual content of a query image is used to search images from large scale image databases. In this proposed an effective system, both the semantically and visually relevant features are used to retrieve the related images. The challenge for the CBIR system is how to efficiently capture the features of the query image for retrieval. In traditional content based retrieval system, the visual content features of the whole query image are used for the retrieval purpose. But in the proposed system, the object wise features of query image are utilized for the effective retrieval. Moreover, an active Recently Retrieved Image Library (RRI Library) is used, which increases the accuracy in each retrieval. An RRI library uses an index system, which maintains the recently retrieved images, and during the retrieval process, the proposed system searches the pertinent images from both the database as well as the RRI library and hence the retrieval precision is gradually increased in each retrieval. The proposed CBIR method is evaluated by querying diverse images and the retrieval efficacy is analyzed by calculating the precision-recall values for the retrieval results.
Keywords: Content Based Image Retrieval, Mean Filter, Low level feature, High level feature, Image Segmentation, k-mean algorithm.
1.
INTRODUCTION
Image retrieval systems browse, search and retrieve images from a huge database of digital images [7]. Pictorial queries based retrieval of image data is emerging as an interesting and challenging problem with the advancement of the multimedia network technology and the growth of image data. A method used for retrieving similar images from an image database, called Content Based Image Retrieval (CBIR) [3] [4]. has emerged as a hot topic in technical research [1]. CBIR has diverse applications in internet, multimedia, medical image archives, crime prevention, entertainment, and digital libraries [13] and it is an important field in image processing [2]. Visual contents, commonly called as features are used by CBIR to search images from large scale image databases according to the requests of the user which is provided in the form of a query image [12]. It is essential for features of an image to have a sound relationship with the semantic meaning of the image. By comparing the features of the query image with the features of the images present in the database the CBIR system retrieves relevant images from the image database for s given query image [14] [5]. Based on the low level or high level features used for retrieval, the CBIR systems can be classified into different types [11].
CBIR systems that use low-level features for retrieval identifies the data base images that have visual similarity with the query image by comparing the low-level image features [8] like color, texture, shape and structure that are extracted from the images [9] [10]. The high-level description is an attributed graph attained by the structural representation of the image [16]. Compared to low level features, extraction of high level features is more difficult, even though they are more preferable for retrieval of images, particularly where human perception is more important [6]. Bridging the gap between low-levelfeature layout and high-level semantic concepts is the most challenging aspect of CBIR [15].
2. CBIR SYSTEM WITH RECENTLY
RETRIEVED IMAGE LIBRARY (RRI
LIBRARY)
An explosive growth of digital images has increased the need for an efficient content-based image retrieval system. The performance of the CBIR system usually depends upon the features adopted to represent the images in the database. The proposed CBIR technique will use both the human perception as well as machine level perception. Proposed system also uses a recently retrieved image library for the retrieval of the system. The proposed Image retrieval system consists of two steps namely feature extraction and retrieval phase. The figure1 illustrates the process of the proposed system
2.1 Feature Extraction
The feature is defined as a function of one or more measurements, each of function denotes some quantifiable property of an object and it is usually selected and computed in such a manner that it makes the object unique by quantifying some significant characteristics of the object. All of these features are plainly classified into low level features and high level features. The proposed system uses both low level and high level features for the effective retrieval of the proposed system. Let
'
a
'
be an image of sizeM
N
has related images which are to be retrieved and firstly its low level and high level features are extracted.The fig1. Illustrates the process of the proposed system.
2.1.1. Low Level Feature Extraction
2.1.1.1. Color based Region Segmentation
Usually most of the images are rich in color. In the proposed technique the different objects in the image are segmented on the basis of the colors. In our proposed segmentation technique the number of different colors present in the image is reduced to 128. The LGB vector quantization algorithm is used in proposed technique to obtain the set of different colors which will represent image colors in lab space (with respect to mean square error). For each pixel
a
x,y, we can calculate the local color contrast.
xy as follows.xy xy xy y x
(1)Where
xythe average of a color in the small neighborhoodaround
xyand.
represents the norm of the vector. Thepixel
a
x,y is considered as an edge if its contrast exceeds a predefined value threshold
.In the next step, to distinguish between the different uniform regions, texture areas, and contour points, we use a sliding window to estimate the different characteristics of image such as mean
, and variance
, of edge density for each pixel. Depending upon these different estimates characteristics the pixel values are classified into five types T1, T2, T3, T4 and T5 as : T1) If
0
then uniform, T2) If
<t
1
then noise wheret
1
is a uniform region , T3) Ift
1
<
<t
2
then edge between two uniform regionst
1
andt
2
. T4) Ift
2
<
<t
3
then texture edge, i.e. transition between uniform and textured region (or between two textured regions), T5) If
> t3 ,
>t
v , Coarse texture ,T6) Fine texture , If
> t3 ,
<t
v. The process of smoothing of image is controlled by the labeling process which produces the pixel maps. Different Pixels labeled as noise components are removed firstly and there color is changed to the corresponding uniform color. The amount of smoothing is larger for the uniform pixels as human eye usually creates a perception on a single dominant color which is within uniform regions. For the highest amount related to the smoothing of the radius and smoothing kernels are chosen adaptively for each uniform pixel. These smoothing kernels are chosen depending on the distance to the closest edge (color or texture). Color edge and textured edge are not filtered while the edge pixels are not used while computing color composition as the edges do not contribute to the way humans describe color content. Finally, the amount of averaging is performed in the textured areas and is chosen based on the edge density, so that amount of averaging is higher for fine textures and lower for coarse textures. Thus the perceived color at location (x, y),
(
x
,
y
)
is as follows,)
,
(
)
*
(
)
,
(
x
y
g
xyx
y
(2)Where * is the convolution operator and
g
xy is the Gaussian kernel which is defined as1
);
/
(
exp
2
2 2
a a a
ay x y
x
k
x
y
g
g
(3)And
g
xy is the radius of the kernel.g
xy is depends on the type of pixels in the center of the kernelx
ay
a a
6
)
(
2
5
)
(
1
)
(
||
)
(
)
,
(
||
T
s
y
x
if
D
T
s
y
x
if
D
T
s
y
x
if
y
x
y
x
a a a a a a p p xyi
i
i
(4))
(
x
py
p Is the edge pixel closest to(
x
,
y
)
. The smoothingalgorithm usually is the average of the uniform and textured regions. The smoothed and color restored images is then subjected to mean shift color segmentation algorithm for segmentation and the resultant segmented image is as follows
}
1
|
{
' '
i
a
a
i Where ‘
’ is the total no of segmented objects.2.1.1.2. Shape feature extraction
: An efficient and robust representation of shape feature plays an important role in image retrieval. These features should also be independent of different characteristics such as translation, rotation, and scaling of the shape [21]. To extract the shape feature from the image, initially, the image in RGB color space is converted to gray scale image. RGB color is a format for color images and it represents an image with three matrices of sizes matching the image format, where each matrix corresponds to one of the colors such as red, green and blue [22]. When we convert this image into a grey scale (or “intensity”) image, it will depend on the sensitivity response curve of detector to light as a function of wavelength [23] [24]. Leta
r,a
g andb
a
be theR
,
G
,
B
weights of the imagea
respectively.b g
r
a
a
a
a
ˆ
0
.
2989
0
.
5870
0
.
1140
(5)The above equation is the Craig’s formula for converting RGB color image to gray scale image.
After performing grey color conversion, the noise in the image is filtered by using the mean filter.
Mean filtering is a method of smoothing images. The idea of mean filtering is simply to
The Pseudo code-1 shows the process of mean filter. The noise removed image is subjected to k-means clustering for the shape retrieval. The pixels of the noise-free image form a 2D vector
P
; this 2D vector is subjected to clustering to detect different shapes present in the image. Clustering is the process of grouping samples so that the samples are similar within each group. The groups are called clusters [26]. Various regions in the image are discovered by identifying groups of pixels that have similar gray levels, colors or local textures utilizing clustering in the image analysis. There are many clustering techniques present. In our work, we make use of the K-means clustering algorithm for image segmentation for the further process.perform the K-means clustering it is necessary to find out the number of clusters to be partitioned and a distance metric for quantifying the distance between two objects. Prior to the application of K-means clustering on the image, which is in the form of 2D vector, is rescaled to a 1D vector. Subsequently, the k-means algorithm is applied, to cluster the image. The k- means algorithm is briefed here.
After the k means algorithm is applied, again the image in1D vector is converted to 2D vector and the canny algorithm is used for the detection of different edges present in all the clustered sets of the image
a
ˆˆ
x,y . The Canny edge detection operator was developed by John F. Canny in 1986 and it uses a multistage algorithm to detect a wide range of different edges in images. In addition to it canny edge detector is a complex optimal edge detector which takes comparatively longer time in result computations [27]. The canny algorithm consists of mainly five steps, they are smoothing, finding gradients, non-maximum suppression, double thresholding and edge tracking by hysteresis. The above steps are explained below.Smoothing: In this step, noise is removed by applying Gaussian blur to each clustered set of the image
a
ˆˆ
x,y.Finding gradients: After the first step of smoothing, the edge strength is calculated by measuring the gradient of the segmented image
a
ˆˆ
x,y. A 2-D spatial gradient measurement is performed on the different clusters of the image utilizing the Sobel operator and the approximate absolute gradient magnitude (edge strength) at different each point is determined. For estimating the different gradient of the cluster, the Sobel operator utilizes a pair ofm
n
convolution masks, one for thex
-direction (columns) and the other for they
-direction (rows). Edges are marked in the segmented image where the magnitude of the gradient obtained is large. Then this approximate magnitude of the gradient, or Edge Strength, is calculated using the formula:
|
r|
|
x|
|
y|
(6) Where,g
xandg
y are the gradients of the clusters, in thex
andy
directions respectively. But, it does not represent the exact location of the edges because the edges are typically broad. The directions of the edges are determined using the following formula:
|
|
|
|
arctan
1 x y
(7)Non-maximum suppression: In this step the “blurred” edges
present in the gradient magnitudes of the segmented image is converted to “sharp” edges. This is performed mainly by deleting everything except the local maxima in the gradient image. Here the local maxima should be marked as edges present in the image.
Double thresholding: In this process, the pixel-by-pixel strengths of the each edge-pixel that are still present after the non-maximum suppression step are (still) marked. Double thresholding is used in the algorithm. Edge pixels are marked as strong if they have stronger value as compared to the high threshold; suppressed if they have weaker value than the low
threshold and marked as weak if they are found in-between the two thresholds. Thus, by using double thresholding the potential edges are determined.
Edge tracking by hysteresis: In the final step, the strong edges are immediately included in the final edge image because they are marked as “certain edges” and weak edges are included only if they get connected to strong edges. The main reason to do this is that (if the threshold levels are adjusted properly) the strong edges are unlikely to occur as a result of noise and other small variations. Thus strong edges are (almost) attributable only to true edges in the original image. In addition to true edges some other characteristics such as, noise/color variations can also result in weak edges. Finally, all edges which are not connected to a very certain (strong) edge are suppressed to determine the edges of the following segmented image. Hence the edges of the segmented image are tracked and then again the edge is smoothed to remove the unused connected components. Then we can obtain the different shapes that are present in the
image
a
ˆˆ
x,y .2.1.1.3. Texture and Color intensity level
Extraction
Several common textures consist of small textons that are usually in very large number is perceived as isolated objects. These elements are placed more or less regularly or randomly. The texture features are extracted by using the gray level difference method (GLDM). In this GLDM, diverse images are created in the four directions and then a feature vector is generated by linear zing the gray level histograms of these four new images. The texture features extraction is performed based on the following steps.
Step 1: Creation of different images. In the four directions i.e., north-east, north-west, south-east and south-west, the difference images are created. Then the probability distribution function is created from the gray level histograms of these four new images. The step distance is given as d and the four difference images are
Image ( i, j) - Image ( i, (j + d) ) (8) Image ( i , j) - Image ( ( i – d ), ( j + d)) (9) Image ( i, j) - Image ( ( i + d), j) (10) Image ( i, j) - Image ( i -d) ,( j - d)) (11)
Step 2: The probability distribution function is created from the cumulative sum of the gray level histograms of these four new images. Each probability function is given the length of 256.
Step3: The four probability distribution functions are joined to form a feature vector of length 1024. Likewise Color histogram features of the segmented objects are retrieved using the non linear diffusion algorithms.
3. RETRIEVAL PHASE
image library and then images which satisfy the high level feature are extracted and stored in high feature image library. The proposed system retrieves the relevant images which are existed in both the low level library, high level library and also in Recently Retrieved Image Library (RRI Library) are retrieved. The feature set of the retrieved relevant images are stored with syntactic name index in RRI library for future reference.
4. EXPERIMENTAL RESULTS
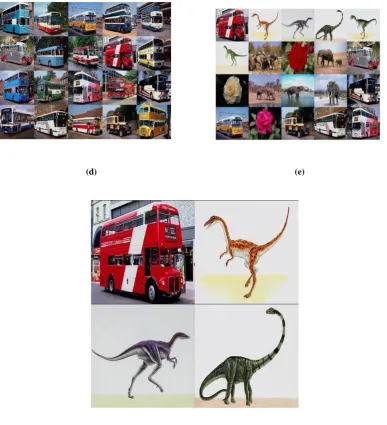
The proposed CBIR system has been implemented in the working platform of MATLAB (version 7.10). The proposed system has been evaluated with different query images and the relevant images are retrieved from the image database as well as RRI library. To accomplish this, initially images are segmented based on color subsequently shape features, object wise texture and color histogram has been extracted from every image in the system database also every image has its semantic name as index name. During the retrieval process the above said features are extracted for query image and relevant images are searched in the database as well as RRI library using the extracted features. Initially the low level features as well as high level features are extracted and the images relevant to the low level features and the images relevant to the high level features are retrieved separately subsequently the images which are satisfying both the high level and low level features are selected from both the outputs retrieved using high and low level features and from the RRI Library. Finally the retrieved results are pushed into the Recently Retrieved Library. The efficiency of the proposed system increases for each successive retrieval. The fig2 (b) and (c) are the color wise segmented image and extracted shape features of the query image in fig2 (a). ; fig2 (d) and (e) are the relevant images which are retrieved using high level and low level features respectively. fig2 (f) is the output of the proposed CBIR system. Likewise the process and consequent results of the proposed system using the same type of query image in the second retrieval and third retrieval are shown in fig3 and fig4 respectively.
4.1 Performance Evaluation
The performance of the proposed system is evaluated on different query images using Precision, and Recall [28, 29] subsequently these values are compared with the Precision, Recall and F_measure values of conventional hierarchical clustering. We have used the Precision and Recall described in [28, 29] for evaluating the performance of the proposed content based image retrieval system.
retrieved images of number Total image query the o relevant t images retrieved of Number precision
(12) database in the images relevant of number Total image query the o relevant t images retrieved of Number recall (13)
The precision Eq. (12) and recall Eq. (13) that are computed for a given query image (in Fig. 2(a), Fig.3 (a), and Fig4 (a) are tabulated in Table-1 and the associated precision-recall graph is shown in Fig. 5. The retrieved images and the precision-recall graph show that the proposed CBIR system with RRI library claims effectiveness in retrieving images that are most similar to the given query image and its effectiveness increases in each iteration.
Table1: Precision Recall values
4.2. Performance Analysis
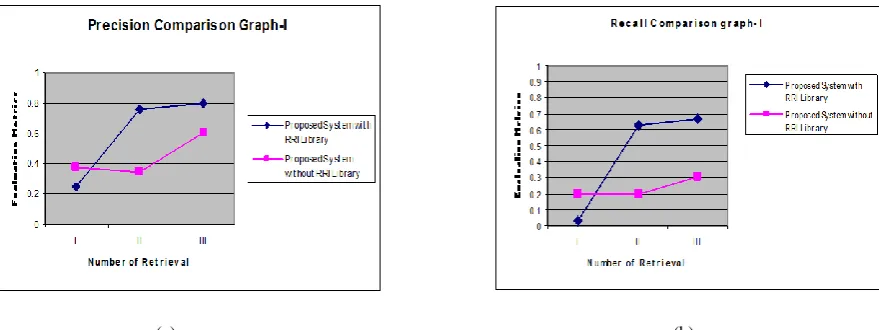
The performance of the proposed CBIR system is analysis with the CBIR system without RRI Library and with the classic CBIR system which retrieve the features of the whole image. The fig.6 (a) and (b) are the precision and recall comparison graph of the proposed system with RRI library to the proposed system without RRI library.
From the fig.6 we came to know that the precision and recall of the proposed system increases with each iteration because of the usage of the RRI library. Precision and Recall difference of the proposed system with the proposed system without RRI library in three retrievals are(-0.125, 0.41, 0.19) and (-0.345, 0.28, 0.06) respectively
.
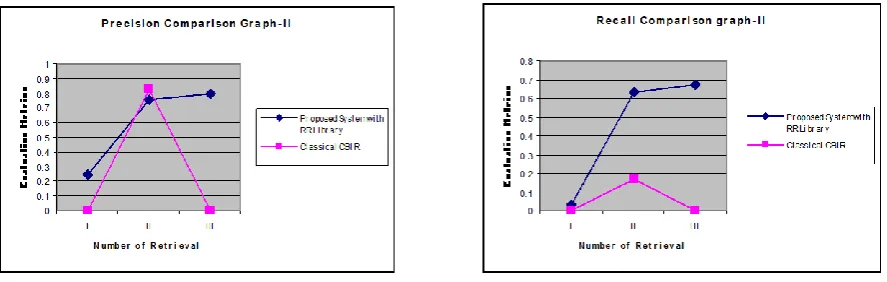
Though the precision and recall value of the proposed system is low in first retrieval its retrieval effectiveness effectively increases in each iteration which shows the higher performance than the comparing system.The fig. 7 illustrates the precision and recall evaluation graph which compare the precision and recall values of the proposed system with the classical CBIR system. The fig7 shows the effectiveness of the proposed system.
Precision and Recall difference of the proposed system with the classical CBIR system in three retrievals are (0.25, -0.07, 0.8) and (0.03, 0.46, 0.67) respectively. The precision of the existing system is high in second retrieval but it shows lower values in remaining two retrievals also the recall values of the proposed system is higher than the existing system in three retrievals which illustrates the high performance of the proposed system
5. CONCLUSION
In this paper a content based image retrieval system was proposed for effective retrieval of the relevant images from the image database. The system is intended to use both the high and low level feature of the images for retrieval purpose
Number of retrieval Precision Recall
First 0.25 0.033333
Second 0.76 0.633333
Third 0.8 0.666667
Performance Evaluation 0 0.1 0.2 0.3 0.4 0.5 0.6 0.7 0.8 0.9
First Retrieval Second Retrieval Third Retrieval
No of Retrieval
Precision
which decrease the semantic gap between low level and high level features. The system was implemented and experimented with varying query images. The analytical results confirmed that the proposed technique showed better performance than the classical CBIR system. It also proved that the performance of the proposed system with RRI library was improving at remarkable rate in each successive retrieval. From all the afore described analytical results, it can be assertively concluded that the proposed system shows good performance than the conventional hierarchical system.
6. REFERENCES
[1] Jianhua Wu, Zhaorong Wei and Youli Chang, "Color and Texture Feature for Content Based Image Retrieval", International Journal of Digital Content Technology and its Applications, Vol.4, No.3, pp: 43-49, June 2010. [2] Ch. Srinivasa Rao , S. Srinivas Kumar and B. Chandra
Mohan," Content Based Image Retrieval using Exact Legendre Moments and Support Vector Machine", The International Journal of Multimedia and its Applications (IJMA), Vol.2, No.2,pp: 69-79, May 2010.
[3] Hiremath and Jagadeesh Pujari, "Content Based Image Retrieval based on Color, Texture and Shape features using Image and its complement", International Journal of Computer Science and Security, Vol. 1, Issue. 4, pp: 25-35, 2007.
[4] Suresh Pabboju and A. Venu Gopal Reddy, "A Novel Approach for Content-Based Image Indexing and Retrieval System using Global and Region Features", International Journal of Computer Science and Network Security, Vol.9 No.2, pp: 119-130, Feb 2009.
[5] Ch. Srinivasa rao , S. Srinivas kumar and B.N. Chatterji, "Content Based Image Retrieval using Contourlet Transform", ICGST-GVIP Journal, Volume 7, Issue 3, pp:9-15, November 2007.
[6] Awais Adnan, Muhammad Nawaz, Sajid Anwar, Tamleek Ali and Muhammad Ali, "Object Identification with Color, Texture, and Object-Correlation in CBIR System", World Academy of Science, Engineering and Technology, Vol.64, pp.117-122, 2010.
[7] Murthy, Vamsidhar, Swarup Kumar and Sankara Rao, "Content Based Image Retrieval using Hierarchical and K-Means Clustering Techniques", International Journal of Engineering Science and Technology, Vol.2, No.3, pp.209-212, 2010.
[8] G. Sasikala, R. Kowsalya, M. Punithavalli, “A Comparative Study of Dimension Reduction Techniques for Content-Based Image Retrieval”, The International journal of Multimedia & Its Applications (IJMA) Vol.2, No.3, pp: 40-47, August 2010.
[9] Rajshree S. Dubey, Rajnish Choubey and Joy Bhattacharjee, "Multi Feature Content Based Image Retrieval", International Journal on Computer Science and Engineering, Vol. 2, No. 6, pp: 2145-2149, 2010. [10]Christoper C. Yang, "Content Based Image Retrieval: a
Comparison between Query by Example and Image Brousing Map Approaches", Journal of Information Science, Vol.30, No.3, pp: 254-267, 2004.
[11]Hui Hui Wang, Dzulkifli Mohamad, N.A Ismail, "Image Retrieval: Techniques, Challenge, and Trend", World
Academy of Science, Engineering and Technology Vol.60, pp: 716-718, 2009.
[12]Nandagopalan, Adiga and Deepak, "A Universal Model for Content-Based Image Retrieval", World Academy of Science, Engineering and Technology, Vol.46, 2008. [13]Srinivasa Rao and Srinivas Kumar, “Content Based
Image Retrieval using Contourlet Sub band Decomposition,” In Proceedings of IEEE International Conference, SPIT Colloquium, Mumbai, pp.140-145, February 2008.
Thomas M.
Deserno, Sameer Antani and Rodney Long, "Ontology of Gaps in Content-Based Image Retrieval", Journal of Digital Imaging, Vol. 22, No. 2, 2009[14]Hiremath and Jagadeesh Pujari, "Content Based Image Retrieval using Color Boosted Salient Points and Shape features of an image", International Journal of Image Processing, Vol.2, No.1, pp. 10-17, 2008.
[15]Mark Ewald, "Content-Based Image Indexing and Retrieval in an Image Database for Technical Domains", Transactions on Machine Learning and Data Mining, Vol. 2, No 1, pp: 3-22, 2009.
[16]Ganapathi Reddy, Babu and Somasekhar, "Image Retrieval by Semantic Indexing", Journal of Theoretical and Applied Information Technology, Vol.5, No.6, pp.745-750, 2005.
[17]Arun Kulkarni, Harikrisha Gunturu and Srikanth Datla, "Association-Based Image Retrieval", WSEAS Transactions on Signal Processing, Vol. 4, No.4, pp.183-189, 2008.
[18]Preeti Aggarwal, Sardana and Gagandeep Jindal, "Content Based Medical Image Retrieval: Theory, Gaps and Future Directions", ICGST-GVIP Journal, Vol.9, No.2, pp. 27-37, 2009.
[19]Wichian,Premchaiswadi & Anucha Tungkatsathan, "On-line Content-Based Image Retrieval System using Joint Querying and Relevance Feedback Scheme", WSEAS Transactions on Computers, Vol.9, No.5, pp. 465-474, 2010.
[20]Hui Hui Wang, Dzulkifli Mohamad and Ismail, "Semantic Gap in CBIR: Automatic Objects Spatial Relationships Semantic Extraction and Representation", International Journal of Image Processing (IJIP), Vol.4, No.3, 192-204, 2010.
[21] Nbhan D. Salih and David Chek Ling Ngo, “A Novel Method for Shape Representation”, In proceedings of ICGST International Conference on Graphics, Vision and Image Processing (GVIP-05 ), Egypt, December 2005. [22]Shi Z, Setlur S, Govindaraju V,” Digital Enhancement of
Palm Leaf Manuscript Images using Normalization Techniques”, 5th International Conference On Knowledge Based ComputerSystems, 2004 December 19-22, 2004 Hyderabad, India; 2004.
[23]Surinta O, Nitsuwat S. Handwritten , “Thai Charactr Recognition Using Fourier Descriptors and Robust C-Protytype” , Information Technology Journal, June 2006.
[25]Ravichandran and Ananthi, "Color Skin Segmentation Using K-Means Cluster", International Journal of Computational and Applied Mathematics, Vol.4, No.2, pp.153-157, 2009.
[26]Vincent and Folorunso, "A descriptive algorithm for sobel image edge detection", in proceedings of Informing Science & IT Education Conference (InSITE), 2009. [27]Bjornar Larsen and Chinatsu Aone, “Fast and Effective
Text Mining Using Linear-time document Clustering”, In Proceedings of the fifth ACM SIGKDD international conference on Knowledge discovery and
data mining, San Diego, California, United States , pp. 16 – 22, 1999.
[28]Michael Steinbach, George Karypis and Vipin Kumar, “A Comparison of Document Clustering Techniques”, in proceedings of the KDD-2000 Workshop on Text Mining, Boston, MA, pp. 109-111, 2000.
[29]Thomas M. Deserno, Sameer Antani and Rodney Long, "Ontology of Gaps in Content-Based Image Retrieval", Journal of Digital Imaging, Vol. 22, No. 2, 2009
Figure 1: Process of the Proposed System
(a)
(b)
(c)
Mapping
Low level feature
Extraction
High level feature
Extraction
Database
Feature
Database
Query Image
query
Low level feature
Extraction
High level feature
Extraction
Low feature Image
Library
High feature image
Library
Recently Retrieved Image
Library
(d) (e)
(f)
Figure-2: Process of First Retrieval (a) Query image (b) Color segmented image (c) Extracted shape feature (d) high level feature based retrieved output (e), Low level feature based retrieved output. (f)Output of first retrieval
[image:7.595.103.491.78.504.2]
(d) (e) [image:8.595.108.488.69.514.2]
(f)
Figure-3: Process of Second Retrieval (a) Query image (b) Color segmented image (c) Extracted shape feature (d) high level feature based retrieved output (e), Low level feature based retrieved output. (f)Output of second retrieval
(d) (e)
(f)
Figure-4: Process of Third Retrieval (a) Query image (b) Color segmented image (c) Extracted shape feature (d) high level feature based retrieved output (e) Low level feature based retrieved output (f) Output of third retrieval.
(a) (b)
[image:9.595.75.515.575.740.2]