Classification of Normal and Abnormal Brain Volume
and Surface Area using Single Point Thresholding
Shweta Tripathi
M.Tech Scholar Digital Communication
RTU, Kota
Roshan Jain
M.Tech
Department Of Electronics And Communication RCEW, Jaipur
ABSTRACT
One of the most important subjects in the processing MR image is segmentation, especially extraction of the brain regions, which is part of the decision of urgent operation on brain. This type of medical operations need speed up process with maximum accuracy. In this study, brain is segmented by using k-means algorithm. A combination of global, adaptive thresholding techniques and at the next stage morphological operations was used for pre-processing. Moreover after these stage the main aim was setting out in the regional different of specified brain disorders to detect normality or abnormality. MRI neuroimages were used. The parameters were slices consisted of 1.5 mm thickness dual-echo fast spin echo data sets that are acquired through MRI scanners. The quality and robustness of the results of this study depend on the homogeneity of MRIs. Finally neuroimages were segmented to gray matter and white matter and volumetric measurements were calculated for whole brain and of these issue types.
Keywords
Segmentation, Volumetric Analysis, Gyrification Index, MRI, Autism, Thresholding algorithms, K-means, White matter
1.
INTRODUCTION
Imaging now plays a significant role in the assessment and regulation of therapies in oncology. The decline in content of grey matter or white matter is a major cause of brain atrophy lead to different brain diseases like alziemers, dementia etc. Brain atrophy occurs due to the loss of neurons due to aging. To design an automated solution for biologists and neurologists for decision making about the abnormal gray and white matter concentration of the brain we proposed a new approach. The gray matter is made up of neurons which act as memory of the human brain. The deterioration of this layer takes place due to two reasons; one due to aging and other is due to some medical condition. In any case it is highly necessary to detect this deterioration in early stages since generation of new neurons other than natural process in not possible. The possible solution is to control this neuron death with the help of medication and other methods. The control over this deterioration can only be possible if the abnormality trend in the brain volumes and surface area can be known in early stages. A slight decrement in the normal brain volumes may be an indication of some neuron abnormality. A lot of researches [] have been done to establish a relationship between the age and respective brain mass volumes for normal ageing human. These researches give the normal brain volumes for respective age groups. We thought of making an automated decision making system which can be trained according to the standard researches in this field. We have thought of an adaptive thresholding method for brain tissue segmentation and training this system for standard normal
2
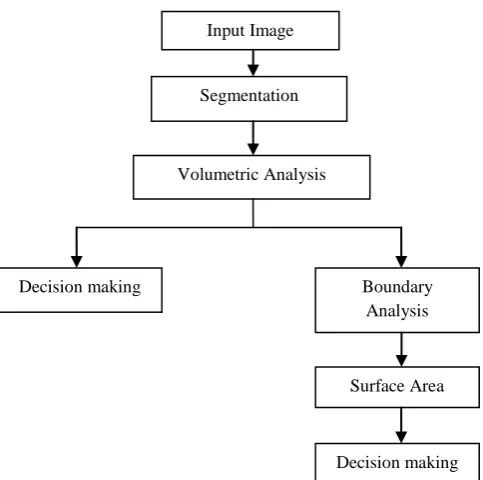
Fig 1: Flow chart of Classification of Surface Area
In this paper we are classifying the abnormal and normal aging. The remainder part of this paper is organized as follows. Section II reviews the various methods used. In Section III, presents the results. Finally, conclusions are drawn in Section IV.
2.
CLASSIFICATION- A REVIEW
Image Acquisition
All MRI scans [48,49 ] were obtained on a 1.5 T General Electric Signa system(GEs Signa HDxt 1.5T), using a protocol, includes spoiled gradient recalled echo in steady state (SPGR). Experiments are conducted on REDUNDANT Database. The database has consist of 85 images numbered from 00105511 to 08509100. The chosen images represent different brain MRI scans. The first three digits indicate the serial number, the next three digits correspond to age and the last two binary digits indicates the white matter and grey matter respectively. If the binary digit is 1, the white matter or grey matter is normal and if it is 0 white matter or grey matter is abnormal. MRI images are stored in dicom file.
Preprocessing
The image segmentation requires anatomically correct alignment of data set acquired within different image acquisition procedure. After correcting anatomical registration, an addition preprocessing step can be performed. All the extracerebral structures that is not required for tissue classification task should be excluded from the dataset. Besides the brain various other structures can be identified, such as skull and pharynx. By defining a mask these extracerebral structures are removed. Finally only the structures belonging to brain remain. Preprocessing prepares the acquired raw digital image for the main detection stage by reducing noise, especially correcting background when non uniform situations occur, and removing geometric structures that otherwise would adversely affect the main processing stage. Within this study correcting background operations are applied all image datasets.
Segmentation
Segmentation means separation of structure of interest from the background and from each other. The principal goal of
segmentation process is to partition an image into regions that are homogeneous with respect to one or more characteristic or feature[60].It is achieved either by identifying all pixels or voxels that belong to the object or by locating those that forms its boundary. Thresholding is the simplest segmentation [66,67 ] method in which a threshold is selected and an image is divided into group of pixels with values grater or equal to the threshold.
K-means Algorithm
In statistical data analysis clustering analysis is a technique which commonly preferred. In the past, in a variety of scientific areas such as pattern recognition, clustering techniques have been widely applied. K-means [69,70 ] clustering is a method of cluster analysis [71]. Its objective is based on to divide n observations into k clusters in which each observation related to its cluster with the nearest mean. It is very similar to the expectation-maximization algorithm for mixtures of Gaussians. Depend on to the nature of this spread they both try to find the centers of clusters in the data.. It is commonly used in computer vision as a form of image segmentation. The objective is to minimize total intra-cluster variance, or the squared gray level differences:
Where ( i n c n) is a chosen distance measure between a
data point i n and cluster center c n . i n is the gray level of pixel (i, j) in the nth image slice (N x M size) and c n is the
central gray value of cluster k in slice n. The iterations continue until a stopping rule. No variation in cluster center is a stopping rule which is met until algorithm executing. The image contains the skull tissues. These tissues are actually non brain elements. Thus, they should be removed in the preprocessing step. The presence of these tissues might lead to misclassification.
Morphological Operations
The images consist of a set of elements that collect into groups that have a two-dimensional (2-D) structure. Various mathematical operations on the set of pixels called mathematical morphology. It is a non-linear technique for processing of geometrical shape of the spatial image data structures [72]. Morphology can for example involve erosion, dilation, opening, closing, etc. Each dilation or erosion operation uses a specified neighborhood. The neighborhood is represented by a matrix, consisting of zeros and ones. The central pixel in the matrix represents the pixel of interest, while the elements in the matrix that are on (logical ones) define the neighborhood. The state of any given pixel in the output image is determined by applying a rule to the neighborhood of the corresponding pixel in the input image. Volumetric Measurements
Obtained segmented slices are saved. In file saving only the most important header information is transferred which defines the volume. Segmentation slices saved as given standart parameters like pixel spacing and slice thickness. These slices combined again to matrix and with k-means 3 portions for WM, GM and background were found. Parameter for k value was 3. Density calculations, proportioning volumetric measurements to brain volume, gray fraction and white fraction were obtained.
Input Image
Segmentation
Volumetric Analysis
Decision making Boundary
Analysis
Surface Area
Boundary Analysis & Decision Making
The boundary analysis is done to calculate the surface area of white and grey matter regions. The regions are differentiated by boundary when the pixel intensity between the two regions differ by a predefined value. The red boundary corresponds to grey matter surface area and green matter boundary corresponds to white matter surface area. Human eyes are more sensitive to colours. The human eyes has the ability to understand the colured image more clearly. It helps the doctor to evaluate the image more clearly. The grey matter surface is identified by yellow colour in figure and white matter surface area is identified by green colour. The evaluated values are compared again standard values and the normality and abnormality of white matter and gray matter are stated.
3.
RESULTS AND DISCUSSION
STEP1. Database
[image:3.595.315.546.239.451.2]Experiments are conducted on REDUNDANT Database. The database has numbering from 00105511 to 08509100 consist of 85 images, respectively. The chosen images represent different brain MRI scans. The first three digits indicates the serial number, the next three digits corresponds to age and the last two binary digits indicates the white matter and grey matter respectively. If the binary digit is 1, the white matter or grey matter is normal and if it is 0 white matter or grey matter is abnormal. One example of this image is as shown in Fig1.
Fig 1: Input Image
STEP 2. Calculate Histogram
The histogram of an image is the vector that contains the count of number of pixels in the image at each grey level. Histogram maximizes the information conveyed from the image by distributing the intensity information in the image as uniformly as possible. The histogram helps in interpreting the regions where pixel intensity is maximum and where it is minimum. The histogram corresponds to input image is shown in Fig 2.
Fig 2: Histogram Image
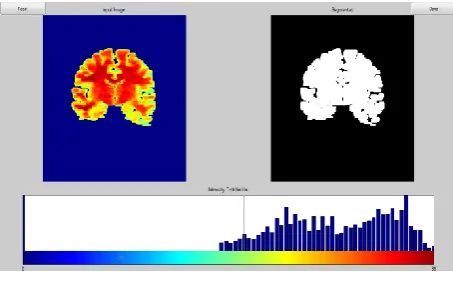
STEP 3. Image Enhancement
[image:3.595.99.235.347.487.2]Intensity distribution is required step which is used to differentiate the grey matter and white matter regions. The regions having maximum intensity corresponds to white matter. A map with contour, surface and colour is created. The dark regions correspond to the deep portions. Image Enhancement technique are used to refine a given image so that desired features become easier to perceive for the human visual system or to be detected by automated image analysis system. It allows the observer to see the details in images that may not be immediately observable in the original image. Intensity scaling can be used when dynamic range of the acquired is used when the image information is present specific narrow intensity bands. The intensity distribution of histogram equalization is shown in Fig3.
Fig 3: Intensity Distribution
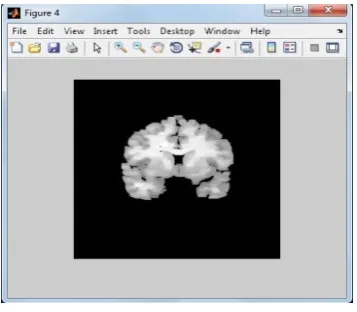
STEP 4. Extraction of brain mask
Some thresholding rules are applied to extract the brain mass which is region of interest. The regions where pixel intensity is below 40 are ignored as these regions basically contain CSF and air. The portions having pixel intensity greater than 100 are the hard tissue parts or the skull. Such portions are also ignored and the brain mass is extracted. The extracted brain mask is shown in Fig 4.
[image:3.595.340.519.576.732.2] [image:3.595.101.236.617.742.2]4 STEP 5. Segmentation
(A)Using single point thresholding
The following are the step followed for segmenting an MRI image:
a) For the first segmentation step, adaptive thresholding techniques were used depend on the general characteristic of the 3D image data background.
b) The next step in the segmentation portion of this program is some manual thresholding to remove unwanted portions of the image data; low levels like Cerebral Spinal Fluid.
c) K-means algorithm was used to segment brain mass to extract other tissues. K value was 3.
d) To supply if there are any small wisps of soft tissue in the image, erosion operation was used with structuring element with 7x7 neighbourhood. e) Obtained brain mass is isolated. To grow back the
brain mass which was reduced previously with the erosion, dilation operation was used again with structuring element with 7x7 neighbourhood. f) To catch the connected regions brain region was
labelled. This operation also supplied to control the boundaries.
g) Last segmentation step is choosing significant labelled resulting image slices from the 3D data set superimposed on original image was evaluated. The above experiments are done on which the gray and white matter can be clearly dissociated from each other. Thus we named this method single point thresholding.
Fig 5: Segmented Image
(B)Expert intervention
[image:4.595.317.544.71.218.2]An expert gets an interactive tool where he can set single point threshold and see the corresponding segmented image together, so that he can decide the best segmenting point on the basis of these experiments. . An easy sliding mode has been used and segmentation results are visible in real time with a very small segmentation processing delay in comparison to others shown in Fig 6 .
Fig 6 : Expert intervention Image
STEP 6. Boundary analysis and colour filling The boundary analysis is done to calculate the surface area of white and grey matter regions. The regions are differentiated by boundary when the pixel intensity between the two regions differ by a predefined value. The red boundary corresponds to grey matter surface area and green matter boundary corresponds to white matter surface area. Human eyes are more sensitive to colours. The human eyes have the ability to understand the colured image more clearly. It helps the doctor to evaluate the image more clearly. The grey matter surface is identified by yellow colour in figure and white matter surface area is identified by green colour.
The result shown in Fig 4.13 is color filled image done on one of the image.
STEP 7: Normality, Abnormality and Surface Area Calculation
Age gro up Num ber of subje cts
Age Grey
matte r (%) White matte r (%) CSF (%) Lesion (%) <40 y
10 23.3±
7.6 (18-38) 48.7± 1.8 (45.8-51.4) 38.9± 2.8 (34.6-43.8) 7.1±3. 1 (3.6-13.7) 0.25±0 .13 (0.12-0.54) 40-49y
9 45.6±
2.7 (42-49) 46.0± 1.4 (44.2-48.9) 37.5± 1.8 (34.2-39.3) 9.9±2. 0 (7-13.8) 0.4±0. 17 (0.22-0.77) 50-59y
8 55.0±
2.3 (52-59) 44.6± 1.9 (42.0-46.6) 38.5± 2.2 (35.1-40.5) 10.6± 2 (7.8-14.3) 0.30±0 .13 (0.13-0.46) 60-69y
23 66.0±
2.9 (60-69) 46.4± 2.3 (41.2-50.2) 35.0± 2.7 (31.3-42.5) 12.3± 2.9 (5.2-18.6) 0.30±0 .1 (0.12-0.5) >69 y
22 73.5±
3.0 (70-81) 47.2± 3.3 (42.4-53.5) 33.0± 4.1 (25-39.2) 13.4± 2.1 (10-18) 0.29±0 .11 (0.1-0.55)
All the database set images are run simultaneously and the effeciency (97.6471%) is calculated.
4.
REFERENCES
[1] Ary JP, Klein SA, Fender DH. Location of sources of evoked scalp potentials: Corrections for skull and scalp thickness. IEEE Trans Biomed Eng 1981;28:447±452. [2] SCHUMANN, C., HAMSTRA, J., GOODLIN-JONES,
B., LOTSPEICH, L., KWON, H., BUONOCORE, M., LAMMERS, C., REISS, A.,, and AMARAL, D., 2004. The amygdala is enlarged in children but not adolescents
with autism; the hippocampus is enlarged at all ages. Journal of Neuroscience, 24(28):6392.
[3] ULAY, H., and ERTUGRUL, A., 2009. Otizmde Beyin Goruntuleme Bulgular: Bir Gozden Gecirme. Journal, Turkish Psychiatry.
[4] COURCHESNE, E., KARNS, C., DAVIS, H., ZICCARDI, R., CARPER, R., TIGUE, Z., CHISUM, H., MOSES, P., PIERCE, K., LORD, C.,, et al., 2001. Unusual 42 brain growth patterns in early life in patients with autistic disorder: an MRI study. Neurology, 57(2):245. 50
[5] SPARKS, B., FRIEDMAN, S., SHAW, D., AYLWARD, E., ECHELARD, D., ARTRU, A., MARAVILLA, K., GIEDD, J., MUNSON, J., DAWSON, G.,, et al., 2002. Brain structural abnormalities in young children with autism spectrum disorder. Neurology, 59(2):184. [6] COURCHESNE, E., 2004. Brain development in autism:
early overgrowth followed by premature arrest of growth. Mental Retardation and Developmental Disabilities Research Reviews, 10(2):106–111.
[7] AYLWARD, E., MINSHEW, N., FIELD, K., SPARKS, B.,, and SINGH, N., 2002. Effects of age on brain volume and head circumference in autism. Neurology, 59(2):175.
[8] COURCHESNE, E., REDCAY, E.,, and KENNEDY, D., 2004. The autistic brain: birth through adulthood. Current Opinion in Neurology, 17(4):489.
[9] HAZLETT, H., POE, M., GERIG, G., SMITH, R.,, and PIVEN, J., 2006. Cortical gray and white brain tissue volume in adolescents and adults with autism. Biological Psychiatry, 59(1):1–6.
[10] CARPER, R., MOSES, P., TIGUE, Z.,, and COURCHESNE, E., 2002. Cerebral lobes in autism: early hyperplasia and abnormal age effects. Neuroimage, 16(4):1038–1051.
[11] LINGURARU, M., VERCAUTEREN, T., REYES-AGUIRRE, M., BALLESTER, M.,, and AYACHE, N., 2007. SEGMENTATION PROPAGATION FROM DEFORMABLE ATLASES FOR BRAIN MAPPING AND ANALYSIS.
[12] ABELL, F., KRAMS, M., ASHBURNER, J., PASSINGHAM, R., FRISTON, K., FRACKOWIAK, R., HAPP´E, F., FRITH, C.,, and FRITH, U., 1999. The neuroanatomy of autism: a voxel-based whole brain analysis of structural scans. Neuroreport, 10(8):1647. [13] MCALONAN, G., DALY, E., KUMARI, V.,