A Monthly Double-Blind Peer Reviewed Refereed Open Access International e-Journal - Included in the International Serial Directories International Research Journal of Natural and Applied Sciences (IRJNAS)
Website: www.aarf.asia. Email: [email protected] , [email protected] Page 79
GIS BASED SEMI-QUANTITATIVE MORPHOLOGICAL ANALYSIS OF
KANKURAM BASIN, GHATSILA
Dr.MeryBiswas! And Mr.Asit Kumar Biswas!!
! Assistannt Professor. (M.Sc., Ph. D, Cal.). Department of Geography in Presidency University.
!!(M.Sc. in Geography). Presidency University.
ABSTRACT
The present research work embodies the application of GIS technique for the detail analysis of
River basin morphology. Basically the study is concerned about the use of this recent GIS
technique in basin analysis. Weight age have been given to the river morphology especially the
morphometric parameters, slope analysis by DEM preparation and channel pattern
quantification with its relevance of hydraulic knowledge. The Kankuram River is a small
right-hand tributary of R. Subarnarekha of Jharkright-hand. This basin gives us an ample scope for
studying and observing various morphological requirements from source to mouth. Keywords:
Rejuvenation, GIS technique,hydro-geomorphological parameters.
A Monthly Double-Blind Peer Reviewed Refereed Open Access International e-Journal - Included in the International Serial Directories International Research Journal of Natural and Applied Sciences (IRJNAS)
Website: www.aarf.asia. Email: [email protected] , [email protected] Page 80 Subarnarekha river system of east Chhotonagpurplateau.The most significance feature of tecto-shearnesson the basin morphology is and channel pattern parameter has been taken under consideration for study.
A Monthly Double-Blind Peer Reviewed Refereed Open Access International e-Journal - Included in the International Serial Directories International Research Journal of Natural and Applied Sciences (IRJNAS)
Website: www.aarf.asia. Email: [email protected] , [email protected] Page 81 Objectives of the study area:
The main objectives of the study area are-
i) To evaluate the basic hydro - geomorphological parameters.
ii) Basin morphological analysis and terrain evolution by GIS techniques.
iii) Quantitative analysis of fluvial channel morphology by both GIS technique and field experiences.
Methodology:
The qualitative analysis of the morphometric characteristics of the basin includes stream order, stream length, bifurcation ratio, drainage density, drainage frequency, relief measurements etc. These parameters were estimated from digitized coverage of drainage network map in the GIS environment. Morphological characterization is the systematic description of watershed’s geometry. Geometry of drainage basin and it’’s stream channel system required the following drainage network: linear aspect of ratio, areal aspect of drainage basin, relief aspect of channel network and contributing ground slopes. Thus, it provides an effective comparison, regardless of scale. In the present study, for stream ordering Strahler (modified Horton's) method was adapted for quantitative analysis because of its simplicity and flexibility from subjective decisions.
A Monthly Double-Blind Peer Reviewed Refereed Open Access International e-Journal - Included in the International Serial Directories International Research Journal of Natural and Applied Sciences (IRJNAS)
Website: www.aarf.asia. Email: [email protected] , [email protected] Page 82 environment by visual interpretation.Thses advanced techniques have been formulated for the measurement of the aspect of the terrain evolution and basin morphology of Kankuram River basin, the entire work may be divided into 3 major parts-
Geological setup:
A Monthly Double-Blind Peer Reviewed Refereed Open Access International e-Journal - Included in the International Serial Directories International Research Journal of Natural and Applied Sciences (IRJNAS)
Website: www.aarf.asia. Email: [email protected] , [email protected] Page 83 Tectonic activity: Tectonically this area is a plate boundary between Singhbhum plate and Chotonagpur micro plate. The plate
A Monthly Double-Blind Peer Reviewed Refereed Open Access International e-Journal - Included in the International Serial Directories International Research Journal of Natural and Applied Sciences (IRJNAS)
Website: www.aarf.asia. Email: [email protected] , [email protected] Page 84 manganese etc.This area is characterized
by presence of ophiolite. Ophiolites are pieces of oceanic plate that have been thrusted (abducted) onto the edge of continental plates, which is evidenced by the presence of Dalma hills which is actually formed by mafic lava (Plate no.1)of oceanic origin. The past undersea volcanoes are exposed out by erosional agents and present day they stand as small
A Monthly Double-Blind Peer Reviewed Refereed Open Access International e-Journal - Included in the International Serial Directories International Research Journal of Natural and Applied Sciences (IRJNAS)
Website: www.aarf.asia. Email: [email protected] , [email protected] Page 85 serichite schist/quartzite, biotite chlorite quartz schist and the Chaibasa quartzite. General strike of foliation is NNE – SSW with 40° – 50° south west dip. Host rock for mineralization is mainly quartz-chlorite-serichite schist and quartzite.
Climatic consequences:
The analysis of climatic condition in the field of geomorphologic studies is an important aspect. Apart from the lithological features like structure, types of rocks etc. climatic condition play an important role in fashioning the land surface. The geomorphologic process in a region varies with changes of climatic conditions. For example, fluvial processes are found to be dominated under humid climatic conditions Aeolian processes are found to be dominated in arid climatic conditions. The land forms developed by these processes are different in character. Hence the climatic condition of east Singbhum District is analyzed in this chapter in order to understand nature of land forms development under the processes are concerned in Middle Subarnarekha Basin. The Middle Subarnarekha Basin area i.e. south eastern part of Chotanagpure plateau is characterized by Monsoonal climate ,but according to Koppen’s climatic classification it falls under the semi arid climate. The temperature and rainfall characteristic varies with change of season. There is a sharp increase in temperature found in the pre monsoon period that is months of March to April until May. The monthly mean temperature lies between…. The wind consequently blows from west with increasing velocity from 9.6 to14.4 km/hour (Sing). Norwester is another important climatic phenomenon in the month of May to June which brings heavy shower in short duration. During June and October the temperature begins to decrease with the temperature begins to decrease with the onset of South West monsoon. Most of the seasonal rain fall (above 75%) occurs in this time. July is the wettest month of this region. The total rainfalls during in the years 2008, 2009 are 1553mm, 1263mm respectively. The coldest season commences from November and last till the end of February. The January is the coolest month of this basin area. The normal mean temperature of January ranges from 16.4o to 17.8O. The main characteristic of climate of this region is the changes of climatic condition from arid to
humid. The existing
residual hills found at
A Monthly Double-Blind Peer Reviewed Refereed Open Access International e-Journal - Included in the International Serial Directories International Research Journal of Natural and Applied Sciences (IRJNAS)
Website: www.aarf.asia. Email: [email protected] , [email protected] Page 86 (for example Phooldungri) and some trees (like Cactus, which are found near Rajbari) are proved this type of climatic change.
A Monthly Double-Blind Peer Reviewed Refereed Open Access International e-Journal - Included in the International Serial Directories International Research Journal of Natural and Applied Sciences (IRJNAS)
Website: www.aarf.asia. Email: [email protected] , [email protected] Page 87 to prolong survive since Paleozoic era, are the examples of once presence of arid climate in the area (plate no.3).
Terrain evolution and profile analysis:
The worker has derived the DEM (Digital Elevation Model) surface of the study area based on contour value (Figure no.4) (Toposheet 73J/6, 1:50000 scale, contour interval-10m). Figure
A Monthly Double-Blind Peer Reviewed Refereed Open Access International e-Journal - Included in the International Serial Directories International Research Journal of Natural and Applied Sciences (IRJNAS)
Website: www.aarf.asia. Email: [email protected] , [email protected] Page 88
Superimposed profile helps us to determining the different levels of ground surfaces. It is evident from
figure-6a that there are five ground surfaces in the Kankuram basin.
Projected profiles (figure-6b) provide a panoramic view of the whole landscape of the region as if seen from above and they also present a vivid picture of the
magnitude of relief and general nature of dissection of the region.
A Monthly Double-Blind Peer Reviewed Refereed Open Access International e-Journal - Included in the International Serial Directories International Research Journal of Natural and Applied Sciences (IRJNAS)
Website: www.aarf.asia. Email: [email protected] , [email protected] Page 89 Morphometric analysis:
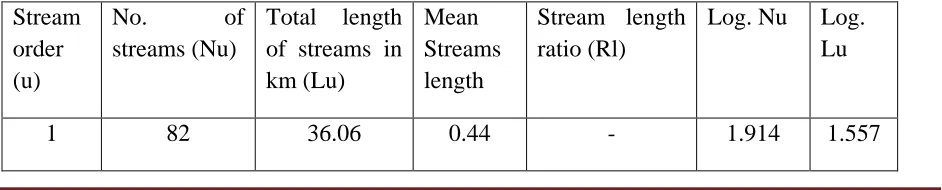
Linear aspects of the basin (Table no.2):
Stream Order (u): Stream order of drainage basin is the successive assimilation ofthe streams within a drainage basin. The
term stream order was first introduced by Horton (1932, 1945) for the procedure of stream ordering. Later, Strahler modified the Horton’s law of ordering. Here I have followed modified Horton’s law of ordering. The smallest fingertip tributaries are designated as order 1st. where the two
A Monthly Double-Blind Peer Reviewed Refereed Open Access International e-Journal - Included in the International Serial Directories International Research Journal of Natural and Applied Sciences (IRJNAS)
Website: www.aarf.asia. Email: [email protected] , [email protected] Page 90 order channels join, a channel segment of 2nd order is formed and so forth. The Kankuram River Basin is a 4th order river basin (Figure no.7) which denotes the heterogeneous rock character of the area.
Stream Length (Lu):Stream length is measured from the farthest drainage divide to the mouth of a river, based on the law proposed by Horton (1945).Stream length of the basin indicates surface runoff characteristics. Streams of relatively smaller lengths indicate that the area is with high
A Monthly Double-Blind Peer Reviewed Refereed Open Access International e-Journal - Included in the International Serial Directories International Research Journal of Natural and Applied Sciences (IRJNAS)
Website: www.aarf.asia. Email: [email protected] , [email protected] Page 91 16.35%, third order stream segments are 4 and accounted 3.85%, fourth order stream segments are 1 and account for 0.96%.The logarithm of stream length of each order as a function of order is plotted and yields a set of points lying generally along a straight line. Relation between stream order (u) and stream numbers (Nu) shows the straight line which indicates area with structural disturbance. (Figure no.9)
Mean Stream Length (Lsm):
Mean stream length (Lsm) is a characteristic property related to the drainage network components and its associated basin surfaces (Strahler, 1964). This has been calculated by dividing the total stream length of order (u) by the number of streams of segments in that order. It is seen that Lsm values exhibit variation from 0.44 to 5.15. This deviation might be due to change in topographic elevation and slope of the basin.
Stream Length Ratio (Rl):
The ratio in between the average lengths of successive orders is stream length ratio. Total stream length of a given order is inversely related to stream order, i.e., total stream length decreases from the lower order to the successively higher orders. This change might be attributed to variation in slope and topography, indicating the youth stage of geomorphic development in the streams of the study area (Singh and Singh, 1997 and Vittala et al., 2004).Stream Length Ratio of Kankuram River basin is given in Table-2.
Bifurcation Ratio (Rb):
A Monthly Double-Blind Peer Reviewed Refereed Open Access International e-Journal - Included in the International Serial Directories International Research Journal of Natural and Applied Sciences (IRJNAS)
Website: www.aarf.asia. Email: [email protected] , [email protected] Page 92
Areal aspect of the basin (Table no.4):In Quantitative Geomorphology, Area of basin (A) and Perimeter (P) are the important parameter. The area of the basin is defined as the total area projected upon a horizontal plane and Perimeter is length of the boundary of the basin. Different parameters of areal aspect arecalculated.
Drainage Density (Dd):Drainage density is defined as a ratio of total length of all streams to the total area of the basin (Horton, 1932). Where, Drainage Density (Dd) = Total Length of the stream of all segments / Total Area of the basin. High Drainage Density value indicates the region having impermeable subsurface or moutainous relief. In Kankuram River basin, the Drainage Density value is 2.70 km/sq.km.
Stream Frequency (Sf):The total number of stream segments of all orders per unit area is known as stream frequency (Horton, 1932).It is a good indicator of drainage pattern. The value of stream frequency of Kankuram River basin is 4.52. High drainage density and high stream frequency in Kankuram River basin indicate larger runoff from the basin.
Shape of Basin:The shape of basin is determined on the basis of computation of parameters such as form factor, circulatory ratio and elongation ratio.
Form Factor (Rf):Horton in 1932 assigned Form Factor as one of the significant index for presenting the hydrological characteristics of the basin. The higher value represent the shape of the basin is circular and the lower value represents the linear shape of the basin. The form factor value of Kankuram basin is 0.28. Which indicates the shape of the basin is elongated, because the value is within the 0.1-0.5 range, which denotes the shape of basin is elongated.
Circulatory Ratio (Rc):Miller (1953) defined a dimensionless circulatory ratio (Rc) as the ratio of basin area to the area of circle having the same perimeter as the basin. He described that the circularity ratios range from 0.4 to 0.5 which indicates strongly elongated and permeable homogenous geologic materials. Circulatory ratio (Rc) is mainly concerned with the length and frequency of streams, geological structures, land use/land cover, climate, relief and slope of the basin. In the study area, the Rc value is 0.42, indicating that the basin is elongated in shape having low discharge of runoff and highly permeability of sub soil conditions.
Elongation Ratio (Re): This is also a significant parameter as suggested by Schumm (1956).This helps to give idea about the hydrological character of a drainage basin. Elongation
A Monthly Double-Blind Peer Reviewed Refereed Open Access International e-Journal - Included in the International Serial Directories International Research Journal of Natural and Applied Sciences (IRJNAS)
Website: www.aarf.asia. Email: [email protected] , [email protected] Page 93 ratio (Re) is the ratio between the diameter of the circle of the same area as the drainage basin and the maximum length of the basin. The value of elongation ratio (Re) can be grouped into three categories, namely circular (>0.9), oval (0.9-0.8) and elongated (< 0.7).The Elongation ratio of the Kankuram river basin is 0.6 which indicate basin is elongated.
Lemniscates Ratio: this index extracted from basin, specially designed by Chorley in 1957 is called Lemniscates Ratio and he suggested the K value on higher limit represents circular shape. The value of Lemniscates Ratio is 0.88 which indicates nearly elongated.
Length of Overland Flow (Lg):The length of overland flow (Lg) approximately equals to half of reciprocal of drainage density (Horton, 1945). It is the length of water over the ground before it gets concentrated into definite stream channels. The length of overland flow (Lg values) of the study area is 1.35, indicating nearly mature topography.
Texture Ratio (Rt):It is the ratio of total stream numbers to the total perimeter of the basin (Horton, 1945). Texture ratio is an important factor in the drainage morphometric analysis which is depending up on the underlying lithology, infiltration capacity and relief aspect of the terrain (Nageswara, 2010). Smith (1950) has classified drainage density into five different texture i.e. very coarse (<2), Coarse (2-4), moderate (4-6), fine (6-8) and very fine (>8). In the present study texture ratio of the Kankuram river basin is 3.14, which indicate coarse texture.
Relief aspects of drainage basin (Table no.5):
A Monthly Double-Blind Peer Reviewed Refereed Open Access International e-Journal - Included in the International Serial Directories International Research Journal of Natural and Applied Sciences (IRJNAS)
Website: www.aarf.asia. Email: [email protected] , [email protected] Page 94
Relative Relief (Rr): Relative relief is defined as the difference between maximum elevation and minimum elevation in a unit
area. Relative relief is classified into 3 categories viz. low relative relief = 0meter to 100meter, moderate relative relief = 100meter to 300meter, high relative relief = above 300meter. In the study area, relative relief value is 480m, which indicate the region has high relative relief
(Figure no. 10b).
Average Slope (As): Using the following formula, as suggested by Wentworth to calculate the average slope of the study area
(Figure no. 10a). tanⱷ = (N × I)/636.6. Where, N = Number of contour crossing per kilometer length, I = contour interval, 636.6 = constant value. The
A Monthly Double-Blind Peer Reviewed Refereed Open Access International e-Journal - Included in the International Serial Directories International Research Journal of Natural and Applied Sciences (IRJNAS)
Website: www.aarf.asia. Email: [email protected] , [email protected] Page 95
Hypsometric Analysis:Hypsometry involves the measurement and analysis of relationship between altitude
and basin area to understand the degree of dissection and stage of cycle of erosion.
Hypsometric
curve is
generally used to
show the
proportion of area of the surface at various
elevations above or below a datum (F.J. Monkhouse and H.R. Wilkinson, 1967) and thus the values of area are plotted as ratios of the total area of the basin against the corresponding heights of the contours. The hypsometric curve (figure no.11, Table no.7) of Kankuram river basin represents that the basin area is under the equilibrium stage and the study area is under the mature stage according to W.M. Davis.
Ruggedness Number (Rn):Ruggedness number is the relation between relief of basin (H) and drainage density (Dd). The ruggedness number of Kankuram river basin is 1296.0 which indicate both relief and drainage density are high. Such higher values are expected in a mountainous region of tropical and sub-tropical climate with higher rainfall (Schumm, 1956). So, the value indicates the study area is under the mountainous sub-tropical climate with higher rainfall.
A Monthly Double-Blind Peer Reviewed Refereed Open Access International e-Journal - Included in the International Serial Directories International Research Journal of Natural and Applied Sciences (IRJNAS)
Website: www.aarf.asia. Email: [email protected] , [email protected] Page 96 Square area (Miller, 1949). The figure- shows the dissection index map of the study area, which represents that the some part of the area is highly dissected and others part of the area is normally or low dissected.
Rejuvenation and river terraces evolution:The entire area of the middle Subarnarekha river area including the Kankuram basin is characterized by the several tectonic activities (Plate no.) and the presence of Singhum Shear Zone enhanced the river cycle as the Kankuram in now flowing in its third cycle. When a channel being in a state of equilibrium or progressive sedimentation changes the rejuvenation (figure no.12a) occurs. The main causes of rejuvenation are uplift of the ground, decrease of sediment load and increase of discharge due to climate change, etc. Various landforms are formed by reactivated channel process.
A Monthly Double-Blind Peer Reviewed Refereed Open Access International e-Journal - Included in the International Serial Directories International Research Journal of Natural and Applied Sciences (IRJNAS)
A Monthly Double-Blind Peer Reviewed Refereed Open Access International e-Journal - Included in the International Serial Directories International Research Journal of Natural and Applied Sciences (IRJNAS)
Website: www.aarf.asia. Email: [email protected] , [email protected] Page 98 Incised River: If a meandering channel has been rejuvenated, a channel begins to under-cut a river bed while keeping a meandering course. As a result, a meandering valley is formed, and the river running in the valley is called an
A Monthly Double-Blind Peer Reviewed Refereed Open Access International e-Journal - Included in the International Serial Directories International Research Journal of Natural and Applied Sciences (IRJNAS)
Website: www.aarf.asia. Email: [email protected] , [email protected] Page 99 has created terrace due to rejuvenation, in this circumstances it may be say that the river has been under-cut the river bed and formed incised river (Plate no.5).
Channel pattern:We are all known that the channel pattern of a river is mainly 2 types. This is
Single channeland multiplechannels. These two types of channel pattern further sub-divided.Single channel means one river and Multiple channel means including bar, two or more channel. So, the river Kankuram is a Single channel. Sinuosity index are two types, which are i) CSI (Channel Sinuosity Index) which calculate by Actual length of channel reach/same channel straight length of channel reach. And other one is ii) VSI (Valley Sinuosity Index) which calculated by Actual length of valley of channel/same channel straight length of channel reach. I considered CSI value to find the channel pattern. If CSI value is 1-1.10 or less than 1 then it becomes straight channel. When CSI value 1.10-1.5, it becomes sinuous
A Monthly Double-Blind Peer Reviewed Refereed Open Access International e-Journal - Included in the International Serial Directories International Research Journal of Natural and Applied Sciences (IRJNAS)
A Monthly Double-Blind Peer Reviewed Refereed Open Access International e-Journal - Included in the International Serial Directories International Research Journal of Natural and Applied Sciences (IRJNAS)
Website: www.aarf.asia. Email: [email protected] , [email protected] Page 101 Upper segment: If we are considered upper segment river then the channel length is 1.64 kilometer and straight length of channel is 1.57 kilometer. So, sinuosity index value of the upper segment river is 1.01 which indicates that the upper part of the river is a straight channel river.
Middle segment: In middle segment, the channel length is 3.08 kilometer and straight length is 2.58 km. The Sinuosity index value is 1.19 which indicates the channel is a sinuous.
Lower segment: In lower segment, the channel length is 6.25 kilometerand the straight length is 4.71 km. The Sinuosity Index value of lower segment channel is 1.33. It also indicates that the channel pattern of lower segment is Sinuous. In overall view of 3 segments, it represents that the upper segment channel is straight, middle and lower segment is sinuous. Because the middle and lower part of the river is alluvial part also than upper part. And the upper is largely controlled by structure than middle and lower. The figure-14 shows the channel pattern of various segments. A micro level study was conducted to understand the meandering pattern of
A Monthly Double-Blind Peer Reviewed Refereed Open Access International e-Journal - Included in the International Serial Directories International Research Journal of Natural and Applied Sciences (IRJNAS)
Website: www.aarf.asia. Email: [email protected] , [email protected] Page 102 Kankuram River. Here the channel length is 61.7meter and straight distance is 48.5m, the sinuosity index is 1.27 and amplitude value is 21.15. The SI value indicates that the study area of channel is sinuous. A conceptual diagram represents here to show the micro meander feature in
figure-15.
Drainagepattern and profile analysis: The effects of lithology and rock structure are most evident in the drainage pattern of well-developed drainage basins. Local ground slope and local variation in geology exert an influence on flow direction and drainage-pattern development. (M. Morisawa). The drainage patterns are Dendritic, Rectangular, and Trellised etc. The Kankuram River basin is a dendritic drainage pattern. Dendritic drainage pattern are developed in this area, because the area is fully structurally controlled.
A Monthly Double-Blind Peer Reviewed Refereed Open Access International e-Journal - Included in the International Serial Directories International Research Journal of Natural and Applied Sciences (IRJNAS)
A Monthly Double-Blind Peer Reviewed Refereed Open Access International e-Journal - Included in the International Serial Directories International Research Journal of Natural and Applied Sciences (IRJNAS)
Website: www.aarf.asia. Email: [email protected] , [email protected] Page 104 After draw long profile of Kankuram River (figure no.16), we have find the 2 break-of-slope on 150m contour and 250meter contour, which indicate the 3 segment of the river. In confluence we have also be seen that suddenly contour interval decrease here, normally it not be seen.
A fault line is present at confluence of Kankuram River between two micro plates. Due to endogenetic force the fault has been formed here, and due to formed fault at confluence the waterfalls (Plate no.6) has formed at confluence of Kankuram River. The figure-17 shows the stages of development of waterfalls at confluence.
A Monthly Double-Blind Peer Reviewed Refereed Open Access International e-Journal - Included in the International Serial Directories International Research Journal of Natural and Applied Sciences (IRJNAS)
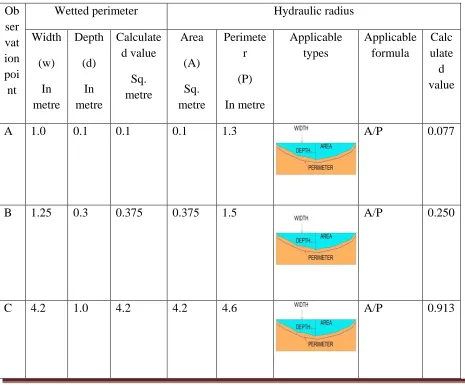
Website: www.aarf.asia. Email: [email protected] , [email protected] Page 105 Regarding the detail cross profile analysis we have considered 11 cross section points and they have selected on the basis of its hydrological units, two from upper part, three from middle and
six from lower part of the basin.
Upper segment:
Two cross profile (point- A and B) draw in this segment, which
represents the valley shape is nearly ‘V’ shaped valley (Plate no.7). And
the channel width and depth is very narrow. This type of feature formed
due to structurally controlled.
A Monthly Double-Blind Peer Reviewed Refereed Open Access International e-Journal - Included in the International Serial Directories International Research Journal of Natural and Applied Sciences (IRJNAS)
Website: www.aarf.asia. Email: [email protected] , [email protected] Page 106
Near the 250meter contour or upper break-of-slope, three cross profile (point- C, D, and E) has been
drawn. These cross profile also represent that the terraces are formed here, and slope is moderate, channel depth and width is increased, hydraulic radius and weighted perimeter also increased and one
paleo-channel (Plate no.8) is formed here.
Generally in middle part of the basin have more number of 1st order streams with rills and gullies and also have huge water volume capacity than upper part of the basin. And also volume of discharge of water is high than upper part. In this cause, here the channel width and depth is increase than upper part of the basin.
Lower segment:
A Monthly Double-Blind Peer Reviewed Refereed Open Access International e-Journal - Included in the International Serial Directories International Research Journal of Natural and Applied Sciences (IRJNAS)
Website: www.aarf.asia. Email: [email protected] , [email protected] Page 107 segment (point-F) have width & depth is also high than middle and upper segment. But the lower part of the lower segment (near confluence), there have very low depth of water and channel width is very high and it is the widest part of the channel in respect to the whole Kankuram River. The channel has divided into two parts at lower portion of the lower segment (near confluence) and it cover some distance and go through the direction of mouth and then it is meet together once.
Concluding remarks:
The afforest research represent the detail study of fluvial channel morphology with its surrounding terrain evolution of the Kankuram River basin. It is very significant to find that the value of hydraulic radius is considerable changes with its terrain character not in normal way but it represents complex channel variability from source to mouth. This channel morphology has influenced the land use pattern in applied sense. The changing nature of land use shows the development of agricultural land over those areas. Where the water is available for irrigation, i.e. Purnapani area but the lower & upper part shows the opposite view due to the minimization water availability as the lowest value of wetted perimeter, it is also viewed that near Purnapani the slope value is low but near mouth the sudden change of break-of –slope in 12m has made the area bowel shaped, because of which all the seepage water is concentrated which leads to the proper development of agricultural area.
Acknowledgement
A Monthly Double-Blind Peer Reviewed Refereed Open Access International e-Journal - Included in the International Serial Directories International Research Journal of Natural and Applied Sciences (IRJNAS)
Website: www.aarf.asia. Email: [email protected] , [email protected] Page 108 References:
Journals:
Sarkar, A., & Patel, P. P. (2012).Terrain Classification of the Dulung Drainage Basin.eTraverse:The Indian Journal of Spatial Science, Vol. III No.1, Article 6.
Tiwari, K., &Khandur, K. (2011). Land Use / Land cover change detection in Doon valley (Dehradun Tehsil), Uttarakhand: using GIS& Remote Sensing Technique. INTERNATIONAL
JOURNAL OF GEOMATICS AND GEOSCIENCES, Vol. II.
Books:
Billings, M. P. (2011). Structural Geology (3rd ed.). Phi Learning. Brady, N.C. (1922). The Nature and Properties of Soil. Macmillan.
Charlton, R. O. (2007). Fundamentals of Fluvial Geomorphology.Routledge.
Critchfield, H. J. (2009). General Climatology (4th ed.). Phi Learning.
Das, N. G. Statistical Methods.Tata Macgraw Hill.
Ghosh, S. (1998).Rural Settlements. Orient Longman Limited.
Hackett, W. R. (2009). CHANGING LAND USE, CLIMATE, AND HYDROLOGY IN THE WINOOSKI RIVER BASIN, VERMONT.University of Vermont, Department of Geology. Vermont: University of Vermont.
Leopold, L. B., Wolman, M. G., & Miller, J. P. (1964).Fluvial processes in Geomorphology.Freemen, San Fransisco, Calif.
Morisawa, M. E. (1974). Streams.Macgraw Hill.
Mukhopadhyay, S. C. (1980). Geomorphology of the Subarnarekha basin,theChota Nagpur Plateau.The University of Burdwan.
Ollier, C. G. (1974). Weathering. (K. M. Clayton, Ed.) English Language Group Society &Longman Group limited.
Sharma, R. S. (2009). CratonsAnd Fold Belts of India.Springer.
Singh, S. (1998).Geomorphology.PrayagPustakBhawan.
Summerfield, M. A. (1991). Global Geomorphology. Pearson Education Limited.
A Monthly Double-Blind Peer Reviewed Refereed Open Access International e-Journal - Included in the International Serial Directories International Research Journal of Natural and Applied Sciences (IRJNAS)
Website: www.aarf.asia. Email: [email protected] , [email protected] Page 109 Wadia, D. N. (1999).Geology of India.Macmillan Publisher.
Table Number.1 Geological time scale with stratification of rocks and succession of Climate
A Monthly Double-Blind Peer Reviewed Refereed Open Access International e-Journal - Included in the International Serial Directories International Research Journal of Natural and Applied Sciences (IRJNAS)
Website: www.aarf.asia. Email: [email protected] , [email protected] Page 110
ERA PERIOD EPOCH
AGE
(million years ago)
CLIMATE EARTH
MOVEMENT
Cenozoic
Quaternary Recent
Pleistocene
Pliocene
1 to 10
Continued cooling
Tertiary earth movements (Epeirogenetic )
Tertiary Miocene
Oligocene Eocene 25 40 60 Cold+Semi-arid Warm+Humid Cold+Warm
Pliocene 70 Humid + Semi arid
Fluctuating, Very
warm
Epeirogenic Triassic Uplift Mesozoic
Cretaceous Upper Lower 125
Jurassic Upper
Middle
Lower
150
Warm
Triassic Upper
Middle
Lower
180
Warm + Semi arid
Paleozoic Permian (Glaciation) Upper Lower 205
Dry Harcynian
Earth Movement (Faulted Damodar Epeirogenetic) Carboniferous (Coal- age) Upper Lower 255
A Monthly Double-Blind Peer Reviewed Refereed Open Access International e-Journal - Included in the International Serial Directories International Research Journal of Natural and Applied Sciences (IRJNAS)
[image:33.612.71.542.609.704.2]Website: www.aarf.asia. Email: [email protected] , [email protected] Page 111 Table Number.2 Linear Aspects of the Kankuram basin.
Stream order (u)
No. of
streams (Nu)
Total length of streams in km (Lu)
Mean Streams length
Stream length ratio (Rl)
Log. Nu Log. Lu
1 82 36.06 0.44 - 1.914 1.557
Devonian
Upper
Middle
Lower
315
Arid + Semi arid
Silurian
Upper
Middle
Lower
350
Arid + Semi arid
Ordovician Upper
Middle
Lower
430
Dry
Cambrian Upper
Middle Lower 510 Warm temperate Archeozoic Precambrian (Glaciation) Upper Middle Lower 700 1100 1500
Dry + cold
Archean Earth Movements
Earth’s Crust 3000 to
A Monthly Double-Blind Peer Reviewed Refereed Open Access International e-Journal - Included in the International Serial Directories International Research Journal of Natural and Applied Sciences (IRJNAS)
Website: www.aarf.asia. Email: [email protected] , [email protected] Page 112
2 17 18.2276 1.07 2.43 1.230 1.261
3 4 2.7927 0.70 0.65 0.602 0.4460
[image:34.612.74.520.218.328.2]4 1 5.1449 5.15 7.36 0 0.711
Table Number.3 Bifurcation ratio o of the Kankuram basin.
Order Bifurcation Ratio (Rb) Mean Bifurcation Ratio
1st order / 2nd order 4.824 4.358
2nd order / 3rd order 4.25
3rd order / 4th order 4
Table Number.4 Areal Aspects of the Kankuram basin
SL. No.
Morphometric Parameters Symbol / Formula Calculated value
Remarks
1 Area (sq. km) A 23.0086 -
2 Perimeter (km) P 26.149 -
3 Basin Length (Lb) Lb 9.014 -
4 Drainage Density (Dd) Dd = Lu/A 2.70 -
5 Stream Frequency (Sf) Sf = Nu/A 4.52 -
6 Texture Ratio (Rt) Rt = N1/P 3.14 -
7 Elongation Ratio (Re) Re = (2√A/∏)/Lb 0.601 Elongated 8 Circulatory Ratio (Rc) Rc = 4∏A/P² 0.423 Elongated
9 Form Factor Ratio (Rf) Rf = A/Lb² 0.283 Elongated
A Monthly Double-Blind Peer Reviewed Refereed Open Access International e-Journal - Included in the International Serial Directories International Research Journal of Natural and Applied Sciences (IRJNAS)
Website: www.aarf.asia. Email: [email protected] , [email protected] Page 113
[image:35.612.68.524.137.280.2] [image:35.612.68.533.324.709.2]11 Lemniscate Ratio Lb²/4A 0.883 Sub-circular
Table Number.5 Relief Aspects of the Kankuram basin.
SL. No. Morphometric Parameters Symbol / Formula Calculated value
1 Basin Relief in metre (RR) Max. elevation- Min. elevation
570-90 = 480
2 Relief Ratio (Rh) Rh = RR/ Lb 53.25
3 Ruggedness Number (Rn) Rn = RR×Dd 1296.0
Table Number. 6: Weighted perimeter and hydraulic radius of Kankuram River.
Ob ser vat ion poi nt
Wetted perimeter Hydraulic radius
Width (w) In metre Depth (d) In metre Calculate d value Sq. metre Area (A) Sq. metre Perimete r (P) In metre Applicable types Applicable formula Calc ulate d value
A 1.0 0.1 0.1 0.1 1.3 A/P 0.077
B 1.25 0.3 0.375 0.375 1.5 A/P 0.250
A Monthly Double-Blind Peer Reviewed Refereed Open Access International e-Journal - Included in the International Serial Directories International Research Journal of Natural and Applied Sciences (IRJNAS)
Website: www.aarf.asia. Email: [email protected] , [email protected] Page 114
D 5 1.2 6 6 5.45 A/P 1.101
E 4.5 0.5 2.25 2.25 4.720 A/P 0.477
F 13.3 1.125 14.963 14.963 15.2 A/P 0.984
G 13.3 0.7 9.31 9.31 14.8 A/P 0.629
H 17.1 1.45 24.795 24.795 20 A/P=b.y/b
+2.y
1.240
I 3.9 0.16 0.624 0.624 4.2 A/P 0.149
J 3.7 0.23 0.851 0.851 3.9 A/P 0.218
A Monthly Double-Blind Peer Reviewed Refereed Open Access International e-Journal - Included in the International Serial Directories International Research Journal of Natural and Applied Sciences (IRJNAS)
Website: www.aarf.asia. Email: [email protected] , [email protected] Page 115 ELEVATION IN
(m) h/H AREA IN (sq. km.) a/A
100 0 9.636 1
200 0.25 6.777 0.703300125
300 0.5 4.433 0.460045662
400 0.75 1.493 0.154939809
500 1 0.059 0.006122873
LIST OF FIGURES
Figure no.1: Location of the Study Area.
Figure no.2: Detail geological map of the entire area.
Figure no.3: 3D DEM model of the Basin area.
Figure no.4: Contour pattern of the basin.
Figure no.5: Relief character of the surrounding area.
Figure no.6a: Superimposed Profile of the basin.
6b: Projected profile of the basin.
6c: Composite profile of the basin.
Figure no.7: Stream Order of Kankuram River basin.
Figure no.8: Relation between Stream Order (u) and Mean Stream Length (Lu).
Figure no.9: Relation between Stream Order (u) and Mean Stream Numbers (Nu).
Figure no.10a: Average Slope map of the basin.
10b: Relative Relief map of the basin.
Figure no.11: Hypsometric Curve.
Figure no.12a: Conceptual diagram of Rejuvenation process.
A Monthly Double-Blind Peer Reviewed Refereed Open Access International e-Journal - Included in the International Serial Directories International Research Journal of Natural and Applied Sciences (IRJNAS)
Website: www.aarf.asia. Email: [email protected] , [email protected] Page 116 Figure no.13: Channel pattern of Kankuram Basin.
Figure no.14: Shows the channel pattern of various segments of the Kankuram River.
Figure no.15: Conceptual diagram of Micro-level meandering feature.
Figure no.16: Details of Long profile representation with its minor breaks.
Figure no.17: Conceptual diagram presenting the process of break near confluence.
A Monthly Double-Blind Peer Reviewed Refereed Open Access International e-Journal - Included in the International Serial Directories International Research Journal of Natural and Applied Sciences (IRJNAS)
Website: www.aarf.asia. Email: [email protected] , [email protected] Page 117 LIST OF PLATES
Plate no.1: Mafic lava in Dalma hills.
Plate no.2: Fuldungri, such kind of Erosional hill.
Plate no3: Evidence of Past Arid climate.
Plate no.4: Three numbers of terraces has been seen in Kankuram River.
Plate no.5: Incised River.
Plate no.6: 7m Height at break-of-slope near confluence.
Plate no.7: V-shaped valley in the upper part of Kankuram Basin.
Plate no.8: Paleo-channel.
Plate no.9: Deepest part of Kankuram River at Purnapani.
Plate no.10: Low depth of water and it is the widest part of the channel.
LIST OF TABLES
Table no.1: Geological time scale with stratification of rocks and succession of climate
(After S.C. Mukhopadhyay, 1980).
Table no.2: Linear aspects of the Kankuram basin.
Table no.3: Bifurcation ratio of the Kankuram basin.
Table no.4: Areal Aspects of the Kankuram basin.
Table no.5: Relief Aspects of the Kankuram basin.
Table no.6: Weighted perimeter and Hydraulic radius of Kankuram River.