Currently, supplemental parameters for estimat-ing phosphorus in soils obtained with static and kinetic methods are often used (Macháček 1999). Evaluating phosphorus dynamics in soils is impor-tant for obtaining deeper insight into phosphorus transformations in soils in dependence on their properties. Different methods can be used for a long-term characterisation of phosphates releas-ing processes from soil matrix to the soil solution (McGechan 2002). Evaluating dynamic indices is an ideal variant for estimating fertiliser amounts needed (e.g. sewage sludge) (Barry et al. 1995).
For the realization of these methods we start from several basic parameters: intensity – I – level of instantaneous phosphorus availability to the plants. Extraction with 0.01M CaCl2 or solution of other weak salts are most commonly used. Furthermore, electroultrafiltration is sometimes
used (Self-Davis et al. 2000). The intensity can be only calculated on the basis of the phosphorus buffering capacity (BC).
The phosphorus buffering capacity is also termed differential, phosphate and equilibrium capac-ity. It can be defined as the capability of a soil to compensate concentration changes of differ-ent phosphorus forms (Hartikainen 1991). These data are commonly used to evaluate phosphorus amount that is desorbed by dilution of solution, but not phosphate, which is bound through slow and strong sorption (McGechan and Lewis 2002). Total BC is calculated from adsorption-desorption dependence as a portion of change of quantity (∆Q) and intensity (∆I). The advantage when us-ing these relations is that it is possible to predict the sorption and mobilisation of phosphorus in soils (Morel et al. 1996) and to more accurately
Evaluating of phosphorus quantity/intensity parameters
in soil with different systems of organic fertilising
M. Kulhánek
1, J. Balík
1, J. Černý
1, K. Schweitzer
2, V. Vaněk
1, M. Prášilová
11
Czech University of Life Sciences in Prague, Prague, Czech Republic
2Humboldt Universität zu Berlin, Berlin, Germany
ABSTRACT
One of the refinement methods for estimating the parameters of phosphorus dynamics in soil is the construction of sorption isotherms in dependence on changes of exchangeable sorbed phosphorus in soil (∆Q) and changes of phosphorus amount in soil solution (∆I). Regression analysis allows to calculate equilibrium concentration (cequ) and phosphorus buffering capacity (BC). The mentioned analyses were realised on soils from the long-term field ex-periments of the Czech University of Life Sciences (CULS) in Prague and Crop Research Institute (CRI) in Ruzyně, Czech Republic. The influence of different organic fertilisers compared to the control (not amended) treatment was tested. For the evaluating of parameters, the root and logarithmic functions were used. The lowestcequ of the loga-rithmic function was always found on not amended treatment. Low amounts were found in the treatments amended with barley straw as well. The highest amounts were found in soil after potatoes cropping fertilised with farmyard manure (FYM). In the FYM variant fertilised with 70 kg P/ha, the cequ value reached 0.45 mg P/l. Both treatments fertilised with sewage sludge (720 kg P/ha and 240 kg P/ha) showed similar values of about 0.25 mg P/l. A different trend was found for the phosphorus buffering capacity (BC); this was the highest at the control treatment and at the treatment fertilised with straw. The lowest BC was observed in both soils after potatoes fertilised with FYM, where it reached 61 mg P/kg and 65 mg P/kg, respectively. Similar trends were found when evaluating root function.
Keywords: long-term experiments; soil; phosphorus dynamics; equilibrium concentration; buffering capacity
evaluate phosphorus availability in soils in com-parison with other methods estimating available phosphorus (Hartikainen 1991).
The most commonly used methods for evaluating phosphorus dynamics in soils are the adsorption-desorption isotherms (Fox and Kramparth 1970). They are usually used to correct obtained data on adsorption of phosphorus and other reactive solu-tions. Some formulas are calculated with nonlinear relations (Chien and Clayton 1980, McGechan and Lewis 2002, Eckholm et al. 2005). They are defining an immediate effort to reach equilibrium in their simplest form, but they can be modified to describe the time dependent approximation of equilibrium.
MATERIAL AND METHODS
The long-term field experiment was based on experimental fields of CULS and CRI in Prague-Ruzyně, Czech Republic. The characteristic of the sites is given in Table 1.
Potatoes (cv. Karin), winter wheat (cv. Samanta) and spring barley (cv. Akcent) were cropped in crop rotation on small plots (60 m2). Maize (hybrid
Rivaldo) was cropped instead of potatoes on the site Červený Újezd. Organic fertilisers were applied only to the first crop in crop rotation. Because
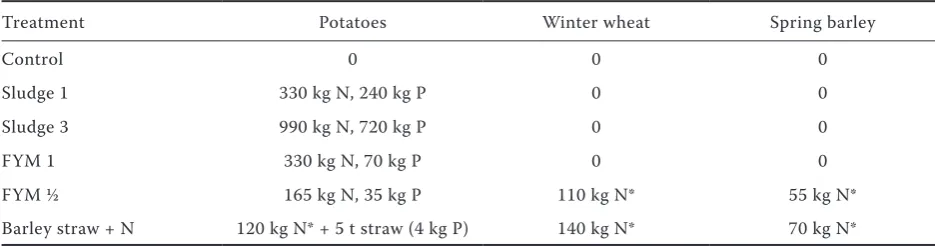
of that, the direct influence of organic fertilisers application could be observed on potatoes and maize. On winter wheat and spring barley it was possible to observe the consequential influence. The amounts of phosphorus in different treatments are summarised in Table 2. For this experiment, sewage sludge from wastewater treatment plant in Prague was used. Barley straw is always ploughed in before potatoes and maize cropping.
The whole system of fertilising is based on the uniform ratio of 330 kg N/ha per 3 years. That applies for organic and mineral fertilisers or their combinations. Only to the sludge 3 treatment 990 kg N/ha per 3 years was added in the form of sewage sludge.
[image:2.595.62.534.473.580.2]The modified methodology of Self-Davis et al. (2000) was used for the analysis. The stock solu-tion consisted of 0.01M CaCl2. Different amounts of phosphorus in the form of KH2PO4 were added to the solution so that the resulting gradient of extractants had a phosphorus concentration of 0, 1, 2, 3, 4, 6, 8, 10 mg P/l. Five g of the sample was used for the extraction. An amount of 50 ml of the extraction solution was added to each sample. Each sample was also extracted with all of the mentioned phosphorus concentrations. After 120 min of shak-ing the samples were filtered and the content of phosphorus was measured spectrophotometrically using the SKALAR SANPLUS SYSTEM.
Table 1. Characteristic of experimental fields
Site Altitude (m) Mean yearly Soil type Soil sort pH (CaCl2)
rainfall (mm) temperature (°C)
Červený Újezd 410 493 7.7 luvisol loam 6.5
Hněvčeves 265 573 8.2 luvisol silty loam 5.9
Humpolec 525 665 7.0 cambisol sandy loam 5.1
Lukavec 610 666 7.7 cambisol sandy loam 5.3
Table 2. System of fertilising of the long-term field experiment (amount of added nutrients per ha)
Treatment Potatoes Winter wheat Spring barley
Control 0 0 0
Sludge 1 330 kg N, 240 kg P 0 0
Sludge 3 990 kg N, 720 kg P 0 0
FYM 1 330 kg N, 70 kg P 0 0
FYM ½ 165 kg N, 35 kg P 110 kg N* 55 kg N*
Barley straw + N 120 kg N* + 5 t straw (4 kg P) 140 kg N* 70 kg N*
[image:2.595.63.531.620.743.2]RESULTS AND DISCUSSION
An increasing trend with a higher amount of phosphorus added in organic fertilisers was found when evaluating phosphorus intensity in soil so-lution estimated with 0.01M CaCl2. The average amount of phosphorus in the soil solution at the control treatment was only 0.09 mg P/l while at the sludge 3 treatment 0.2 mg P/l. Almost the same results as at the control treatment were reached at both treatments fertilised with farmyard ma-nure, where the content ranged about 0.17 mg P/l. Similar results at the treatments fertilised with farmyard manure were reached in the work by Kulhánek et al. (2007), where the concentrations of phosphorus in soil was 1.4 mg P/l, which results in an intensity of 0.14 mg P/l.
For the construction of sorption isotherms the amount of phosphorus bounded on hard phase of soil Q (mg P/kg) was used. It was calculated as a difference between the amount of added phos-phorus and the amount of phosphos-phorus measured in the extract. Two basic functions were used for the formation of sorption isotherms. One of them was the root function (1) and the second logarithmic regression (2):
∆Q = a√∆I + b (1)
∆Q = aln(∆I) + b (2)
The high coefficients of determination R2 were
reached for both of them. That shows a very close relationship between ∆Q and ∆I. This relationship was described in many works (Fox and Kramparth 1970, Barrow 1983, Okajima et al. 1983). McGechan and Lewis (2002) described usage of the logarith-mic function while Schweitzer et al. (2005) used the root function.
Parameters a and b were calculated from the form of the isotherms. Then, the equilibrium capac-ity cequ was calculated, when ∆Q reached 0. The
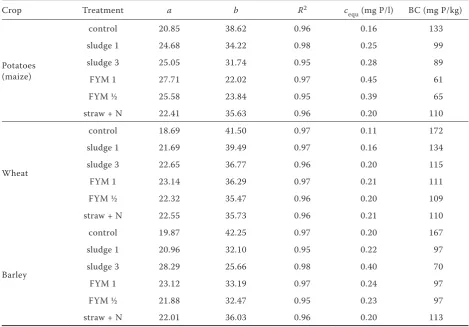
cequ value is also the intensity of phosphorus in soil solution, where the equilibrium between soil solution and exchangeable sorbed phosphorus is reached. Then, the phosphorus buffering capacity was calculated. That means the possibility of soil to equalise the changes of phosphorus concentrations in soil solution. BC was calculated as a portion of a/cequ. The results are summarised in Table 3.
From Table 3 is clear that the lowest cequ after harvest of all crops was calculated in the soil at the control treatment. In the soil after the harvest of potatoes the concentration of phosphorus was
estimated at 0.16 mg P/l, after wheat 0.11 mg P/l and after barley 0.20 mg P/l. Low contents were also found in the treatment fertilised with barley straw (5 kg P/ha added). Here the values ranged from 0.20 to 0.23 mg P/l. The obtained results suggest that in nonfertilised treatments and treat-ments fertilised with low amounts of phosphorus at equilibrium, phosphorus concentration in soil solution is low. It means, that only a low amount of phosphorus is plant-available.
Interesting results were obtained at the treat-ments fertilised with sewage sludge. Great dif-ferences were found especially in samples after the harvest of potatoes. In both treatments fer-tilised with sewage sludge lower values of cequ were obtained, compared to the treatments fertilised with farmyard manure. At the sludge 3 treatment (720 kg P/ha) the cequ was 0.28 mg P/l and only 0.26 mg P/l at the sludge 1 treatment (240 kg P/ha). Thus, at the FYM 1 treatment (70 kg P/ha) the
cequ was 0.45 mg P/l and at the FYM ½ treatment (35 kg P/ha) 0.39 mg P/l. Therefore, sewage sludge is a smaller source of readily available phosphorus in comparison with farmyard manure. One of the possible explanations is that with the application of sewage sludge into the soil, high amounts of Fe and Al oxides are added. These oxides are ad-sorbing phosphorus leading to the non-available form. Soil solution also contained lower amounts of readily available phosphorus. The same results were obtained by McDowell et al. (2003).
The highest phosphorus buffering capacity (BC) was always measured at the control treatments. Therefore, nonfertilised soils have the highest abil-ity to sorb phosphorus added to soil. Phosphorus concentrations reached 133 mg P/kg in soil after potatoes cropping, 132 mg P/kg after wheat and 167 mg P/kg after barley. High values were cal-culated at the treatments fertilised with barley straw (5 kg P/ha) as well. Here, almost the same results were obtained at all treatments. The values ranged from 110 to 113 mg P/kg.
influence of fertilising with pig and cattle slurry on the BC. With increasing ratio of fertilisers they also obtained decreasing BC.
When observing the subsequent influence of organic fertilisers to other crops the differences between the sewage sludge and farmyard manure were almost identical. The lowest differences were obtained after the harvest of wheat where the BC values ranged between 109 and 134 mg P/kg. The low differences were also calculated in the soil after the harvest of barley, where the same BC of 97 mg P/kg at the sludge 1, FYM 1 and FYM ½ treatments were found.
The root function was relatively low and accu-rate. Lower coefficients of determinance R2 were
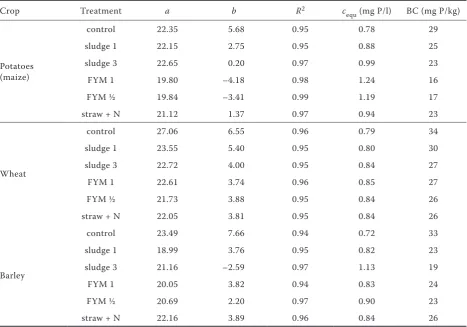
calculated; however, the greatest disadvantage of this method was that this function was not accu-rate especially in the lower parts of the figures. This part is the most important for estimating the equilibrium concentration. The results from the root function are summarised in Table 4.
The trend of evaluating the cequ with the root func-tion was very similar with the logarithmic funcfunc-tion. The lowest values were also found at the control
treatments. The values calculated were 0.79 mg P/l after the harvest of potatoes, 0.78 mg P/l after wheat and 0.72 mg P/l after barley, which means the values of about 0.5 mg P/l higher then the values computed with the logarithmic function.
At the other treatments the same trend was observed. The highest cequ values were obtained in soils after the harvest of potatoes. Here the cequ
reached 1.24 mg P/l at the FYM 1 treatment fer-tilised with 70 kg P/ha and 1.19 mg P/l at the half ratio of farmyard manure (FYM ½). In comparison with the sludge 1 (240 kg P/ha) and sludge 3 treat-ments (720 kg P/ha) the values were higher of about 0.31 mg P/l and 0.25 mg P/l, respectively.
A similar value as at the control treatment was observed in the soil after the harvest of wheat at the sludge 1 treatment. Otherwise, at the other treatments almost the same results between 0.84 and 0.85 mg P/l were obtained.
[image:4.595.62.532.79.406.2]From the results of soil analysis after the harvest of barley it is clear that the highest cequ was at the sludge 3 treatment, where it reached 1.13 mg P/l. There were no significant differences found be-tween other treatments.
Table 3. Characteristics of sorption parameters estimated with the logarithmic function
Crop Treatment a b R2 c
equ(mg P/l) BC (mg P/kg)
Potatoes (maize)
control 20.85 38.62 0.96 0.16 133
sludge 1 24.68 34.22 0.98 0.25 99
sludge 3 25.05 31.74 0.95 0.28 89
FYM 1 27.71 22.02 0.97 0.45 61
FYM ½ 25.58 23.84 0.95 0.39 65
straw + N 22.41 35.63 0.96 0.20 110
Wheat
control 18.69 41.50 0.97 0.11 172
sludge 1 21.69 39.49 0.97 0.16 134
sludge 3 22.65 36.77 0.96 0.20 115
FYM 1 23.14 36.29 0.97 0.21 111
FYM ½ 22.32 35.47 0.96 0.20 109
straw + N 22.55 35.73 0.96 0.21 110
Barley
control 19.87 42.25 0.97 0.20 167
sludge 1 20.96 32.10 0.95 0.22 97
sludge 3 28.29 25.66 0.98 0.40 70
FYM 1 23.12 33.19 0.97 0.24 97
FYM ½ 21.88 32.47 0.95 0.23 97
straw + N 22.01 36.03 0.96 0.20 113
Compared to the logarithmic function, the ob-tained BC was significantly lower. With decreasing
cequ BC increased again. Therefore, the highest values were reached at the control treatment where the BC in the soil after the harvest of potatoes reached 29 mg P/kg, after wheat 34 mg P/kg and after barley 33 mg P/kg.
The lowest BC was obtained in the soils after the harvest of potatoes fertlilised with farmyard manure. No significant differences were found between the results after the harvest of wheat. The level of BC in the soils after the harvest of barley was significantly lower only at the treatment sludge 3.
From the results obtained it is clear that us-ing the logarithmic and root function resulted in a similar trend for cequ and BC. Due to the form of the isotherms, the logarithmic function seems more suitable.
Farmyard manure used before sowing of potatoes appeared to be the most effective fertiliser from the point of view of cequ and BC. Despite of this, the lowest values of cequ and the highest values of BC were reached at the treatments fertilised with straw and at the control treatments. In the case of
straw, cequ and BC was influenced by the low con-tent of phosphorus that was added to the soil and by biological immobilisation of phosphorus.
REFERENCES
Anderson R., Wu Y. (2001): Phosphorus quantity-in-tensity relationships and agronomic measures of P in surface layers of soil from a long-term slurry experi-ment. Chemosphere, 42: 161–170.
Barrow N.J. (1983): On the reversibility of phosphate sorption by soils. J. Soil Sci., 34: 751–758.
Barry G.A., Chudek P.J., Best E.K., Moody P.W. (1995): Estimating sludge application rates to land based on heavy metal and phosphorus sorption characteristics of soil. Water Res., 29: 2031–2034.
Chien S.H., Clayton W.R. (1980): Application of Elovich equation to the kinetics of phosphate release and sorption in soil. Soil Sci. Soc. Am. J., 44: 265–268. Eckholm P., Turtola E., Grönroos J., Seuri P., Ylivainio K.
[image:5.595.64.532.84.411.2](2005): Phosphorus loss from different fading systems estimated from soil surface phosphorus balance. Agric. Ecosyst. Environ., 110: 266–278.
Table 4. Characteristics of sorption parameters estimated with the root function
Crop Treatment a b R2 c
equ(mg P/l) BC (mg P/kg)
Potatoes (maize)
control 22.35 5.68 0.95 0.78 29
sludge 1 22.15 2.75 0.95 0.88 25
sludge 3 22.65 0.20 0.97 0.99 23
FYM 1 19.80 –4.18 0.98 1.24 16
FYM ½ 19.84 –3.41 0.99 1.19 17
straw + N 21.12 1.37 0.97 0.94 23
Wheat
control 27.06 6.55 0.96 0.79 34
sludge 1 23.55 5.40 0.95 0.80 30
sludge 3 22.72 4.00 0.95 0.84 27
FYM 1 22.61 3.74 0.96 0.85 27
FYM ½ 21.73 3.88 0.95 0.84 26
straw + N 22.05 3.81 0.95 0.84 26
Barley
control 23.49 7.66 0.94 0.72 33
sludge 1 18.99 3.76 0.95 0.82 23
sludge 3 21.16 –2.59 0.97 1.13 19
FYM 1 20.05 3.82 0.94 0.83 24
FYM ½ 20.69 2.20 0.97 0.90 23
straw + N 22.16 3.89 0.96 0.84 26
Fox R.L., Kramparth E.J. (1970): Phosphate sorption isotherms for evaluating the phosphate requirements of soils. Soil Sci. Soc. Am. Proc., 34: 902–907. Hartikainen H. (1991): Potential mobility of accumulated
phosphorus in soil as estimated by the indices of Q/I plots and by extractant. Soil Sci., 152: 204–209. Kulhánek M., Balík J., Černý J., Nedvěd V., Kotková B.
(2007): The influence of different intensities of phos-phorus fertilising on available phosphos-phorus contents in soils and uptake by plants. Plant Soil Environ., 53: 382–387.
Macháček V. (1999): Availability of phosphorus on the calcareous soils – Actual analytical problem. Agro-chémia, 3: 21–24. (In Czech)
McDowell R.W., Sharpley A.N., Folmar G. (2003): Modi-fication of phosphorus export from an eastern USA catchment by fluvial sediment and phosphorus inputs. Agric. Ecosyst. Environ., 99: 187–199.
McGechan M.B. (2002): Sorption of phosphorus by soil. Part 2: Measurement methods, results and model parameter values. Biosyst. Eng., 82: 115–130. McGechan M.B., Lewis D.R. (2002): Sorption of
phos-phorus by soil. Part 1: Principles, equations and mod-els. Biosyst. Eng., 82: 1–24.
Morel C., Tiessen H., Stewart J.W.B. (1996): Sensitivity to equilibration periods of phosphate sorption and isotopic exchange methods assessing Q/I relation-ships in soils. Soil Sci., 161: 459–467.
Okajima H., Kubota H., Sakuma T. (1983): Hysteresis in the phosphorus sorption and desorption processes in soils. Soil Sci. Plant Nutr., 29: 271–283.
Schweitzer K., Kulhánek M., Balík J. (2005): Inves-tigation of soil specific variability of P sorption parameters in soils on the basis of long-term field experiments in Germany and in the Czech Republic. In: 21st European Regional Conference, Frankfurt (Oder) and Slubice, Germany and Poland. Available at: http://www.zalf.de/icid/ICID_ERC2005/HTML/ ERC2005PDF/Topic_1/Schweitzer.pdf
Self-Davis M.L., Moore P.A., Joern B.C. (2000): De-termination of water- and/or dilute salt-extractable phosphorus. In: Pierzynski G.M. (ed.): Methods of Phosphorus Analysis for Soils, Sediments and Wa-ters. Southern Coop. Ser. Bull. 396, North Carolina State University.
Received on June 20, 2008
Corresponding author:
Ing. Martin Kulhánek, Ph.D., Česká zemědělská univerzita v Praze, Fakulta agrobiologie, potravinových a přírodních zdrojů, Kamýcká 129, 165 21 Praha 6, Česká republika