Developing a Routing Protocol in Wireless Body Area
Networks (WBANs) using Multi-Criteria Decision Making
(MCDM) Methods
Kafaa Almuhammad
Postgraduate Student (M.S) Systems and Computer NetworksDept.
University of Aleppo, Syria
Souheil Khawatmi
Assistant Professor Systems and Computer NetworksDept.
University of Aleppo, Syria
Marwan Ghabally
Assistant Professor Systems and Computer NetworksDept.
University of Aleppo, Syria
ABSTRACT
In this paper, a Stable, Thermal-aware and Energy-efficient routing Protocol (STEP) is proposed for Wireless Body Area Networks (WBANs) that not only deals with the thermal aspects and hot-spots problem but also saves energy and extends the stability period and network lifetime. Direct communication is used for real-time traffic (critical data) while multi-hop communication is used for normal data delivery. In multi-hop communication to achieve minimum power consumption and minimum temperature rise, the proposed protocol has a new cost function using multi-criteria decision making MCDM methods to determine the parent node or the forwarder. These methods provide a flexible decision-making process for selecting the next hop by considering different criteria at the same time. The proposed cost function has three criteria: residual energy, distance to the sink node and temperature. Residual energy criterion balances the energy consumption among the sensor nodes while distance criterion ensures successful packet delivery to the sink node and minimize the energy that will be consumed, the temperature criterion will avoid routing across hot nodes to protect the tissues. The simulation results show that the proposed protocol preserves the energy and increases the network lifetime & stability period so nodes stay alive for a longer period. A longer stability period contributes significantly to the delivery of packets, which is very important for continuous patient monitoring. Results also depict that the proposed protocol can achieve a better balance of the temperature rise comparing to the previous protocols.
Keywords
Wireless Body Area Networks (WBANs), Routing protocols in WBANs, Multi-Criteria Decision Making (MCDM) Methods, AHP method, SMART method, WSNS.
1.
INTRODUCTION
Wireless Body Area Networks (WBANs) are a special class of Wireless Sensor Networks (WSNs) that are used in vivo for many medical applications. Wireless sensors are implanted in the body to monitor vital signs. The use of WBAN technology to monitor health parameters significantly reduces the expenditures of the patient in the hospital. As this technique is applied inside the human body, this means that the work environment is very complex and there are many challenges, including battery replacement and heat generated from implanted sensors. An efficient routing protocol is required to overcome these issues. There are many energy-efficient routing protocols were proposed in WSNs technology. However, WSNs and WBANs have different architectures,
applications and operate in different conditions, so it is impossible to port WSNs routing protocols to WBANs. The rest of the paper is organized in following order. The section 2 reviews the classifications of routing protocols in WBANs. The section 3 reviews related work, while section 4 describes the details of the STEP protocol. Multi-criteria decision making (MCDM) methods are presented in section 5, temperature estimation is presented in section 6, while performance metrics are presented in section 7. simulation results are presented in section 8. Finally, section 9 gives conclusion.
2.
CLASSIFICATIONS OF WBANs
ROUTING PROTOCOLS
2.1
QoS Aware Routing Protocols
These protocols focus on QoS parameters such as high reliability, lower end to end delay and more packets to be delivered -regardless of temperature sensitivity- and these are the main requirements of medical systems for which WBANs are designed for [1].
2.2
Postural Movement Based Routing
Protocols
This family is concerned with the problem of the interruption of paths between the nodes that are caused by the movement of the body or the sitting posture. This problem is solved by defining of a cost function, which is updated periodically [1].
2.3
Cross
‑
Layered Routing Protocols
This family mainly integrates multiple protocol layers and integrates the advantages of each protocol stack to achieve a better network performance but the drawback of this family, they can’t provide better performance in the case of Mobility [2].
2.4
Cluster
‑
Based Routing Protocols
This protocols divide the nodes in the network into one or more than one cluster of nodes. Each cluster consists of several nodes and a cluster head. The cluster head is elected by an algorithm and is responsible for integrating and forwarding the information of the cluster nodes, to reduce the overhead of direct communication [2].
2.5
Temperature
‑
Aware Routing
Protocols
routing through paths that contain high-temperature nodes, that means it does not take into account delays or data loss [3].
There are five classes of routing protocols each one can deal with one challenge and there is a need for a protocol that can deal with more than one challenge.
3.
RELATED WORK
Large numbers of routing schemes were proposed, the two most pioneer protocols from the two most important classes are chosen to integrate them into one context to develop a hybrid routing protocol. The most
common
protocols are SIMPLE and M-ATTEMPT form QoS aware class and temperature-aware class consecutively [1], Previous protocols (SIMPLE, M_ATTEMPT) belong to different classes and have been improved individually. This section presents previous routing protocols and some of the improvements that have been proposed for each one. In [4], the authors proposed a thermal aware routing protocol (M-ATTEMPT) where each node tries to obtain a minimum hop to sink node. In this protocol if the temperature of the forwarder node is increased then an alternate route is taken which is longer, which will consume more power hence nodes die early in this protocol. The authors in [5] proposed a very popular protocol called SIMPLE: Stable Increased-throughput Multi-Hop Protocol for Link Efficiency, a protocol for WBAN. The SIMPLE protocol is a reliable, power-efficient and high throughput routing protocol using multi-hop topology to achieve minimum energy consumption and longer network lifetime. They propose a cost function to select parent node or forwarder which has high residual energy and minimum distance to the sink. This protocol provides better network stability and longer network lifetime compared to M-ATTEMPT protocol. Authors in [6] proposed Reliability Enhanced-Adaptive Threshold-based Thermal Unaware Energy-efficient Multi-Hop Protocol (RE-ATTEMPT) for WBANs. RE-ATTEMPT protocol uses a fixed deployment of wireless sensors (nodes) such that these are placed according to energy levels. Moreover, it uses direct communication for the delivery of emergency data and multi-hop communication for the delivery of normal data. RE-ATTEMPT selects the route with minimum hop count to deliver data which downplays the delay factor which is the first point of concern with multi-hop routing. The second point of concern with multi-hop routing is the high energy consumption of relay nodes, this issue is resolved by minimizing the number of relay nodes and balancing them concerning energy distribution. An improvement of (SIMPLE) protocol (iM-SIMPLE) is proposed in [7] where the effect of mobility is considered in the performance of the network. A protocol that performs better than SIMPLE, called (NEW-ATTEMPT) [8] is proposed by defining a new cost function that modifies and improves M-ATTEMPT protocol. The recent works (M-TSIMPLE) in [9] is an energy-efficient threshold-based data transmission using a forwarder node technique based on the mobility of nodes for heterogeneous wireless body area networks. Data transmission takes place only if threshold conditions applied for the data to be transmitted and required energy for data transmission are satisfied, thereby individual nodes energy is preserved. Authors in [10] proposed a routing protocol (E-SIMPLE) for throughput improvement in WBANs. The cost function for selecting the forwarding node is evaluated using the residual energy of each node and the distance of the sink from all the nodes in the network. It is shown that network throughput is affected by distance significantly and residual energy has little effect. In [11] theAuthor proposed (EN-ATTEMPT) for efficient energy consumption based on a new cost function to select the forwarder node which has high residual energy and least separation to the sink. Residual energy parameter settles
vitality
utilization among the sensor node while the least separation enhances successful delivery to sink. As previous studies show that the two protocols (SIMPLE, M_ATTEMPT) were improved separately, this paper will suggest an improvement for both of them in one protocol that contributes in: Increasing stability period and network lifetime.
Minimizing the energy consumption.
Increasing throughput.
Balancing the heat of the network and the heat of the nodes within the network.
Protecting the body without reducing performance or increasing performance without causing harm to the body.
4.
STEP: PROTOCOL DETAILS
This section presents a novel routing protocol for WBANs. It saves network energy, improves the network lifetime and stability period, increases the throughput of the network and balances the temperature inside the network. Next subsections give detail of the system model and detail of STEP protocol.
4.1
System Model
Since the proposed protocol is a trade-off between two protocols (SIMPLE, M_ATTEMPT) it should mix them. The previous protocols have 8 sensors as it is shown in figure (1), there are 6 nodes have similar location in the body and 2 nodes have different location between the previous protocols so taking the mix means 10 sensors, by adding a sensor at the top of the head to cover all the body thus the number of sensor nodes for proposed protocol STEP is 11 as figure (1) shows. Sensor nodes are two types: normal and sensitive nodes, sensitive nodes are: EEG, ECG, and Glucose that read very important data all the time, normal nodes read both types of data: critical and normal, critical data is the data that exceed a predefined threshold which means the dangerous level of the monitored disease. All sensor nodes have equal power and computation capabilities. The sink node is in the middle of the chest to be close to the three sensitive nodes (ECG, EEG, Glucose), these sensors always send their data directly to the sink. Figure (1) shows the placement of the sensor nodes and the sink node on the human body for the proposed protocol (STEP) and the previous protocols.
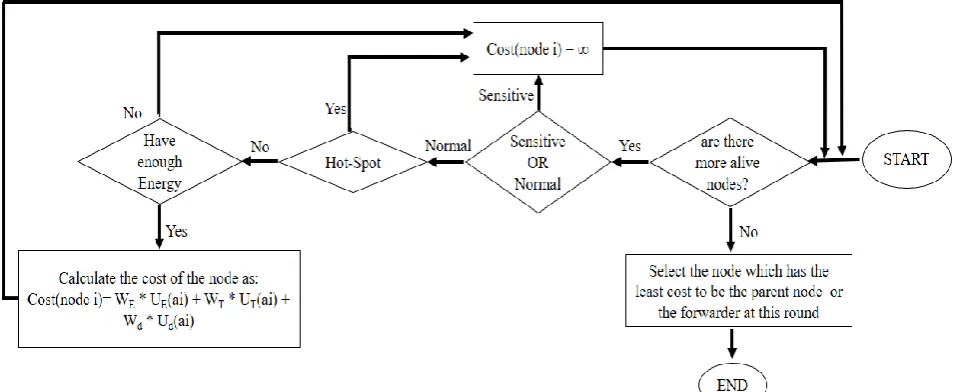
4.2
Initial Phase
method with help of AHP method which will be explained in more detailed in section 5. If (i) is the ID of the node, then the cost function of the node (i) is computed as follows:
CF(node i)=
Where CF (node i) is the cost of node i, m is the number of criteria (the there are three criteria), Wj the weight of criterion j, Uj(i) the utility of node i relative to criterion j. A node with minimum cost function is preferred as a parent. The parent node has maximum residual energy, minimum distance to sink and minimum temperature. Nodes for ECG, EEG and Glucose monitoring do not participate in forwarding data. Hot-spot nodes and low energy nodes (under the minimum threshold) do not participate also.
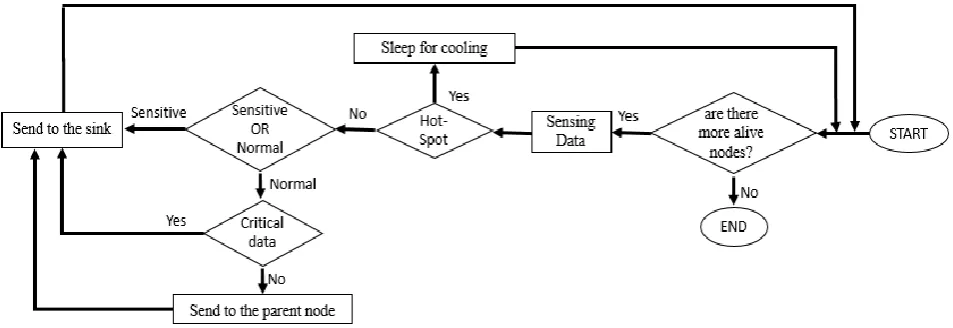
4.3
Selection of Next Hop
In every round, all alive sensors sense data, if the sensor is
hot-spot it will keep the data and sleep for cooling, if the sensor is sensitive it will transmit its data directly to the sink using direct communication and if the sensor is normal and has sensed a critical data it will transmit its data directly to the sink also, else it will use multi-hop communication and send its data to the parent node which has been elected in the current round, the parent node will forward the data to the sink. Figure (3) depicts the flow chart of sending data.
4.4
Scheduling
[image:3.595.67.531.246.458.2]In this phase, the parent node assigns a time division multiple access (TDMA) based time slots to its children nodes. All the children nodes transmit their sensed data to the parent node in its own scheduled time slot. When a node has no data to send, it switches to idle mode. Nodes wake up only at its transmission time. Scheduling of sensor nodes minimizes the energy dissipation of the individual sensor nodes.
Fig 1: Nodes deployment for SIMPLE, M_ATTEMPT and STEP protocols. The red zone is the nodes with a similar location between (SIMPLE, M_ATTEMPT), the green zone is the nodes with a different location between (SIMPLE, M_ATTEMPT)
[image:3.595.62.540.498.694.2]Fig 3: The flow chart of Sending data in every round
5.
MULTI-CRITERIA DECISION
MAKING (MCDM) METHODES
5.1
Analytic Hierarchy Process (AHP)
The AHP is one of MCDM that is supposed to calculate the weights of the multiple criteria according to its relative importance to optimize decision making considering qualitative, quantitative and conflicting factors [12]. To determine the weights, the decision-maker has to construct a pairwise comparison matrix to determine the relative importance among the decision criteria [13]. The pairwise comparison matrix is represented as a square matrix C given by:
C= C ij m*m =
;where m=3
Where Cij indicates the relative importance between decision
criteria i and j and m is the number of criteria. The decision maker determines the relative importance according to table (1) [13]. For example, the row 1 column 2 of the matrix is filled with 5 if decision criterion 1 is more strongly important than decision criterion 2. In the opposite case, the row 1 column 2 of the matrix is filled with 1/5. After that decision maker has to normalize the previous matrix and get the matrix Cnorm by replacing each element with a value equal to the
element divided by the sum of the elements of the column, and then decision maker has to get the matrix of weights W from the matrix Cnorm by the sum of the elements of each line
and dividing it by the number of criteria m [13]. The Consistency Index (CI) is calculated as follows [13] :
CI = ; λmax =
Where WT is a movable matrix of weights. The last step is to determine the consistency of the weights by comparing the Consistency Index with the Random Index RI according to the number of criteria m as shown in table (2) and if the ratio:
[image:4.595.56.277.706.770.2]
, then the degree of consistency is satisfactory [13].
Table 1. Integer values and interpretation
ci j Value Interpretation
1 Criterion i and j are of equal importance
3 Criterion i is weakly more important than Criterion j
5 Criterion i is strongly more important than Criterion j
7 Criterion i is very strongly or demonstrably more important than Criterion j
9 Criterion i is absolutely more important than Criterion j
2, 4, 6, 8 Intermediate values
Table 2. RI for different values of m
m RI m RI m RI m RI
2 0 5 1.12 8 1.41 11 1.51
3 0.58 6 1.24 9 1.45 12 1.48
4 0.90 7 1.32 10 1.49
5.2
Calculation the weights of criteria
using AHP
The work of the proposed protocol was studied by only one criterion at a time to determine the impact and importance of this criterion. Figure (4) shows the results of the proposed protocol work according to each criterion separately, the table (3) shows the values extracted from the figure (4) for the stability period. From the table (3) it is noted that the values resulting from heat and energy criteria are very close and this means that weights are expected to get are close. To determine the relative importance of criteria depending on the stability period values, in this case, the energy criterion is superior to the rest and the expected order of weights is as follows:
Residual Energy -> Temperature -> Distance
Every two criteria are studied together according to the values in the table (3) as the following:
Residual Energy (E) and Temperature (T): The stability period of the residual energy criterion is 3% longer than the temperature criterion according to the equation:
which is 1 as well.
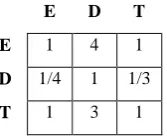
Residual energy (E) and Distance (D): In the same manner the residual energy relative to distance is equal 4 and distance relative to residual energy is the inverted value which is ¼. Temperature (T) and Distance (D): In the same manner the temperature relative to distance is equal 3 and distance relative to temperature is the inverted value which is 1/3. Thus, the comparison pairwise matrix of the criteria is as follows:
E D T
E 1 4 1
D 1/4 1 1/3
T 1 3 1
After completing the rest of the AHP steps, weights are obtained in the table(4) .In calculation : and therefore the results are satisfactory.
[image:5.595.111.195.183.253.2]Fig 4: TThe result of the implementation of the proposed protocol for each criterion separately
Table 3. The round number at which the stability period ends for each criterion
criterion End of Stability period at round
Residual Energy 5522
Distance 3352
Temperature 5302
Table 4. weights of criteria
Criterion Residual energy Distance Temperature
Weight 0.4577 0.1263 0.416
5.3
Simple Multi-Attribute Rating
Technique (SMART)
The SMART technique is based on a linear additive model. This means that the overall value of a given alternative is calculated as the total sum of the performance score (value) of each criterion (attribute) multiplied with the weight of that criterion [14]. In SMART the different scales of criteria need to be converted into a common internal scale, this is done mathematically by the decision-maker using a Value Function. To apply this method, the weights of the criteria
must already have been calculated and then complete the following steps [15]:
1. Provide criteria parameter value on each criterion for each alternative according to preference, noting that each criterion has a maximum or minimum preference, for example, the energy level has a maximum preference, and therefore low energy levels take values that increase the cost. Unlike temperatures that have a minimum preference, low temperatures take values that reduce cost.
2. Determine the value of the utility to convert the value of the criteria for each criterion into the value of the raw data criteria. Utility value is obtained using the equation:
Where Uj(ai) is the utility value of the alternative i relative to criteria j, Couti is the value of criterion j at alternative, i Cmax is
the maximum value of criterion j and Cmin is the minimum
value of criterion j.
3. Determine the final value of each alternative:
Where U(ai) is the total utility of alternative i,Wj the weight of criterion j and Uj(ai) is the utility value of the alternative i relative to criteria j, n is the number of alternatives and m is the number of criteria.
4. Choose the alternative with the best rank.
5.4
Calculating the Cost
Calculating the cost for each alive normal node to elect the parent node in every round as following:
CF (node i) = U(ai)
where:
U(ai)= WE * UE(ai) + WT * UT(ai) + Wd * Ud(ai)
Where WE is the weight of residual energy criterion, UE(ai) is
the utility value of the node i relative to residual energy criterion, WT is the weight of temperature criterion, UT(ai) is
the utility value of the node i relative to temperature criterion, Wd is the weight of distance criterion, Ud(ai) is the utility
value of the node i relative to distance criterion.
6.
Temperature Estimation
There are two major sources that cause the heating effects: the radiation from the sensor node antenna and the power dissipation of sensor node circuitry [16].
6.1
Radiation from the Antenna
Radio signals used in wireless communication produce electrical and magnetic fields. The human tissue will absorb radiation and suffer from temperature rise when exposed to electromagnetic fields. Specific Absorption Rate (SAR, unit is W/kg) is a measure of the rate at which radiation energy is absorbed by the tissue per unit weight [16]. Mathematically, at any point in the human body, the SAR for a sinusoidal excitation is expressed as:
SAR = (W/Kg)
[image:5.595.63.268.310.452.2]6.2
Power dissipation by Sensor node
circuitry
Continuous operation of sensor circuitry also contributes to the temperature rise of tissues[16].
6.3
Calculating Temperature Rise
The temperature is estimated by observing sensor activities. With the Finite-Difference Time-Domain method (FDTD) the temperature rises and SAR of each implanted sensor node can be calculated by using the Penne’s bio heat equation [17]. Finite-Difference Time-Domain (FDTD) [18] is an electromagnetic modeling technique that discretizes the differential form of time and space, the entire problem space is discretized into small grids. Each grid is marked with a pair of coordinates (i, j). When the dielectric and perfusion properties of the tissues are known, the temperature of the grid (i, j) at time m + 1 can be calculated which is a function of the temperature at grid point (i, j) at time m, as well as a function of the temperature of surrounding grid points at time m. The temperature at (i,j) can be obtained using the discretized equation obtained by Tang et al. [17]. This is given by:
Tm+1(i,j)= [ 1 - - ] Tm(i,j)
+ + +
+ [Tm(i+1,j) + Tm(i-1,j) + Tm(i,j+1) + Tm(i,j-1)]
Where T m+1(i, j) is the temperature of the grid (i, j) at time m + 1, and δt is the discretized time step, b is the blood perfusion
constant, which indicates how fast the heat can be carried away by blood flow inside the tissue, ρ is the mass density, Cp
is the specific heat of the tissue, K is the thermal conductivity of the tissue, Tb is the temperature of the blood, δ is the
discretized space step (i.e., the size of the grid), is the power dissipation density and Tm(i+1,j), Tm(i-1,j), Tm(i,j+1), Tm(i,j-1) are the temperatures of surrounding grid points at time m. Once the properties of the tissue, the properties of blood flow, and the power of heat absorbed by the tissue are Known, the temperature at a given time can be estimated and whether the heat effects would cause any damage to the surrounding tissues.
7.
PERFORMANCE MERTICS
The metrics used for measuring the performance of the proposed protocol are:
1) Network lifetime: It represents the total network operation time until the last node dies.
2) Stability period: It is the period of network operation until the first node dies. The period after the death of the first node is termed as an unstable period.
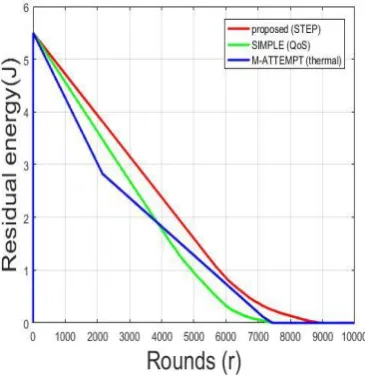
3) Residual Energy: The difference between initial energy and consumed energy.
4) Throughput: It is the total number of packets successfully received at the sink node.
5) Maximum Temperature: The highest temperature rise of the network's nodes. It captures the effectiveness of a routing protocol to direct data away from the hot-spots. 6) Average Network Temperature: The average amount of
heat generated at the whole network area.
7) The number of hot Nodes: The number of nodes that
reached the threshold temperature.
8.
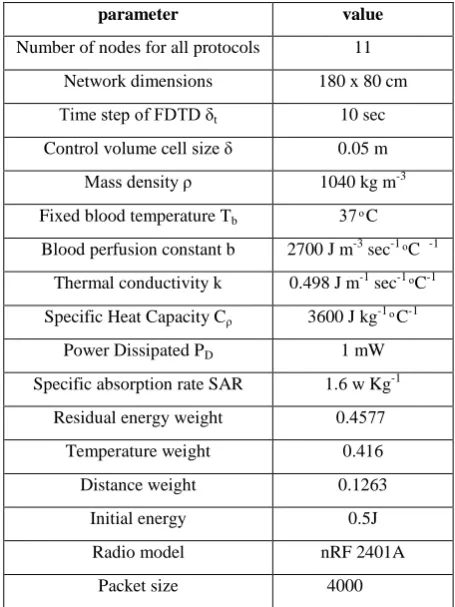
SIMULATION RESULTS
[image:6.595.314.542.227.531.2]A two-dimensional area was modeled with 11 implanted nodes. The simulation program was developed on Matlab2016. Simulation parameters are shown in table (5) and the tissue properties and wave propagation characteristics values from dielectric and thermal properties of the human body model by Lezzi in [16]. The experiment was repeated 10 times and the average was taken for the results. proposed protocol(STEP) was compared with the existing protocols: M-ATTEMPT, SIMPLE. Note that the thermal performance for QoS protocol cannot be evaluated.
Table 5. Simulation Parameters
parameter value
Number of nodes for all protocols 11
Network dimensions 180 x 80 cm Time step of FDTD δt 10 sec
Control volume cell size δ 0.05 m Mass density ρ 1040 kg m-3
Fixed blood temperature Tb C
Blood perfusion constant b 2700 J m-3 sec-1 C -1
Thermal conductivity k 0.498 J m-1 sec-1 C-1
Specific Heat Capacity Cρ 3600 J kg-1 C-1
Power Dissipated PD 1 mW
Specific absorption rate SAR 1.6 w Kg-1
Residual energy weight 0.7744
Temperature weight 0.416
Distance weight 0.1263
Initial energy 0.5J
Radio model nRF 2401A
Packet size 4000
8.1
Network Lifetime and Stability Period
Figure (5) shows the average network lifetime and stability period. The proposed cost function that elects the parent node plays an important role to balance the energy consumption among the sensor nodes and reduce the temperature rise inside the network. In M-ATTEMPT, as the temperature of the forwarder nodes increases, nodes select an alternate longer path which consumes more energy. Hence, these nodes die early. In SIMPLE node with maximum energy and the minimum distance is elected without respect to temperature but in the proposed scheme there is balancing between energy and temperature. Proposed protocol (STEP) achieves nearly about 17% longer stability period and 16% longer network lifetime than SIMPLE protocol and achieves nearly about 62% more stability period and 16% longer network lifetime than M-ATTEMPT protocol.
8.2
Residual Energy
data to the sink through the parent node. The parent node is elected using the aforementioned cost function. Selection of appropriate forwarder in each round contributes to saving the energy of transferring packets to the sink, proposed topology uses different forwarder nodes in each round according to 3 criteria, this restricts the overloading of a particular node.
8.3
Throughput
Figure (7) shows the number of the received packets at the sink, as it clear the throughput of the proposed protocol (STEP) is higher than others due to the new cost function to elect the forwarder node which contributes to raising the rate of throughput significantly.
8.4
Average Network Temperature
Figure (8) shows the average temperature in the network. As it is clear the temperature of the proposed protocol is lower than the previous protocol ATTEMPT. Even though M-ATTEMPT protocol is from temperature-aware class and relies mainly on directing data away from hot-spots, it causes pressure on the one path's nodes as long as it is the shortest one in terms of hop-count until any node at this path get heated in other words it continuing usage of the same shortest path while the heat is under the threshold, when temperature of any node at the shortest path reaches the threshold temperature, it will search for another path with no heat, but the proposed protocol balances the temperature rise between the nodes and its energy and distance from the sink to achieve almost equal warming for all nodes. This is why the heat over the lifetime of the network of the proposed protocol is almost equal. In the previous protocol, the temperature fluctuates as a result of continuing of forwarding through a node until the temperature rises and then move to another node and so on.
8.5
Maximum Temperature
Figure (9) shows Maximum Temperature in the network. Note that the maximum temperature of the proposed protocol is close to the average temperature because of the equilibrium in the rise of heat as previously mentioned. For M-ATTEMPT protocol, note that the network nodes may reach high temperatures due to continuous usage of the same path as long as it is shortest and when it reaches a high temperature, change it to the second shortest path to cool the old path.
8.6
Number of Hot-Spot
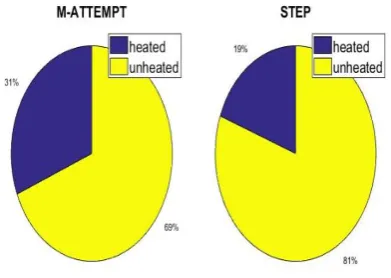
Figure (10) shows the average number of hot-spots. Note that the average number of hot-spots of the proposed protocol is much lower than the previous protocol and the reason is the proposed protocol does not continue working on the same node until it gets out of energy or until it gets heated as in the previous protocol, but balances the work between the nodes according to the three criteria residual energy, temperature, distance. When looking closely at the period from 2100 to 5600 approximately, there is a convergence in the average number of hot nodes between the two protocols, and this is true there are approximately two hot nodes, but if look closer and compare the figure (5) with the figure (10) can note at this period the number of alive nodes for the proposed protocol is 11 and for M-ATTEMPT protocol is 8 this means that within this period, the number of hot-spot for the proposed protocol is 2 out of 11 and for the M-ATTEMPT protocol is 2 out of 8. The same discussion around the round 7000, both protocols have 6 alive nodes, but the proposed protocol has fewer hot-spots. That is, the number of hot-spots relative to the number of alive nodes is lower in the proposed protocol (STEP). Figure (11) shows the ratio of the heated and unheated nodes. In the proposed protocol (STEP) only 19% of the total number
[image:7.595.325.521.107.295.2]of nodes become heated while 31% in previous thermal-aware protocol M_ATTEMPT.
Fig 5: Stability period and network lifetime
9.
CONCLUSION
This paper proposed (STEP) protocol which is a QoS and thermal-aware routing protocol for WBANs. It uses a new cost function to select the appropriate route to the sink. The cost function is calculated based on MCDM methods with three criteria: residual energy, distance, and temperature. Node with less value of cost function is selected as the parent node. Other nodes become the children of that parent node and forward their data to the sink through the parent node. Three nodes for ECG, EEG and Glucose monitoring forward their data direct to sink, also these three nodes cannot be elected as parent nodes because they have critical medical data. Two types of communications are used, direct for critical data and multi-hop for other data. simulation results show that the proposed routing scheme achieves significant improvements in the stability period & snetwork lifetime and temperature balancing. In the future, we will work on other metrics to get more enhancement like link status, trust, and path loss.
[image:7.595.336.519.536.725.2]Fig 7: Throughput
Fig 8: Average network temperature
[image:8.595.335.531.77.216.2]Fig 9: Maximum temperature
Fig 10: Number of hot-spot
Fig 11: Heated Vs Unheated Nodes
10.
REFERENCES
[1] J. Anand , D.Sethi ,2017. Comparative Analysis of Energy Efficient Routing In WBAN. 3rd IEEE-CICT. [2] Y.Qu , G. Zheng , H. Ma , X. Wang , B. Ji and H. Wu,
2019. A Survey of Routing Protocols in WBAN for Healthcare Applications. Sensors.
[3] V. Bhanumathi and C. P. Sangeetha ,2017. A guide for the selection of routing protocols in WBAN for healthcare applications. Human-centric Computing and Information Sciences, 7-24.
[4] N. Javaid, Z. Abbas, M. S. Fareed, Z. A. Khan and N. Alrajeh,2013. M-ATTEMPT: A New Energy-Efficient Routing Protocol for Wireless Body Area Sensor Networks. Procedia Computer Science 19, 224 – 231. [5] Q. Nadeem, N. Javaid, S. N. Mohammad, M. Y. Khan, S.
Sarfraz, M. Gull,2013. SIMPLE: Stable Increased-throughput Multi-hop Protocol for Link Efficiency in Wireless Body Area Networks. Eighth International Conference on Broadband, Wireless Computing, Communication and Applications.
[6] A. Ahmad, N. Javaid,U. Qasim,M. Ishfaq, Z. A. Khan,and T. A. Alghamdi,2014. RE-ATTEMPT: A New Energy-Efficient Routing Protocol for Wireless Body Area Sensor Networks. International Journal of Distributed Sensor Networks.
[7] N.Javaid , A.Ahmad , Q. Nadeem , M. Imran and N. Haider,2014. iM-SIMPLE: iMproved stable increased-throughput multi-hop link efficient routing protocol for Wireless Body Area Networks. Computers in Human Behavior.
[8] S.Singh, S.Negi, A.Uniyal and S.K.Verma,2016. MODIFIED NEW-ATTEMPT ROUTING PROTOCOL FOR WIRELESS BODY AREA NETWORK. IEEE. [9] V.Navya, P. Deepalakshmi,2017. Mobility Supported
Threshold Based Stability Increased Throughput to Sink Using Multihop Routing Protocol for Link Efficiency in Wireless Body Area Networks (M-TSIMPLE). IEEE INTERNATIONAL CONFERENCE ON INTELLIGENT TECHNIQUES IN CONTROL, OPTIMIZATION AND SIGNAL PROCESSING.
[image:8.595.73.267.579.752.2][11]M.R.Singh, R.Laishram, G.Thingbaijam, C.Oinam, P. Gangmei,2019. Development of Efficient Multi-Hop Protocols for Wireless Body Area Network (WBAN). International Journal of Innovative Technology and Exploring Engineering.
[12]N.F.Aziz, S.Sorooshian and F.Mahmud,2016. MCDM-AHP METHOD IN DECISION MAKINGS. ARPN Journal of Engineering and Applied Sciences.
[13]J.R.S.C.Mateo,2012. Multi-Criteria Analysis in the Renewable Energy Industry. Springer-Verlag London Limited.
[14]The Simple Multi Attribute Rating Technique (SMART),2014. Excerpt from ‘Multi-criteria decision analysis for use in transport decision making’, DTU
Transport Compendium Series part 2.
[15] Risawandi, R.Rahim,2016. Study of the Simple Multi-Attribute Rating Technique For Decision Support. IJSRST.
[16] G.Lezzi,2005.Thermal Effects of Bioimplants. IEEE ENGINEERING IN MEDICINE AND BIOLOGY MAGAZINE.
[17] Q.Tang, N.Tummala, S.K.S.Gupta, and L. Schwiebert. 2005. TARA: Thermal-Aware Routing Algorithm for Implanted Sensor Networks. Lecture Notes in Computer Science