http://go.warwick.ac.uk/lib-publications
Original citation:
Hernandez-Valle, Francisco, Edwards, R. S. (Rachel S.), Clough, A. R., Rosli, M. H. and
Dutton, B. (2012) Scanning laser techniques for characterisation of
di
ff
erent surface breaking defect geometries. In: 18th World Conference on
Non-Destructive Testing, Durban, South Africa, 16th-20th April 2012. Published in:
Proceedings 18th World Conference on Non-Destructive Testing
Permanent WRAP url:
http://wrap.warwick.ac.uk/50861
Copyright and reuse:
The Warwick Research Archive Portal (WRAP) makes the work of researchers of the
University of Warwick available open access under the following conditions. Copyright ©
and all moral rights to the version of the paper presented here belong to the individual
author(s) and/or other copyright owners. To the extent reasonable and practicable the
material made available in WRAP has been checked for eligibility before being made
available.
Copies of full items can be used for personal research or study, educational, or
not-for-profit purposes without prior permission or charge. Provided that the authors, title and
full bibliographic details are credited, a hyperlink and/or URL is given for the original
metadata page and the content is not changed in any way.
Publisher’s statement:
All rights reserved. No part of the contents of these proceedings may be reproduced or
transmitted in any form, or by any means, without written permission from the South
African Institute for Non-Destructive Testing (the publisher) or the authors.
A note on versions:
The version presented here may differ from the published version or, version of record, if
you wish to cite this item you are advised to consult the publisher’s version. Please see
the ‘permanent WRAP url’ above for details on accessing the published version and note
that access may require a subscription.
Scanning laser techniques for characterisation of
different surface breaking defect geometries
Francisco HERNANDEZ-VALLE, Rachel S. EDWARDS, Andrew R. CLOUGH,
Mohd H. ROSLI, and Ben DUTTON
Department of Physics, University of Warwick, Coventry, United Kingdom
[email protected], [email protected]
Abstract
Measurements using a laser scanning system consisting of a pulsed Nd:YAG laser to generate surface ultrasonic waves and an interferometer to detect the surface displacement, are presented for different samples and defect geometries. We show, firstly, details of the interaction of Rayleigh waves in thick samples with machined slots inclined at an angle to the surface normal, or with simple branched geometries, scanning the generation source over the defect (SLLS) or scanning the detection point over the defect (SLD). Secondly, we discuss effects of Lamb waves interacting with V-shaped defects in thin samples. The results from these measurements have shown that the signal enhancement found in the near-field in both cases can be used to position the defect and gain an idea of its geometry, and have shown this to be a suitable fingerprint of the presence of the defect.
Keywords: Laser ultrasound, Rayleigh waves, Lamb waves, Non-destructive testing.
1
Introduction
Metals are valuable assets for different types of industries, for instance in the form of containers, pipelines, railway lines, amongst others. Surface breaking defects in such components are of great concern due to safety implications; if left untreated the consequences could be disastrous. Examples of typical surface defects include: rolling contact fatigue (RCF) in railway lines [1] and, stress corrosion cracking (SCC) in pipelines [2].
Nondestructive testing (NDT) techniques have proved to be key tools for detecting and characterising such defects, in particularly those techniques that utilise ultrasonic surface waves [3–8]. To a great extent these works have considered simple defect geometries, typically slots that have been machined at 90◦ to
the sample surface. This will not necessarily be a suitable approximation for all defects; for example, RCF defects in rails grow at around 25◦to the surface, or in a branched manner when considering SCC.
We have shown recently that it is important to consider the geometry of the defects, especially when a slot is propagating at an angle to the surface, since the interaction of the surface wave with the slot will show dependence on the angle of the defect [7, 8].
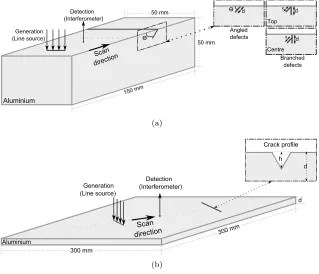
Considered here is the effect of the geometry of a defect on its interaction with incident surface waves. Firstly, we present a series of experiments using thick aluminium samples with RCF-like defects (machined defect propagating at different angles to the surface), and SCC-like defects (machined defect propagating normal to the surface with a branch propagating at 45◦ to the defect, at either the opening or half way
down the slot; see detail in figure 1(a)). Secondly, we introduce Lamb wave interactions in aluminium plate samples containing surface defects (V-shaped machined defect, see detail in figure 1(b)). For each case, a discussion of the implications of signal enhancements for detecting and characterising surface defects is also given.
2
Experimental techniques
Experiments were performed using a pulsed Nd:YAG laser source to generate surface ultrasonic waves (1064nm wavelength and 10ns pulse duration), focused into a line source (approx. 6 mm by 300 µm) as described in greater detail in [7, 9]. The line source is oriented parallel to the defect, which enhances the generation of surface waves in a direction perpendicular to the line [10].
(a)
[image:3.595.139.458.72.346.2](b)
Figure 1: Scanning setup for laser generation and detection of: (a) Rayleigh waves on thick aluminium samples containing angled or branched defects; (b) Lamb waves on plate samples containing V-shaped defects.
For detection an IOS two-wave mixer laser interferometer system was used [11]. The interferometer is sensitive to the out-of-plane component of the wave motion with a 200 µm spot-size, and has a band-width of 125MHz, which allows measurements over a wide range of frequencies. Its continuous wave laser operates at 1550nm, with a power variable up to 2W, dependent on the sample surface quality. It is worth noting that the interferometer works on rough surfaces without the need for surface preparation; this is an advantage when testing industrial samples.
Presented in figure 1(a) is a diagram of the experimental setup that was used to investigate the transmis-sion and enhancement of Rayleigh waves on a set of aluminium samples of dimentransmis-sions 50 x 50 x 150 mm, containing different machined defect geometries. In the case of angled defects, the slots have constant length (d= 2 mm), and propagate out a range of different angles (θ= 30-150◦). Regarding branched
de-fects, the slots machined straight down into the sample have constant length (d= 2 mm), with a branch of various lengths (x= 0.5 - 2 mm) propagating at 45◦, starting at either the opening or half way down
the slot. Measurements were carried out using two different configurations: scanning the generation laser over the defect, while holding fixed the detection point [4, 12]; or scanning the detection point over, while holding fixed the generation source (SLD) [8, 13].
Presented in figure 1(b) is a diagram of the experimental setup that was used to investigate the impli-cations of mode-conversion and interference of Lamb waves when the detection point is close to surface defects on a range of aluminium samples of dimensions 300 x 300 x d mm, where the plate thickness (d) varies from 0.5 to 1.5 mm. The V-shaped defects were machined for a range of different depths (h), from 5 to 100% of the total plate thickness. Measurements were performed holding fixed the distance between the generation laser and the detection point, ensuring that attenuation and dispersion of signals were minimised.
3
Interaction of Rayleigh waves and angled defects
Rayleigh wave enhancement in the proximity of a defect has been considered by several research groups [4, 5, 12, 14]. It has been shown that, when scanning the generation laser over a 90◦ defect (SLLS), an
10
8
6
4
2
0
Amplitude enhancement factor
180 160 140 120 100 80
60 40 20 0
Crack angle
Experimental, out-of-plane Scanning laser detection
[image:4.595.124.463.80.280.2]Experimental, out-of-plane
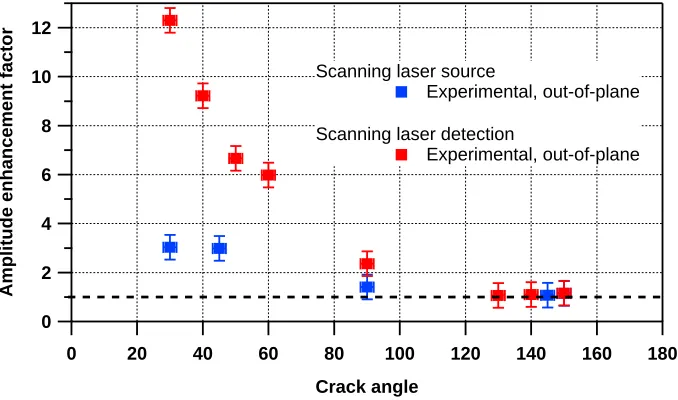
Figure 2: Dependence of the out-of-plane signal enhancement on the angle defect, scanning over the defect with: (a) laser source (SLS), and (b) laser detection (SLD).
[4, 12]. This enhancement can be used as a fingerprint of the defect position. It is also known that a surface defect will act as a filter, blocking much of the high frequency waves, while allowing the waves with longer wavelengths to pass underneath the defect. Hence, in order to characterise the depth of a defect, the changes in transmission as a function of defect depth, or the changes in the transmitted frequency content, can be studied [6]. Nevertheless, it is relevant to know the defect angle before applying a depth calibration, since the transmission shows some angle dependence [7].
A feature that is useful for characterisation of the defect angle is the signal enhancement [4, 14, 8], which is measured by comparing the peak-to-peak amplitude of the Rayleigh wave when either the laser generation or the detection point is close to the defect, to the amplitude for both generation and detection away from the defect.
The behaviour of this enhancement with defect angle (θ) is illustrated in figure 2 for both experimental configurations: SLS and SLD. For SLS measurements, the enhancement considers interference of the incident and reflected Rayleigh waves, but also the changes in laser generation shape and boundary conditions as the laser passes over the crack. However, this leads to only a small angle dependence of the signal enhancement. On the other hand, the enhancements for SLD measurements show a larger variation with crack angle, with enhancements of up to 12 times the incident Rayleigh wave amplitude observed for shallow angled defects [13]. The mechanism for the enhancement for shallow angled defects is due to the near-field behaviour within the angled defect; as the Rayleigh wave moves into the wedge-shaped region, the local thickness changes and this will affect what wavemodes can propagate [15–17]. Close to the opening of a shallow defect the surface waves propagate primarily as S0 and A0 Lamb wavemodes, with significant A0 amplitude in the out-of-plane, leading to an enhanced signal close to the Rayleigh wave arrival time. This angle dependence has the potential to be used to characterise the crack angle and hence identify the correct transmission calibration to use [18].
4
Interaction of Rayleigh waves and branched defects
For some surface defects, an angled slot such as those shown in the previous section, is an appropriate approximation. However, it is not clear how the branching in a crack of the defect will affect the signal transmission and enhancement. For this reason we have performed some initial studies of the reflection and transmission of Rayleigh waves with a slot machined straight down into the sample with constant length (d= 2 mm), and a branch of various lengths (x= 0.5 - 2 mm) propagating at 45◦, starting at either
the opening or half way down the slot. A schematic diagram of each type of branching can be seen in figure 1(a).
1.5
1.0
0.5
0.0
Rayleigh wave amplitude (nm)
30 20
10 0
Scan distance (mm)
Enhancement factor = 3.196 Length (d) = 2 mm, Branch length (x) = 1 mm
Top
0 20 40 mm
(a)
0.8
0.6
0.4
0.2
0.0
Rayleigh wave amplitude (nm)
30 20
10 0
Scan distance (mm)
Enhancement factor = 1.476 Length (d) = 2 mm, Branch length (d) = 1 mm
Centre 0 20 40 mm
[image:5.595.138.439.77.465.2](b)
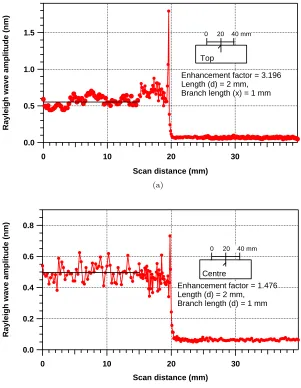
Figure 3: Enhancement factor of Rayleigh wave as a function of the scan position, for a machined defect propagating normal to the surface with a branch propagating at 45◦, at either: (a) opening of the slot,
or (b) half way down the slot.
previous section, the signal enhancement is measured by comparing the peak-to-peak amplitude of the Rayleigh wave when the detection point is close to the defect, with the amplitude for both generation and detection away from the defect. Figure 3 shows the Rayleigh wave amplitude as a function of the scan position, for a machined defect propagating normal to the surface with a branch propagating at 45◦, at either: (a) opening of the slot, or (b) half way down the slot. As can be seen, the presence of
a branch at the opening of the slot makes the defect behave like an angled defect, with a large signal enhancement. However, when the branch is placed half way down the slot, the enhancement looks similar to that obtained for a 90◦slot without a branch. Additionally, the length of the branch will influence the
enhancement factor, with longer branches expected to give a larger enhancement.
5
Surface defects and Lamb waves
When considering plate samples for low frequency·thickness values the propagating surface wavemode is
A--0.3 -0.2 -0.1 0.0
Out of plane displacement (nm)
80 60 40 20 Time (µs) (a) 3 2 1 0
Group velocity (Km/s)
10 8 6 4 2 0
Frequency thickness (MHz-mm)
A0 A1 A2
Symmetric modes Antisymmetric modes
(b)
Figure 4: (a) Multimodal Lamb-wave A-Scan for a 1.5 mm thickness aluminium plate; (b) Group velocity dispersion curve for Lamb waves in aluminium.
10 8 6 4 2 0
Frequency thickness (MHz.mm)
40 35 30 25 20 15 10 5
Arrival time (µs)
Symmetric Modes Antisymmetric modes (a) 10 8 6 4 2 0
Frequency thickness (MHz.mm)
40 35 30 25 20 15 10 5
Arrival time (µs)
[image:6.595.71.516.81.223.2]500 400 300 200 100 0 Symmetric Modes Antisymmetric Modes (b)
Figure 5: Time frequency representations with calculated arrival times overlaid, for a 1.5 mm thickness aluminium plate with 100% through thickness defect, for (c) No defect region, and (d) Enhanced scan position. A large increase in magnitude of the A0 mode is seen in some regions, and an increase in the magnitude of the S0 wave is also visible at higher frequencies.
Scan from a SLD measurement, while figure 4(b) shows the calculated dispersion curve for aluminium [15]. It is worth noting that, even though the symmetric and antisymmetric wavemodes are both generated, the IOS interferometer is sensitive to out-of-plane displacements; for small frequency·thickness the S0 is
predominantly in-plane, while the A0 is predominantly out-of-plane.
Close to a surface defect, an analogous signal enhancement to that shown for Rayleigh waves, is present for Lamb waves. As the detector is scanned across the near field of the defect a set of data is produced showing the out-of-plane displacement as a function of time. By stacking these A-Scans together a B-Scan can be produced in order to visually track the wavemodes. However, the interaction between reflected, mode converted features, and incident wavemode is difficult to quantify due to overlapping modes. Thus, a time-frequency representation (sonogram) was chosen [20]. Figure 5(a) shows a sonogram for a scan taken in the far field of the defect, whereas 5(b) is from the near field of the defect where there are interactions between incident and mode converted wave forms. A large increase in magnitude of the A0 mode is seen in some regions of frequency·thickness, and an increase in the magnitude of the S0 wave is
also visible at higher frequencies. To quantify the enhancement of the signals due to reflection and/or mode conversion, the magnitude in a particular region of the time frequency plot can be measured. This method has the potential to provide a reliable method for the near field identification and characterisation of surface breaking defects in plates.
6
Conclusions
[image:6.595.72.538.283.415.2]the defect and to gain some idea of its inclination relative to the surface. A similar enhancement effect is observed for Lamb waves incident on defects on plates, and again, signal enhancement has been shown to be a suitable fingerprint of the presence of a defect.
The addition of branching causes extra complications to the detected surface wave signals. If the branch is close to the top surface of the sample its angle becomes important when considering signal enhancement. If it is within the sample, the position is important when considering reflections.
7
Acknowledgments
This work was funded by the European Research Council under grant 202735, ERC Starting Independent Researcher Grant.
References
[1] P. R. Armitage, “The use of low-frequency rayleigh waves to detect gauge corner cracking railway lines,”Insight, vol. 44, no. 6, pp. 369–372, 2002.
[2] R. A. Cottis, “Stress corrosion cracking: Guides to good practice in corrosion control,” The National Physical Laboratory, Tech. Rep., 2000.
[3] V. K. Kinra and B. Q. Vu, “Diffraction of rayleigh waves in a half-space. II Inclined edge crack,” Journal of the Acoustical Society of America, vol. 79, no. 6, pp. 1688–1692, 1986.
[4] A. K. Kromine, P. A. Fomitchov, S. Krishnaswamy, and J. D. Achenbach, “Laser ultrasonic detection of surface breaking discontinuities: Scanning laser source technique,” Materials Evaluation, vol. 58, no. 2, pp. 173–177, 2000.
[5] J. L. Blackshire and S. Sathish, “Near-field ultrasonic scattering from surface-breaking cracks,” Applied Physics Letters, vol. 80, no. 18, pp. 3442–3444, 2002.
[6] R. S. Edwards, S. Dixon, and X. Jian, “Depth gauging of defects using low frequency wideband Rayleigh waves,”Ultrasonics, vol. 44, pp. 93–98, 2006.
[7] B. Dutton, A. R. Clough, M. H. Rosli, and R. S. Edwards, “Non-contact ultrasonic detection of angled surface defects,”NDT&E International, vol. 44, pp. 353–360, 2011.
[8] R. Edwards, B. Dutton, A. Clough, and M. Rosli, “Enhancement of ultrasonic surface waves at wedge tips and angled defects,”Applied Physics Letters, vol. 99, pp. 094 104(1)–094 104(3), 2011.
[9] C. B. Scruby and L. E. Drain,Laser ultrasonics. Techniques and applications. Adam Hilger, 1990.
[10] A. M. Aindow, R. J. Dewhurst, and S. B. Palmer, “Laser-generation of directional surface acoustic wave pulses in metals,”Optics communications, vol. 42, no. 2, pp. 116–120, 1982.
[11] M. B. Klein, G. D. Bacher, A. Grunnet-Jepsen, D. Wright, and W. E. Moerner, “Homodyne detection of ultrasonic surface displacements using two-wave mixing in photorefractive polymers,”Optics and communications, vol. 162, pp. 79–84, 1999.
[12] I. Arias and J. D. Achenbach, “A model for the ultrasonic detection of surface-breaking cracks by the scanning laser source technique,”Wave Motion, vol. 39, no. 1, pp. 61–75, 2004.
[13] B. Dutton, A. R. Clough, and R. S. Edwards, “Near field enhancements from angled surface de-fects; a comparison of scanning laser source and scanning laser detection techniques,” Journal of Nondestructive Evaluation, vol. 30, pp. 64–70, 2011.
[14] R. S. Edwards, X. Jian, Y. Fan, and S. Dixon, “Signal enhancement of the in-plane and out-of-plane rayleigh wave components,”Applied Physics Letters, vol. 87, pp. 194 104(1)–194 104(3), 2005.
[15] J. L. Rose,Ultrasonic waves in solid media, 1st ed. Cambridge University Press, 1999.
[18] M. H. Rosli, R. S. Edwards, and Y. Fan, “In-plane and out-of-plane measurements of rayleigh waves using EMATs for characterising surface cracks,”NDT&E International (Under review), 2012.
[19] S. Dixon, S. E. Burrows, B. Dutton, and Y. Fan, “Detection of cracks in metal sheets using pulsed laser generated ultrasound and EMAT detection,”Ultrasonics, vol. 51, no. 1, pp. 7 – 16, 2011.