Abstract—Pervasive computing applications, which are
location-aware systems becoming increasingly important as part of our daily life. Real-time position localization of moving objects in an indoor environment is an encouraging technology for realizing the vision of creating numerous novel location-aware services and applications in various market segments. An off the shelf development platform that uses Radio Signal Strength Indication (RSSI) based location technique is always used for testing. In this paper we investigated at the affects of polarization on an indoor location tracking system. The target of this paper is to present an optimal design for RSSI location technology. We created a model for determining range form RSSI demonstrated that this model fits our experimental setup. Antenna polarization will affect RSSI and thus range accuracy. The experiments and its errors are carefully analyzed and found that the traditional least squares method of determining the parameters of the range model will give unacceptably high location error. A simple and cheap method of determining polarization angle is introduced with an accelerometer, which also increase the battery life of the node.
Index Terms—Location, RF, RSSI, RFID, Zigbee
I. INTRODUCTION
Pervasive computing applications, which are location-aware systems becoming increasingly important as part of our daily life. Determining the location of a node in a wireless network has real commercial uses. An example is determining the location of mobile assets like equipment and people in a building [1-8]. Such systems have found there way into a number of hospitals to track the location of medical equipment, staff and patients. These systems have also been used to prevent loss of equipment like wheelchairs or restrict access to drugs by automatically locking doors.
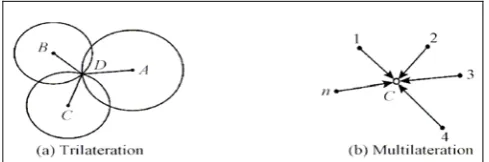
Determination of location can be done in a number of ways including: triangulation, trilateration and multilateration [8-11].
Triangulation requires knowing the angle between nodes. However this is generally not an option for this type of wireless network as isotropic antennas tend to be used for both practical and cost reasons.
Xu Huang is with Faculty of Information Sciences and Engineering, University of Canberra, Australia. (e-mail: [email protected]).
Mark Barralet is a engineering student with Faculty of Infromation Sciences and Engineering, University of Canberra, Australia.
[image:1.595.305.550.186.267.2]Dharmendra Sharma is with Faculty of Information Sciences and Engineering, University of Canberra, Australia. (e-mail: [email protected]).
Fig 1 Distance based location techniques
For the 2D case the location of an unknown node can be determined by trilateration. This requires 3 nodes of known location. The 4th node of unknown location can be determined if the distance to the reference nodes is known. This is shown graphically in Fig 1. However we can only determine the distance within a certain degree of certainty. By using more reference nodes we can partially average out this uncertainty.
Two methods of determining distance (refereed to as pseudo range in GPS systems) are based on: propagation time and Radio Signal Strength (RSS) [12-14].
Electro magnetic radiation (radio waves) travels at the speed of light, so we can determine distance by observing the time it took a transmitted signal to reach the receiver. Or alternatively the time difference between several receivers at known locations. Due to the very high speed of propagation (1 meter takes just 3.3ns), this requires fast precision timing hence is not well suited to power requirements of low power radio frequency (RF) applications.
RSSI based distance calculations add no extra cost to the device. However RSSI measurements give lower accuracy range due to variable attenuation (path loss) and fading effects with high variance.
In the case where there is a direct path between a transmitter and receiver. The receiver signal power, Pr is related to distance, d, by the inverse square law [4].
Pr ∝ d-2 (1)
However this is an ideal case for a point source. In the real world the signal often decays at a faster or slower rate
Pr ∝ d-n (2)
Where n is the loss exponent. An excepted form of the relation between distance and receive power simplified for the case of a one meter reference distance is:
Pr(d) (dBm) = A - 10n⋅log10(d) (3)
where A = Received power in dBm at one meter, and n is the loss parameter (or loss exponent), d is the distance between the transmitter and receiver. In real life the values of n and A can only be determined empirically.
Multipath signals arrive at a nodes antenna via the
Accuracy of Location Identification with
Antenna Polarization on RSSI
reflection of the direct signal off of nearby objects. The resultant or total signal available to the receiver will be the vector summation of the direct signal and all of the multipath signals. Fig 2 shows the RSSI as a function of distance.
RSSI vs Receiver Distance
-80 -70 -60 -50 -40 -30 -20
1 10 100
Distance (Meters)
Si
gnal
St
re
ngt
h
(dBm
[image:2.595.49.294.115.243.2])
Fig 2 RSSI as a function of distance. The solid line is the least squares line of best fit. Each diamond represents the 32 sample average RSSI at the given distance to the transmitter. The measurements were repeated 3 times.
Another factor that affects received signal strength is antenna polarization [18], which is one of focuses of this paper. Small simple antenna’s produce linearly polarized radiation. For the linear polarized case, the electrical magnetic (EM) field remains in the same plane as the axis of the antenna. When the antenna produces an electric filed that remains in a plane parallel with respect to earth the polarization is said to be horizontal. Likewise when the electric field remains in a plane normal to earth the polarization is vertical. To receive maximum power the receiving antenna axis must be in the same plane as the transmitting antenna. The loss due to misaligned antenna polarization is [3]:
Polarization Mismatch Loss (dB) = 20 log (cos θ) (4) where θ is the polarization angle between the antennas.
II. THEORY
In general, there will be a number of signals arriving at the receive node that are not aligned with the polarization of the receiver antenna [4]. Rotation of the antenna from vertical to horizontal, will affect the receive energy from these multiple signals. In order to make it clear we have the following definitions in this paper:
Node: An RF transceiver in the network.; 1-hop: Direct
communication between source and destination nodes in the Zigbee network with the data not routed though other nodes;
Blind Node: A node that calculates its own position;
Reference Node: A node at a known fixed location
(sometimes refereed to as a beacon); Dongle: A node that is
connected to a computer and configures and monitors the Blind and Reference nodes; RSSI: Received Signal Strength
Indicator, an approximation of RF signal power as measured by the RF transceiver; CC2431: Texas instruments RF
transceiver.
The CC2431 [17, 19-21] is an inexpensive 2.4 GHz IEEE 802.15.4 compliant RF transceiver from Texas Instruments. It combines an 8051 microcontroller and a RF transceiver
with DSSS (Direct Sequence Spread Spectrum) modem into one package. The CC2431 also includes a hardware ‘Location Engine’ that can calculate the nodes position given the RSSI and position data of reference nodes. The main inputs to the location engine are the; (x,y) location and RSSI of reference nodes, and the parameters A and n used internally to convert RSSI values into ranges as in equation (5). The output of the engine is the calculated (x,y) position. The engine presumably uses a multilateration technique optimized for minimum resource use and speed. The precision for the (x,y) location coordinates is 0.25meters. The precision of A is 0.5dB, while n uses an index into a lookup table that limits its precision (see Error! Reference
source not found.). The range of valid RSSI to the location
engine is 40 to 81 (in -dBm), So RSSI values higher than -40dBm must be set to -40dBm. This means that the minimum measurable range is around 1 meter (assuming an RSSI of -40dBm at 1 meter). Thus it affects the accuracy when the blind node is closer than 1 meter to a reference node.
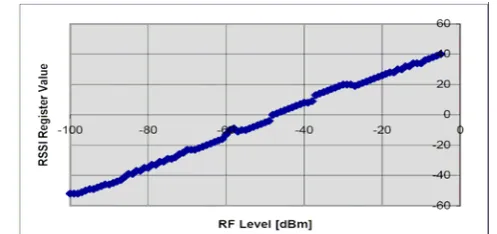
The CC2431 has a built in RSSI register. The RSSI value is always averaged over 8 symbol periods (128uS). The RSSI value can be used to determine the RF signal power with reasonable accuracy as shown in Fig 3.
One problem with the RSSI is that a narrow band interferer inside the channel bandwidth can affect the RSSI value. Determining distances between nodes is key part of location determination by multilateration. The ‘location engine’ uses the following model for the realation between distance and RSSI:
Fig 3 Typical RSSI value vs. input power [from the CC2430 datasheet]
RSSI = -( 10n Log10(d) + A) (5) where RSSI is in dBm, n is the path loss exponent, d is the distance in meters and A is the RSSI in -dBm at one meter.
By measuring the RSSI at different distances the values of n and A can be determined. This can most easily be done and understood by letting Dlog=10log(d). Then we can rewrite this as a more simple and more obviously linear equation:
-RSSI = n⋅Dlog + A (6)
We can then use a linear least squares approximation to solve for n and A. If we plot the least squares line, A is the value at zero crossing ( 10⋅LOG(1meter) = 0 ), and n is the slope of the line.
[image:2.595.300.549.429.546.2]of samples increases. (Remembering that received signal is the vector sum of the direct wave plus all of the reflected, scattered, diffracted, or refracted waves, and is highly position and time dependent).
III. EXPERIMENTAL WORKS
The method of determining the parameters A and n by taking the mean RSSI at several distances can also yield significantly varying results. There can be considerable ranges of distance where the mean RSSI deviate either positively or negatively from the least squares fit. The result obtained is therefore dependent how many measurements and the location where the data is taken. Taking more samples in these faded regions will weigh the result of the least squares fit. It therefore makes sense to only use data that will be in the range of interest.
Obstructions like walls can significantly affect the loss. The affect of a small fixed obstruction tends to affect to affect the RSSI reading by an offset and is not related to distance. This effectively reduces the A parameter. It has been found empirically by others that a wall reduces the signal power by approximately 3dBm per wall (depending on wall type and construction). The ‘location engine’ in the CC2431 only allows for a global A and n per calculation. But it is possible to pre-apply the offset to the input RSSI value. Therefore, environmental effects are not just caused by obstacles as shown in Fig 4.
RSSI vs Distance
Inside shielded room y = 1.5635x + 37.106 Outside Shilded Room
y = 2.9428x + 47.233
10 20 30 40 50 60 70
-10 -5 0
10 Log( Distance )
R
SSI
(
-d
B
m
[image:3.595.313.540.50.219.2])
Fig 4 Environmental effects are not just caused by obstacles. Greater reflections in the shielded room cause higher multipath effects. In this case the small size of the room means the primary multipath signals arrive with net constructive superposition.
Antenna polarization does affect the RSSI value and thus can affect the outcome of location identification. A measured example of how polarization affects average RSSI over a range of distances is shown in Fig 5. The polarization of the system is identified in an abbreviated form where the first letter identifies the polarization of the transmit antenna and the second letter (or number) is the polarization of the receive antenna. The valid letters are V (vertical), H (Horizontal), 45 (45 degrees).
35 40 45 50 55 60 65 70
0 5 10 15
10 Log( Distance )
RS
S
I (
-d
B
m
)
[image:3.595.50.290.424.594.2]VV V45 VH
Fig 5 RSSI vs Distance measurements taken in a long hallway of varying width. The transmitter is fixed at a location and the antenna is always vertically polarized. The RSSI is recorded for receive antenna polarization of Vertical, Horizontal and 45 degrees (ie. Parallel, Orthogonal and 45 degrees)
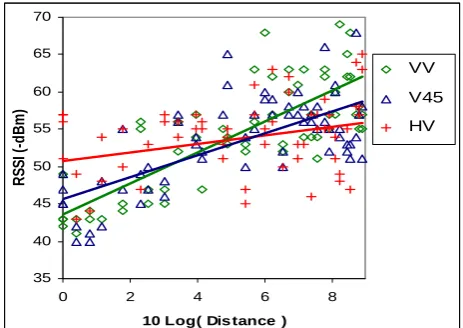
Observations indicate that for small distances the VV (parallel) case gives the highest RSSI, followed by V45, then VH (perpendicular). However as distance increases the rate of signal strength decay is higher in the VV case. This indicates that in general VH requires a higher value A (lower signal strength) and a lower n (loss exponent) for best range measurement results.
For experimentation we study only a single room. The RSSI vs distance measurements were observed along a diagonal of the room as the results are shown in Fig 6. For this particular short distance single room case, we note that there is a fairly significant difference in the slope of the least squares line between perpendicular and parallel antenna polarization.
35 40 45 50 55 60 65 70
0 2 4 6 8
10 Log( Dis tance )
RS
S
I (
-d
Bm
)
VV
V45
HV
Fig 6 Measured RSSI vs Distance with 3 polarization setups.
The testing of polarization effects on location identification were performed with the CC2431DK Development Kit from Texas Instruments. Location engine results were observed using the PC application ‘Z-location Engine’ downloaded from the Texas Instruments website. The Z-location software was used to configure the locations of the reference nodes and configure the parameters of the blind nodes (most importantly the A and n parameters).
[image:3.595.310.542.471.635.2]allows blind nodes to know where they are without the presence of the Dongle.
For testing a room (measuring 5.5 x 8 meters) was cleared and eight reference nodes were arranged around the perimeter of the room. For ease all nodes were placed at ground level. A 2-diementional cartesian coordinate system with a negative y axis is used to define the position of the nodes in positive space.
It is reasonable to assume that because reference nodes are at a fixed location that it is easy and possible to set them all to the same polarization. Assuming that the nodes are normally located on walls, and then it is best to use vertical polarization. This is because isotropic antennas produce little power in the direction of the antenna axis. The blind nodes on the other hand are mobile and thus the polarization is likely change dynamically. The test follows these assumptions and keeps the reference nodes fixed for vertical polarization and the reference nodes changed between vertical and horizontal polarization.
1) Range measurement test
As an example of range measurement accuracy, the blind node was placed at the centre location and the RSSI data was collected by monitoring the Zigbee network packets. The result of this test is shown in Fig 7. The nodes were all running the Zigbee Z-location reference firmware v1.4.2 provided by Texas Instruments as part of the Z-Location software for the CC2431DK. Source code v1.4.3 is provided as part of the Z-Stack (Zigbee protocol stack).
10
5 12 13 14 16 20
6
10
12.5
15
[image:4.595.306.548.52.259.2]19
Fig 7 Graphical representation of location problem with real data. The small filled squares represent the location of the reference nodes. The blind node is in the center of all the reference nodes at (13,12.5) and is marked by a star. The circles represent the distance based on RSSI using (5), with parameters
A=44, n=3.5. Ideally all circles should intercept at the point (13,
12.5).
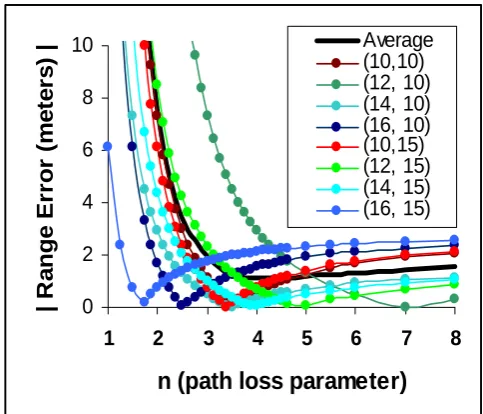
Using a higher value of n than is given by the least squares best fit, can reduce the average error practically over short distances. This is because of the high variance of the RSSI measurements and the exponential relationship between RSSI and distance. Fig 7 gives a visual relation between n and range (distance) error that helps makes this concept clearer.
0 2 4 6 8 10
1 2 3 4 5 6 7 8
n (path loss parameter)
| R
an
g
e E
rr
o
r (
met
er
s)
|
Average(10,10) [image:4.595.68.270.412.559.2](12, 10) (14, 10) (16, 10) (10,15) (12, 15) (14, 15) (16, 15)
Fig 8 RSSI based range error vs path loss parameter (n), based on the same measured RSSI data set as Fig 7 and keeping A=44. The error is calculated as the difference between calculated range and actual range. It is seen that a positive change in n from the point of least error gives a lower error than the same change in the opersite direction.
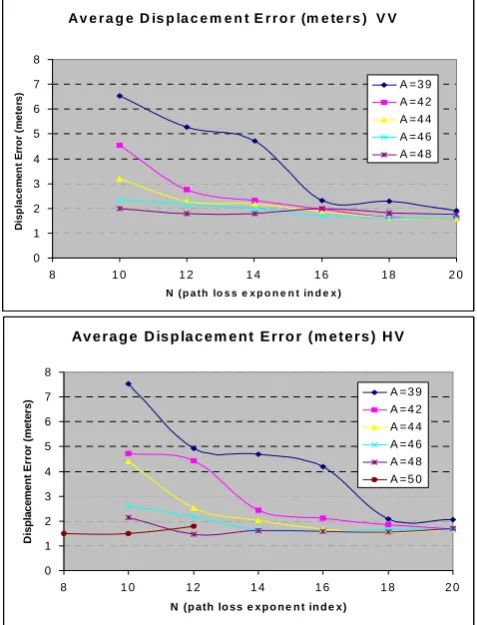
The accuracy of the location system is defined here as the displacement error in meters between the actual (xa,ya)
position and the measured (xm,ym) position of the blind node,
and is calculated using the equation:
A v e r a g e D is p la c e m e n t E r r o r (m e te r s ) V V
0 1 2 3 4 5 6 7 8
8 1 0 1 2 1 4 1 6 1 8 2 0
N ( p a t h lo s s e x p o n e n t in d e x )
D
isp
la
ce
m
e
n
t E
rr
o
r (
m
e
te
rs)
A = 3 9 A = 4 2 A = 4 4 A = 4 6 A = 4 8
Av e ra g e D is p la c e m e n t E rro r (m e te rs ) H V
0 1 2 3 4 5 6 7 8
8 1 0 1 2 1 4 1 6 1 8 2 0
N (p ath lo ss e xp o n e n t in d e x)
D
isp
la
ce
men
t E
rr
or
(
m
et
er
s)
[image:5.595.49.288.53.366.2]A = 3 9 A = 4 2 A = 4 4 A = 4 6 A = 4 8 A = 5 0
Fig 9 Displacement Error between actual location and measured location. The y-axis gives the displacement in meters that the calculated position is away from the actual position, ideally this should be zero. The x-axis gives values of the path loss exponent index N. This data shows the average result for two different blind nodes at the physical locations (15,11) and (14,13).
The addition of a 3-axis accelerometer also allows for other benefits. It could be used to reduce the power consumption by only performing location measurements while moving and powering down the node when stationary. Where the node is used as an active RFID tag tracking a person it could double as a pedometer counting the number of steps taken. On fragile equipment it can be used to detect when equipment been dropped or incorrectly orientated. By mathematical integration of the acceleration data the velocity and displacement can also be calculated.
IV. CONCLUSION
We have shown experimentally that using the least squares method of investing the A and n parameters for optimal design a RSSI based location system. In particular we conclude that n needs to be significantly higher in order to maximize average accuracy. We also show that antenna polarization needs to be taken into account for best location accuracy. Although this particular test reveals that we can select reasonable compromise A and n values, it is likely that this would not always be the case.
REFERENCES
[1] P. M. Shankar, Introduction to Wireless systems, New York: John Wiley & Sons, 2002, pp. 14.
[2] CC2431 Datasheet (Rev 2.01) SWRS034B
[3] Konrad Lorincz and Matt Welsh, “MoteTrack: A Robust, Decentralized Approach to RF-Based Location Tracking”,
http://www.eecs.harvard.edu/~konrad/projects/motetrack
[4] Byung Ki Kim, Ho Min jung, Jae-Bong Yoo, Wan Yeon Lee, Chan Young Park, and Young Woong Ko, “Design and Implemtation of Cricket-based Location Tracking System”, Proceedings of world academy of science, engineering and technology volume 28 April 2008 [5] Hongbin Li, Xingfa Shen, Jun Zhao, Zhi Wang, and Youxian Sun, “INEMO: Distributed RF-Based Indoor Determination with Confidence Indicator”
[6] Paramvir Bahl and Venkata N. Padmanabhan, “RADAR: An In-Building RF-based User Location and Tracking System”, Microsoft Research
[7] “Antenna Polarization Considerations in Wireless Communications Systems”, Cushcraft Corporation
[8] SHI Qin-Qin, HUO Hong, FANG Tao, LI De-Ren, “Using Linear Intersection for Node Location Computation in Wireless Sensor Networks”, ACTA AUTOMATICA SINICA, Vol. 32, No. 6, November, 2006
[9] “ZigBee and Wireless Radio Frequency Coexistence”, Zigbee Alliance, Zigbee White Paper – June 2007
[10] Jan Blumenthal, Ralf Grossmann, Frank Golatowski, Dirk Timmermann “Weighted Centroid Localization in ZigBee-based Sensor Networks”, IEEE International Symposium on Intelligent Signal Processing, (WISP 2007), Madrid, October3rd,2007
[11] Xiuzhen Cheng & Andrew Thaeler Guoliang Xue Dechang Chen, “TPS: A Time-Based Positioning Scheme for Outdoor Wireless Sensor Networks”, IEEE INFOCOM 2004, 0-7803-8356-7/04/
[12] “Avoiding RF Interference Between WiFi and Zigbee”, Crossbow [13] Junhui Zhao, Yuqiang Zhang and Mengjie Ye, “Research on the
Received Signal Strength Indication Location Algorithm for RFID System”, ISCIT 2006, 0-7803-9740-X/06/
[14] Sergio Polito, Daniele Biondo, Antonio Iera, Massimiliano Mattei, Antonella Molinaro, “Performance Evaluation Of Active Rfid Location Systems Based on RF Power Measures”, The 18th Annual IEEE International Symposium on Personal, Indoor and Mobile Radio Communications (PIMRC’07), 1-4244-1144-0/07/
[15] Tor-lnge Kvaksrud , “Range Measurements in an Open Field Environment”, Texas Instruments Design Note DN018 SWRA169A [16] Siri Namtvedt, “RSSI Interpretation and Timing”, Texas Instruments
Design Note DN505, SWRA114B
[17] “CC2430 Data Sheet (rev. 2.1)”, SWRS036F, Texas Instruments [18] Audun Andersen, “Antenna Selection Guide”, SWRA161, Application
Note AN058, Texas Instruments.
[19] K. Aamodt “CC2431 Location Engine”, Application Note AN042 (Rev. 1.0), SWRA095, Texas Instruments
[20] “CC2430DK Development Kit User Manual Rev. 1.0”, SWRU133, Texas Instruments