Using lean thinking to improve
hypertension in a community health
centre: a quality improvement report
Patrick Lee,1,2,3 Linhchi Pham,4 Stephen Oakley,3 Kimberly Eng,3 Elena Freydin,3,5
Tayla Rose,3,6 Alyssa Ruiz,3 Joyce Reen,3 Deborah Suleyman,3 Vanna Altman,3
Kara Keating Bench,3 Alice Lee,7 Kiame Mahaniah3,4
To cite: Lee P, Pham L, Oakley S, et al. Using lean thinking to improve hypertension in a community health centre: a quality improvement report. BMJ Open Quality 2019;8:e000373. doi:10.1136/ bmjoq-2018-000373
►Additional material is published online only. To view please visit the journal online (http:// dx. doi. org/ 10. 1136/ bmjoq- 2018- 000373).
Received 4 March 2018 Revised 26 November 2018 Accepted 4 January 2019
1Medicine, North Shore Medical
Center, Salem, Massachusetts, USA
2Harvard Medical School,
Boston, Massachusetts, USA
3Lynn Community Health Center,
Lynn, Massachusetts, USA
4Tufts University School
of Medicine, Boston, Massachusetts, USA
5School of Nursing, Salem
State University, Salem, Massachusetts, USA
6Department of Pharmacy
and Health Systems Sciences, Northeastern University School of Pharmacy, Boston, Massachusetts, USA
7Lean Enterprise Institute,
Cambridge, Massachusetts, USA
Correspondence to
Dr Patrick Lee; ptlee@ partners. org © Author(s) (or their employer(s)) 2019. Re-use permitted under CC BY-NC. No commercial re-use. See rights and permissions. Published by BMJ.
AbstrAct
Background Achieving better care at lower cost in the US healthcare safety net will require federally qualified health centres (FQHC) to implement new models of team-based population healthcare. Lean thinking may offer a way to reduce the financial risk of practice transformation while increasing the likelihood of sustained improvement.
Objective To demonstrate system-level improvement in hypertension control in a large FQHC through the situational use of lean thinking and statistical process control.
Setting Lynn Community Health Center, the third largest FQHC in Massachusetts, USA.
Participants 4762 adult patients with a diagnosis of hypertension.
Intervention First, we created an organisation-wide focus on hypertension. Second, we implemented a multicomponent hypertension care pathway. The lean tools of strategy deployment, standardised work, job instruction, Plan-Do-Study-Adjust, 5S and visual control were used to overcome specific obstacles in the implementation.
Measurements The primary outcome was hypertension control, defined as last measured blood pressure <140/90. Statistical process control was used to establish baseline performance and assess special cause variation resulting from the two-step intervention.
Results Hypertension control improved by 11.6% from a baseline of 66.8% to a 6 month average of 78.2%.
Limitations Durability of system changes has not been demonstrated beyond the 14-month period of the intervention. The observed improvement may underestimate the effect size of the full hypertension care pathway, as two of the five steps have only been partially implemented.
Conclusions Success factors included experienced improvement leaders, a focus on engaging front-line staff, the situational use of lean principles to make the work easier, better, faster and cheaper (in that order of emphasis), and the use of statistical process control to learn from variation. The challenge of transforming care delivery in the safety net warrants a closer look at the principles, relevance and potential impact of lean thinking in FQHCs.
InTroducTIon
Achieving better outcomes at lower cost in the healthcare safety net is a critical driver for
improving health and slowing the growth of healthcare costs nationally.1–7 The healthcare safety net refers to ‘providers that organize and deliver a significant level of both health care and other health-related services to the unin-sured, Medicaid, and other vulnerable popu-lations.’8 9 Federally qualified health centres (FQHC) are the preferred primary care provider (PCP) for over 25 million people in the safety net10 and have been shown to deliver higher quality care at lower cost.11–15 But in order to maximise Medicaid fee-for-ser-vice payments,16 17 FQHCs have developed care processes that emphasise increasing visit volume rather than improving population health.18 19 Medicaid’s recent experiments in value-based payments for accountable care organisations (ACO)20 21 help align financial incentives with higher value care for popula-tions, but there is a timing problem: shared savings begin to accrue 12–18 months after costs are incurred for care redesign, putting the transition to new care models out of reach for many cash-strapped FQHCs.22–24 As a result, many FQHCs remain in a risk-averse position, unwilling or unable to make the investments needed for care transformation.
Lean thinking offers a potential solution: by broadly engaging front-line staff in scientific problem solving, FQHCs can create robust system-level improvement at relatively low cost. The translation of lean thinking from its original intentions25–29 to healthcare has largely focused on adopting the visible tools and practices of Toyota and other perceived lean experts,30–34 resulting in a perception that ‘doing lean’ is equivalent to following a prescribed order of steps to remove waste from a value stream. The perspective of the authors, and the approach described in this paper, is that lean thinking always begins with an understanding of the purpose-driven problem you are trying to solve, but every step after that depends on the specific
copyright.
on September 12, 2020 by guest. Protected by
situation. The tools employed to understand the causes of the problem—including how precisely or thoroughly those tools are deployed—should be just what is needed to discover the root causes, and no more. Similarly, the countermeasures used to address those causes should be sufficiently sophisticated and robust to close the identi-fied gap, and no more. Because people are at the centre of these efforts to understand and design improvements, a focus on developing vital, flexible and capable teams is a cornerstone of lean thinking. Lean thinking can therefore be summarised as a situational leadership prac-tice that balances respect for people with continuous improvement to maximise customer value while mini-mising waste.35–37
Statistical process control (SPC) can augment the use of lean thinking in FQHCs by avoiding the twin prob-lems of over-reacting to process noise inherent in the system and under-reacting to actual changes in system performance.38–41 In a resource-limited setting, SPC is especially valuable in helping teams quickly confirm the effect of process changes (in order to build on and spread improvements) without wasting time and increasing change fatigue by chasing insignificant variation.
Despite the successful use of lean principles in many industries42–44 including healthcare,45–48 the current medical literature presents lean predominantly as a cost-cutting strategy that tends to undermine team cohe-sion, patient-centred care and professional autonomy.49–54 As a result, healthcare organisations may overlook the potential of lean thinking to achieve the ‘quadruple aim’55 by enabling joy in work for staff, better experience of care for patients, better health for populations and lower overall cost.
The aims of this report are to: (1) demonstrate system-level improvement in hypertension control in a large FQHC contemplating a shift to Medicaid value-based payments; (2) describe the situation-specific use of lean thinking and SPC to engage teams in the design and implementation of a multicomponent hypertension care pathway; and (3) contribute to a fuller understanding of lean thinking as a leadership practice to engage people in purposeful, scientific problem solving—one that may have particular relevance for FQHCs seeking to trans-form care with limited financial resources.
MeThods
setting and participants
Lynn Community Health Center (LCHC) is the third largest FQHC in the state of Massachusetts serving 44 787 patients with >650 employees and an annual budget of $87 million. LCHC was founded in Lynn, MA, in 1962 as a behavioural health clinic in response to an identified community need. LCHC has grown to provide compre-hensive integrated primary and behavioural healthcare, obstetrics, infectious diseases (HIV, tuberculosis, hepa-titis C), addictions, dental, eye, elder services and home-less care at over 20 sites including 13 public schools in
Lynn. Nearly 94% of LCHC’s patients live at or below 200% of the federal poverty level, 60.5% are enrolled in Medicaid, 82.3% belong to a racial/ethnic minority and 59.1% are best served in a language other than English.56 In September 2016, LCHC became 1 of 15 members in an all-FQHC ACO (the first of its kind in the USA) called the Community Care Cooperative (C3).57 C3 entered the pilot phase of Massachusetts’ Medicaid ACO58 begin-ning in December 2016 and expects to participate in the full ACO beginning in March 2018. With over 60% of its patients enrolled in Medicaid, LCHC’s top strategic priority in 2017 was preparing for the coming ACO, including transforming care processes to improve popu-lation health.
LCHC’s lean journey began in October 2014, in response to the challenge of implementing a new elec-tronic medical record system (Epic) while also improving and streamlining primary care workflows. LCHC hired a physician improvement leader to support this effort. A 6-month discovery and design process engaged 24 front-line team members to make the daily work of medical assistants, nurses and providers easier, better and faster. Three-day encounter closure rates increased from 60% to 95% on the day of Epic go-live, with gains sustained since May 2015. Despite changing nearly all team members’ workflows, no union grievances or staff complaints occurred, and morale across primary care improved. Following the success of Epic implementation, LCHC senior leadership embraced lean thinking as the health centre’s formal improvement strategy, hired a lean engineer with 10 years’ prior experience in healthcare, conducted a learning visit to ThedaCare in Wisconsin and developed a formal partnership with the Lean Enter-prise Institute in Cambridge, MA.
In May 2016, prior to the intervention, LCHC had 4762 adult patients (18–85 years old) with a known diagnosis of hypertension, of whom 3148 (66.8%) were controlled, defined as a last measured blood pressure <140/90. A planning document (online supplementary appendix figure 1) noted that there was no agreed practice standard for hypertension at LCHC, PCPs were responsible for all prescribing decisions, there was no standard process for population health outreach and there was no prior expe-rience with SPC.
Intervention
Appropriate treatment of hypertension has been esti-mated to prevent one death for every 125 patients treated, one stroke for every 67 patients and one heart attack for every 100 patients.59 LCHC set a goal of improving hypertension control for 628 people (ie, 66.8% to >80% of LCHC’s patients with hypertension) and potentially preventing nine strokes, six heart attacks and five deaths. From a lean thinking perspective, this was the clear value for customer that defined our value-driven purpose for hypertension control and was communicated to our teams.
copyright.
on September 12, 2020 by guest. Protected by
We designed and implemented a two-step interven-tion to improve hypertension control: (1) In June 2016, LCHC created organisational focus around hyperten-sion improvement using lean ‘strategy deployment’; and (2) In December 2016, LCHC implemented a multicom-ponent hypertension care pathway designed using lean principles.
Step 1: focus on hypertension
Prior to the intervention, an exercise with LCHC lead-ership revealed that over 130 projects were in process or expected to start within the next 6 months (online supplementary appendix figure 2). Recognising that ‘if everything is a priority, nothing is a priority,’ LCHC lead-ership committed to using lean principles to help focus, align and engage its people around the few vital actions most likely to advance the organisation’s mission. The lean practice of ‘strategy deployment’ was selected as a coun-termeasure to prevent senior leaders from overwhelming the bandwidth of middle managers through lack of focus, too many priorities and constant firefighting.60 61
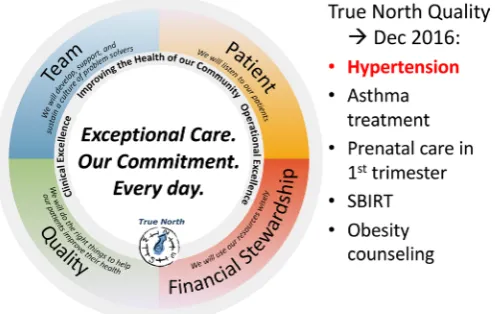
The first step in strategy deployment is to understand the organisational direction. Senior leaders created LCHC’s True North Compass, with ‘exceptional care, our commitment, every day’ at the centre and a limited set of metrics and priority actions in the four areas of Team, Patient, Quality and Financial Stewardship (figure 1). True North refers to ‘An organization’s strategic and phil-osophical vision or purpose. It is a bond that may include ‘hard’ business goals such as revenue and profits as well as ‘broadbrush’ visionary objectives that appeal to the heart.’61 62
Five quality targets of varying difficulty were chosen with hypertension selected as a template chronic condi-tion that would help LCHC establish a better system for population healthcare. The True North Compass and five quality areas were shared in an all staff meeting in June 2016, together with a renewed emphasis on the core mission of the organisation in the context of the coming Medicaid ACO.
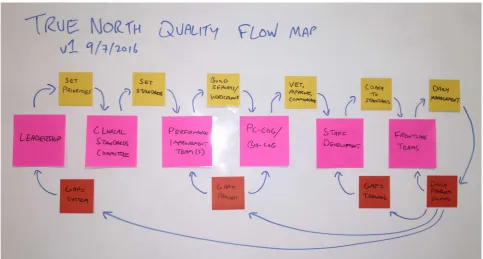
LCHC’s next step in strategy deployment was to link organisational priorities to the daily work of front-line teams. A True North Quality Flow Map (figure 2) was created, in which:
1. Leadership sets the direction and target (eg, achieve hy-pertension control of ≥80% by 31 December 2017. 2. A Clinical Standards Committee determines the relevant
evidence-based practice standard.
3. Performance improvement teams engage front-line staff to design and test workflows.
4. The Primary Care Clinical Oversight Group (comprised of the medical directors and nurse managers of each of LCHC’s nine primary care teams) vets the workflows, votes to approve them for use across primary care and communicates the new standards to their teams. 5. A staff development function coaches front-line team
members to be able to practise the new standard re-liably.
6. A daily management system troubleshoots performance problems and routes training issues to staff develop-ment, process issues to the performance improvement team, or systems issues to senior leadership.
This six-step process represents a version of the lean prac-tice of ‘catchball’, in which key stakeholders cascade and negotiate goals and specific actions to meet those goals from the top of the organisation through to the front line. While Epic implementation had followed this six-step process, in general this way of working was new to LCHC.
Step 2: implement a multicomponent hypertension care pathway
LCHC’s Hypertension Care Pathway was designed following the lean principle that all process improvement should have four goals in this order of emphasis63: 1. Easier (intuitive and easily understood, as little wasted
motion as possible). 2. Better (higher quality).
3. Faster (shorten the time to achieving hypertension con-trol at the patient and population level).
4. Cheaper (near term by safely sharing the work with lower cost team members; long term by preventing emergency visits, hospitalisations and cardiovascular disease).
To address the challenge of consistent and straightfor-ward communication across nearly 200 clinical staff in different care settings, a design team created a five-step framework for the LCHC Hypertension Care Pathway (figure 3), based on review of the medical literature and lessons learnt from a successful hypertension improve-ment effort at Virginia Mason Medical Center. This simple visual was used consistently and ubiquitously (in Figure 1 Lynn Community Health Center (LCHC) created
a True North Compass to focus on ‘exceptional care, our commitment, every day’ through the four domains of: (1) Team—‘we will develop, support, and sustain a culture of problem solvers’; (2) Patient—‘we will listen to our patients’; (3) Quality—‘we will do the right things to help our patients improve their health’; and (4) Financial Stewardship—‘we will use our resources wisely.’ In fiscal year 2016 (FY2016), LCHC limited its focus to five quality targets, including hypertension. SBIRT, Screening, Brief Intervention, Response to Treatment.
copyright.
on September 12, 2020 by guest. Protected by
communications, during meetings, posted in clinical areas) to facilitate staff alignment and understanding of the essential steps in the care pathway.
Five separate design teams (comprising a mix of clinical staff and front-line managers, facilitated by a physician
improvement leader) designed, tested and iterated ‘stan-dardized work’64–66 for each of the five key steps over a period of 6 months (see online supplementary appendix figures 3–6). The two purposes of this standardised work were to (1) facilitate training and maintenance of a consistent approach across LCHC, and (2) more readily recognise when the standard needed to be improved in order to meet the defined targets. Throughout the design process, the goals of easier, better, faster and cheaper (in that order of priority) were emphasised and the stan-dards continuously iterated and improved. For example, the outreach team opted to use Epic’s Reporting Work-bench because its direct integration into the electronic health record would avoid the need to shift between two systems (easier) and eliminate the possibility of transcrip-tion errors (better). Within Reporting Workbench, the hypertension registry was redesigned (online supplemen-tary appendix figure 7) to remove visual clutter, reducing from 30 to 11 columns (easier). Embedded data links were selected to enable a team member to work intui-tively from left to right, answering each question in the workflow in turn without needing to switch to a different screen (easier). The result of this process was a set of clear, intuitive and collaboratively designed workflows that clinical teams readily accepted as sensible ways to accomplish the organisation’s goal of improving hyper-tension control.
We launched the LCHC Hypertension Care Pathway in December 2016 with an educational session on Eighth Joint National Committee standards for all PCPs and nurses, followed by in-service training for all clin-ical staff on how to accurately measure blood pressure (online supplementary appendix figure 4). To further Figure 2 Lynn Community Health Center’s (LCHC) True North Quality Flow Map links strategic priorities to front-line teams and escalates system, process and training problems to the appropriate level of the organisation.
Figure 3 LCHC based its five-step hypertension care pathway on a review of the medical literature, including lessons learnt from a successful hypertension improvement effort at Virginia Mason Medical Center. This simple visual was used consistently and ubiquitously (in communications, during meetings, posted in clinical areas) to facilitate staff alignment and understanding of the essential steps in the care pathway. BH, behavioural health; BP, blood pressure; DO, Doctor of Osteopathy; HTN, hypertension; LCHC, Lynn Community Health Center; MA, medical assistant; MD, Doctor of Medicine; MED, medical provider; NP, nurse practitioner; PA, physician assistant ; RN, registered nurse.
copyright.
on September 12, 2020 by guest. Protected by
facilitate effective and efficient training, we used the lean ‘job instruction’ method,66–68 which uses 1:1 coaching and observed practice over time to emphasise a limited number of key points (the critical elements that make or break the process) and the reasons why those key points matter. This initial launch was followed by several rounds of training on the outreach workflow from January through March 2017, followed by team-by-team imple-mentation of nurse hypertension care pathway visits (in which nurses adjust up to three medications on the care pathway following PCP delegated orders) beginning in April 2017.
Measures
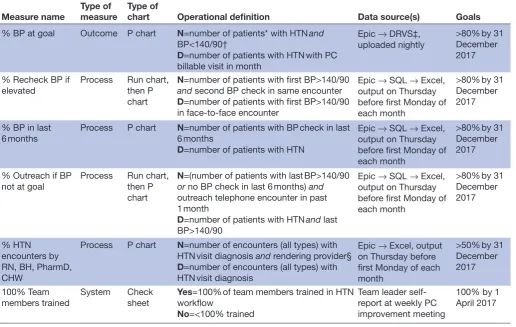
The next problem to solve was how to recognise if the new standardised work was occurring as intended, and if so whether it was advancing the overall goal of controlling hypertension in LCHC’s population. A newly designed hypertension scorecard tracked five metrics corre-sponding to the primary outcome (hypertension control) and key process steps in the LCHC Hypertension Care Pathway (table 1).
Hypertension control data were downloaded nightly from Epic to a data warehouse (DRVS) where they were accessible to clinical team members in near real time. A quality analyst abstracted data from Epic to create the process metrics for blood pressure recheck if elevated, hypertension visits by provider type and outreach. Staff training on hypertension workflows was tracked weekly during Primary Care Clinical Oversight Group meetings (online supplementary appendix figure 8).
data analysis
SPC was used to understand the effect of the two-step intervention on hypertension control, using the previous 24 months to establish baseline performance. The methods and application of SPC in healthcare have been thoroughly described.40 69–71 Attribute data with varying subgroup sizes were represented in P charts using QI Macros 2016 software. The Institute for Healthcare Improvement rules were used to differentiate special cause variation.69 Both system and team-level data were analysed to understand variation and correlation of cause and effect as teams implemented the hypertension Table 1 LCHC hypertension measurement plan
Measure name
Type of measure
Type of
chart Operational definition Data source(s) Goals
% BP at goal Outcome P chart N=number of patients* with HTN and BP<140/90†
D=number of patients with HTN with PC billable visit in month
Epic → DRVS‡, uploaded nightly
>80% by 31 December 2017
% Recheck BP if elevated
Process Run chart, then P chart
N=number of patients with first BP>140/90 and second BP check in same encounter D=number of patients with first BP>140/90 in face-to-face encounter
Epic → SQL → Excel, output on Thursday before first Monday of each month
>80% by 31 December 2017
% BP in last 6 months
Process P chart N=number of patients with BP check in last 6 months
D=number of patients with HTN
Epic → SQL → Excel, output on Thursday before first Monday of each month
>80% by 31 December 2017
% Outreach if BP not at goal
Process Run chart, then P chart
N=(number of patients with last BP>140/90 or no BP check in last 6 months) and outreach telephone encounter in past 1 month
D=number of patients with HTN and last BP>140/90
Epic → SQL → Excel, output on Thursday before first Monday of each month
>80% by 31 December 2017
% HTN encounters by RN, BH, PharmD, CHW
Process P chart N=number of encounters (all types) with HTN visit diagnosis and rendering provider§ D=number of encounters (all types) with HTN visit diagnosis
Epic → Excel, output on Thursday before first Monday of each month
>50% by 31 December 2017
100% Team
members trained System Check sheet
Yes=100% of team members trained in HTN workflow
No=<100% trained
Team leader self-report at weekly PC improvement meeting
100% by 1 April 2017
*All patients were empaneled to an LCHC primary care provider (PCP).
†Blood pressure goal of <140/90 defined by the Uniform Data System (UDS) for community health centres. ‡DRVS from Azara, Data Reporting and Analytics Solutions software.
§Rendering provider: RN, behavioural health, PharmD or community health worker.
BH, behavioural health; BP, blood pressure; CHW, community health worker; HTN, hypertension; LCHC, Lynn Community Health Center; PC, primary care; RN, registered nurse; SQL, Structured Query Language for data analysis.
copyright.
on September 12, 2020 by guest. Protected by
care pathway at different times and with varying degrees of success. The physician improvement leader sent a monthly communication to all clinical staff and LCHC leadership with results and interpretation of the hyper-tension scorecard, noting special cause and likely correla-tion with teams’ improvement efforts.
ethical considerations and funding
Clinical care consent was obtained from all patients at LCHC. All interventions followed evidence-based guide-lines and were funded as part of usual clinical operations at LCHC. The Revised Standards for Quality Improve-ment Reporting Excellence 2.0 was used to prepare this report.
resulTs
Baseline hypertension control at LCHC from March 2014 through May 2016 averaged 66.8% (figure 4). Lower control rates from December 2014 through March 2015 (special cause attributed to a winter with record-breaking snowfall) were omitted from the baseline calculation to avoid overestimating the effect size of the intervention.
In June 2016, step 1 of the intervention (organisa-tion-wide focus on hypertension) resulted in an imme-diate improvement in hypertension control to 72.3%. From December 2016 through August 2017, step 2 of the intervention (implementation of a multicomponent hypertension care pathway) resulted in an aggregate increase in hypertension control to 78.2%. The overall improvement from baseline to the average of the most recent 6 months was 11.6%.
Analysis of team-level data showed that six out of the seven adult primary care teams achieved special cause improvement during the intervention period. The improvement occurred at different times and was closely correlated with teams’ success at implementing various steps of the hypertension care pathway (figure 4).
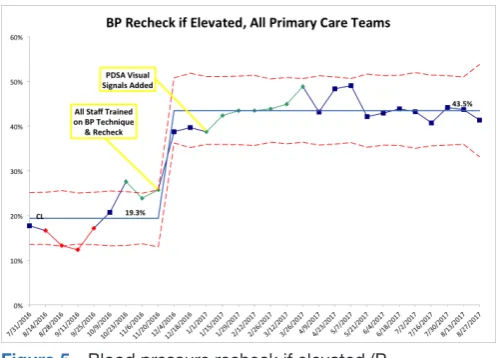
The process data facilitated several rounds of rapid cycle improvement. For example, initial blood pressure recheck rates were low, prompting an investigation into potential barriers. Two root causes were identified: (1) the correct blood pressure cuffs often were not available in the exam room; and (2) communication of elevated blood pressure was often omitted when medical assistants did not have time to talk with providers between visits. One series of Plan-Do-Study-Adjust (PDSA) cycles37 72–75 improved availability of correct blood pressure cuffs from 50%–70% to >95% (verified in random audits) by using the lean principle of ‘5S’76 77 to create a standard location for the four cuff sizes in all exam rooms (online supple-mentary appendix figure 9b). To facilitate communica-tion of elevated blood pressure from medical assistants and provider recheck of blood pressure, a second PDSA series used the lean principle of ‘visual control’78–80 to create two additional signals of elevated blood pressure: a standard blood pressure column on the Epic clinical schedule (online supplementary appendix figure 10) and
a red stop sign on the exam room door that the provider takes into the room and turns over to green after they recheck the pressure (online supplementary appendix figure 11). The result of both PDSA series was improve-ment in blood pressure recheck rates from 19.3% to 43.5% (figure 5).
dIscussIon
We achieved an 11.6% system-wide improvement in hypertension control among 4762 adult patients over a period of 14 months in a large FQHC without external funding or additional staff using lean thinking and SPC. Our two-step intervention began by creating organi-sation-wide focus on hypertension, then introduced a multicomponent hypertension care pathway. Within that two-step intervention, we applied a consistent approach of situational lean thinking to understand and address specific problems and obstacles discovered along the way. We used SPC to demonstrate a clear link between implementation of the pathway and improved hyperten-sion control as well as facilitate shared learning among seven integrated primary care/behavioural health teams. In August 2017, hypertension control exceeded LCHC’s True North target of 80% 4 months ahead of schedule. In November 2017, LCHC was selected as a 2017 Million Hearts Hypertension Control Champion by the US Centers for Disease Control and Prevention.81
Four key success factors included: 1. Experienced improvement leaders.
2. Organisational focus on empowering and engaging front-line staff to understand the problem and design intuitive processes that made the work easier, better, faster and cheaper (in that order of emphasis).
3. Situational, context-specific use of lean principles (eg, strategy deployment, standardised work, job instruc-tion, PDSA, 5S, visual control).
4. Use of SPC to learn from variation and facilitate the spread of improvement.
Interpretation
The initial 5.5% improvement likely resulted from a Hawthorne effect (in which individuals modify their behaviours in response to the awareness of being observed82), amplified by LCHC’s organisational focus on hypertension. The subsequent 5.9% improvement likely resulted from implementing the multicompo-nent hypertension care pathway, specifically the first three pathway steps where we observed broad adoption: (1) check blood pressure accurately, (2) recheck blood pressure if elevated, and (3) diagnose and treat hyper-tension correctly. Given only partial adoption to date, it is not yet clear what the full effect will be of implementing step 4 (coach lifestyle changes while sharing the care with other team members) and step 5 (outreach if blood pres-sure is above goal or has not been checked within the last 6 months). Though much work remains to be done, our results to date demonstrate that as a group, nearly 200
copyright.
on September 12, 2020 by guest. Protected by
LCHC clinical staff changed their approach to hyperten-sion and sustained that change over 14 months.
Our report also presents lean thinking as a situational, balanced approach to engaging people, understanding
root cause and improving processes that is not adequately represented in the current medical literature.50–54 83–86 The consequences of this incomplete understanding of lean thinking include:
Figure 4 (A) Lynn Community Health Center (LCHC) hypertension control, March 2014 to August 2017 (P
chart). (B) Hypertension control by primary care team (P chart). (A, B) Statistical process control charts tracking hypertension control performance at the system and individual team levels were shared monthly with brief interpretation by the physician improvement leader. This helped teams understand the effect of implementing the LCHC Hypertension Control Pathway on improved performance. BP, blood pressure; CL, center line; HTN, hypertension; MSWA, Market Square/Western Avenue.
copyright.
on September 12, 2020 by guest. Protected by
1. Failure of top-down interventions (often designed by senior leaders or improvement specialists without meaningful engagement of front-line staff) due to incomplete understanding of the root causes of the problem and perceived disrespect.
2. ‘Copy/paste’ thinking which expects to replicate pro-cesses and results from one context and organisation to another. In this case, failure to understand and adapt to the nuances of the second context leads to divergent (usually worse) results.
3. Aiming for easier, better, faster and cheaper, but out of sequence. Front-line staff resent the emphasis on bot-tom line savings ahead of making the work intuitive, ef-ficient and safe. Morale suffers and the effort founders in the implementation phase.
4. The net result is that most so-called lean initiatives fail to deliver better value at lower cost, prompting justifi-able scepticism among influential leaders in the medi-cal community.52–54 87
Lean principles—properly understood and incorporated into an organisation’s thinking, behaviours and daily processes—can enable healthcare organisations to deliver extraordinary value to their patients, create meaningful and well-remunerated work for employees and accelerate health system transformation towards the quadruple aim. Lean thinking may be a particularly good fit for FQHCs who, like LCHC, face the existential crisis of achieving care transformation with limited resources and without the necessary cash flow to absorb 1–2 years of losses before investments in care redesign materialise into financial savings. LCHC was able to accomplish important first steps in care transformation without external funding or additional staff. Others may be able to benefit from our experience—not to replicate the specific steps, but rather to develop the capability for lean thinking in their
people and thereby reduce both uncertainty and risk in embarking on systemic change.
limitations
Our study has several limitations. We have not demon-strated durable results beyond 14 months. If our organ-isational focus wavers, our processes may degrade, and performance may regress towards baseline. Since part of the hypertension care pathway has not been fully imple-mented across all teams, we are unable to estimate the effect of the full pathway on hypertension control in our patient population. Despite these significant limitations, we believe our results are generalisable to the extent that the problems we faced are widely shared among FQHCs and the approach to engaging staff and applying situa-tional lean thinking and SPC would likely be successful in other FQHC contexts.
conclusIons
There is a proven way to achieve the quadruple aim: the situational use of lean principles to engage and empower people in scientific problem solving. The challenge is developing capability for lean thinking while avoiding the pitfalls of top-down interventions, copy/paste thinking and aiming for easier, better, faster and cheaper out of sequence—and then finding the courage to persist. We embraced lean thinking 3 years ago and successfully began the journey towards improving population health at lower cost. We invite other FQHCs, health system leaders and policymakers to take a closer look at the prin-ciples, relevance and potential impact of lean thinking in resource-limited settings.
Acknowledgements We thank our patients and the many colleagues who contributed to the design and implementation of LCHC’s Hypertension Care Pathway. We thank Lloyd Provost for his review of our SPC analysis and Paul Barach for his review of our final manuscript. We also thank Norifumi Kamo and Kim Pittenger at Virginia Mason Medical Center in Seattle, WA and the Lean Enterprise Institute in Cambridge, MA for their insights and support.
Contributors PL, LP, SO, KE, EF, TR, AR, JR, DS, VA, KKB, AL and KM contributed to the planning and implementation of the work described in the article. PL and LP wrote the manuscript with support from TR. PL, LP, SO, KE, EF, TR, AR, JR, DS, VA, KKB, AL and KM reviewed drafts and approved the final manuscript for submission. PL is responsible for overall content of the manuscript.
Funding The authors have not declared a specific grant for this research from any funding agency in the public, commercial or not-for-profit sectors.
Competing interests None declared.
Patient consent Not required.
Provenance and peer review Not commissioned; externally peer reviewed.
Data sharing statement No additional data are available.
Open access This is an open access article distributed in accordance with the Creative Commons Attribution Non Commercial (CC BY-NC 4.0) license, which permits others to distribute, remix, adapt, build upon this work non-commercially, and license their derivative works on different terms, provided the original work is properly cited, appropriate credit is given, any changes made indicated, and the use is non-commercial. See: http:// creativecommons. org/ licenses/ by- nc/ 4. 0/.
Figure 5 Blood pressure recheck if elevated (P chart). Statistical process control charts also tracked process steps within the Lynn Community Health Center (LCHC) Hypertension Care Pathway, for example, the rate of blood pressure recheck if the initial measurement was above 140/90. BP, blood pressure; CL Center Line, or Mean; PDSA, Plan-Do-Study-Adjust.
copyright.
on September 12, 2020 by guest. Protected by
references
1. Shi L, Stevens GD, Politzer RM. Access to care for U.S. health center patients and patients nationally: how do the most vulnerable populations fare? Med Care 2007;45:206–13.
2. Shi L, Stevens GD. The role of community health centers in delivering primary care to the underserved: experiences of the uninsured and Medicaid insured. J Ambul Care Manage 2007;30:159–70. 3. Politzer RM, Schempf AH, Starfield B, et al. The future role of
health centers in improving national health. J Public Health Policy 2003;24:296–306.
4. Starfield B, Shi L, Macinko J. Contribution of primary care to health systems and health. Milbank Q 2005;83:457–502.
5. Shi L, Starfield B, Kennedy B, et al. Income inequality, primary care, and health indicators. J Fam Pract 1999;48:275–84.
6. Adashi EY, Geiger HJ, Fine MD. Health Care Reform and Primary Care — The Growing Importance of the Community Health Center. N Engl J Med Overseas Ed 2010;362:2047–50.
7. Rothkopf J, Brookler K, Wadhwa S, et al. Medicaid patients seen at federally qualified health centers use hospital services less than those seen by private providers. Health Aff 2011;30:1335–42. 8. Lewin ME, Baxter RJ. America's health care safety net: revisiting the
2000 IOM report. Health Aff 2007;26:1490–4.
9. Institute of Medicine. In: Lewin ME, Altman S, eds. Health Care Safety Net: Intact but Endangered. Washington, DC: The National Academies Press, 2000:308.
10. National Association of Community Health Centers. Strengthening the Safety Net: Community Health Centers on the Front Lines of American Health Care, 2017.
11. Epstein AJ. The role of public clinics in preventable hospitalizations among vulnerable populations. Health Serv Res 2001;36:405. 12. Falik M, Needleman J, Wells BL, et al. Ambulatory care sensitive
hospitalizations and emergency visits: experiences of Medicaid patients using federally qualified health centers. Med Care 2001;39:551–61.
13. Hadley J, Cunningham P. Availability of safety net providers and access to care of uninsured persons. Health Serv Res 2004;39:1527–46.
14. Nocon RS, Lee SM, Sharma R, et al. Health Care Use and Spending for Medicaid Enrollees in Federally Qualified Health Centers Versus Other Primary Care Settings. Am J Public Health 2016;106:1981–9.
15. Mukamel DB, White LM, Nocon RS, et al. Comparing the Cost of Caring for Medicare Beneficiaries in Federally Funded Health Centers to Other Care Settings. Health Serv Res 2016;51:625–44.
16. Henry J. Kaiser Family Foundation. Community Health Centers Kaiser Commission on Medicaid and the Uninsured. 2009 https:// kais erfa mily foun dation. files. wordpress. com/ 2013/ 01/ 7877. pdf. 17. Henry J, Foundation KF. Community Health Centers in an Era of
Health Reform: An Overview and Key Challenges to Health Center Growth Executive Summary Kaiser Commission on Medicaid and the Uninsured, 2013.
18. Rosenbaum S, Shin P, Sharac J. Community Health Centers and the Evolution of Medicaid Payment Reform. 2016 http://www. commonwealthfund. org/ publications/ blog/ 2016/ oct/ community- health- centers- medicaid- payment- reform (accessed 28 Dec 2017). 19. McConnell KJ, Chernew ME. Controlling the Cost of Medicaid. N
Engl J Med 2017;377:201–3.
20. Cunningham P, Felland L, Stark L. Safety-net providers in some US communities have increasingly embraced coordinated care models. Health Aff 2012;31:1698–707.
21. Lewis VA, Colla CH, Schoenherr KE, et al. Innovation in the safety net: integrating community health centers through accountable care. J Gen Intern Med 2014;29:1484–90.
22. Ziring JP, Tatem KS, Newton-Dame R, et al. Coverage Expansion and Delivery System Reform in the Safety Net: Two Sides of the Same Coin. 2017 https:// catalyst. nejm. org/ safety- net- coverage- expansion- system- reform/ (22 Jun 2017).
23. Smith VK. Can States Survive The Per Capita Medicaid Caps In The AHCA? Health Affairs Blog 2017 (published Online First: May 17 2017).
24. Fiedler M, Aaron HJ, Adler L, et al. Moving in the Wrong Direction - Health Care under the AHCA. N Engl J Med 2017;376:2405–7. 25. Ohno T. Taiichi Ohnos Workplace Management: Special 100th
Birthday Edition: McGraw-Hill Education, 2012.
26. Ohno T. Toyota Production System: Beyond Large-Scale Production: Taylor & Francis, 1988.
27. Wakamatsu Y. The Toyota Mindset: The Ten Commandments of Taiichi Ohno: Enna Products Corporation, 2017.
28. Nakamuro J. Kaizen: Lost in Translation February 7th, 2016. 2018. cited https://www. linkedin. com/ pulse/ beyond- toyota- continuous- evolution- tps- kaizen- jun- nakamuro/.
29. Nakamuro J. Beyond Toyota - The Continuous Evolution of TPS and Kaizen. 2018 https://www. linkedin. com/ pulse/ beyond- toyota- continuous- evolution- tps- kaizen- jun- nakamuro/.
30. Brandao de Souza L. Trends and approaches in lean healthcare. Leadersh Health Serv 2009;22:121–39.
31. de Souza LB, Pidd M. Exploring the barriers to lean health care implementation. Public Money & Management 2011;31:59–66. 32. Toussaint JS, Berry LL. The promise of Lean in health care. Mayo
Clin Proc 2013;88:74–82.
33. Waring JJ, Bishop S. Lean healthcare: rhetoric, ritual and resistance. Soc Sci Med 2010;71:1332–40.
34. Moraros J, Lemstra M, Nwankwo C. Lean interventions in healthcare: do they actually work? A systematic literature review. Int J Qual Health Care 2016;28:150–65.
35. Lawal AK, Rotter T, Kinsman L, et al. Lean management in health care: definition, concepts, methodology and effects reported (systematic review protocol). Syst Rev 2014;3:103.
36. Lean Enterprise Institute. What is Lean? 2000 https://www. lean. org/ WhatsLean/ (accessed 9 Jul 2017).
37. Rother M. Toyota Kata: Managing People for Improvement. Adaptiveness and Superior Results: McGraw-Hill Education, 2009. 38. Carey RG, Stake LV. Improving healthcare with control charts: basic
and advanced spc methods and case studies: ASQ Quality Press, 2003.
39. Thor J, Lundberg J, Ask J, et al. Application of statistical process control in healthcare improvement: systematic review. Qual Saf Health Care 2007;16:387–99.
40. Provost LP, Murray S. The Health Care Data Guide: Learning from Data for Improvement: Wiley, 2011.
41. Popovich E, Wiggins H, Barach P. The patient flor physics framework. In: Sollecito W, Jonhnson J, eds. Continuous quality improvement in health care: theory, implementations and applications. 5th ed: Jones and Bartlett, 2017.
42. Chen JC, Cox RA. Value Stream Management for Lean Office—A Case Study. American Journal of Industrial and Business Management 2012;02:17–29.
43. Jargon J. Latest Starbucks buzzword: 'Lean' Japanese
Techniques. Wall Street Journal 2009 https://www. wsj. com/ articles/ SB124933474023402611 (4th Aug 2009).
44. The lean journey at the Boeing Company. ASQ World Conference on Quality and Improvement Proceedings: American Society for Quality, 2005.
45. Barnas K. ThedaCare's business performance system: sustaining continuous daily improvement through hospital management in a lean environment. Jt Comm J Qual Patient Saf 2011;37:387–AP8. 46. Mannon M. Lean healthcare and quality management: the experience
of thedaCare. Quality Management Journal 2014;21:7–10.
47. Meyer H. Group health’s move to the medical home: for doctors, it’s often a hard journey. Health Aff 2010;29:844–51.
48. Kenney C. Transforming health care: Virginia Mason Medical Center's pursuit of the perfect patient experience: CRC Press, 2012.
49. Meyer H. Life in the 'lean' lane: performance improvement at Denver Health. Health Aff 2010;29:2054–60.
50. Mazzocato P, Savage C, Brommels M, et al. Lean thinking in healthcare: a realist review of the literature. Qual Saf Health Care 2010;19:376–82.
51. Poksinska B. The current state of Lean implementation in health care: literature review. Qual Manag Health Care 2010;19:319–29. 52. Rutledge J, Martin L. Medical Taylorism, Lean, and Toyota. N Engl J
Med 2016;374:1993–4.
53. Hartzband P, Groopman J. Medical taylorism. N Engl J Med Overseas Ed 2016;374:106–8.
54. Rees GH, Gauld R. Can lean contribute to work intensification in healthcare? J Health Organ Manag 2017;31:369–84.
55. Bodenheimer T, Sinsky C. From triple to quadruple aim: care of the patient requires care of the provider. Ann Fam Med 2014;12:573–6. 56. Health Resources and Services Administration. Health Center Profile
Lynn Community Health Center 2016. 2016 https:// bphc. hrsa. gov/ uds/ datacenter. aspx? q= d& bid= 011430& state= MA (accessed 16 Oct 2017).
57. McDonough JE, Seligman W. Bending the Medicaid cost curve: Massachusetts is betting big on accountable care organizations. 2017. Common Wealth Magazine.
58. MassHealth Partners with Six Health Care Organizations to Improve Member Care. 2016 http://www. mass. gov/ eohhs/ gov/ newsroom/ press- releases/ eohhs/ masshealth- partners- with- six- health- care- organizations. html (accessed 13 Sep 2017).
59. McCormack. Blood Pressure Medicines for Five Years to Prevent Death, Heart Attacks, and Strokes. 2014 http://www. thennt. com/ nnt/ anti- hypertensives- to- prevent- death- heart- attacks- and- strokes/.
copyright.
on September 12, 2020 by guest. Protected by
60. Taninecz G. ThedaCare: Center for Healthcare Value: Strategy Deployment Healthcare Value Report. 2011 https:// createvalue. org/ wp- content/ uploads/ Strategy- Deployment_ TCHV_ withQRC. pdf. 61. Dennis P. Getting the Right Things Done: A Leader's Guide to
Planning and Execution: Lean Enterprise Institute, 2006.
62. Shook J, Marchwinski C. Lean Enterprise Institute I. Lean Lexicon: A Graphical Glossary for Lean Thinkers: Lean Enterprise Institute, Incorporated, 2014.
63. Shingo S. Non-Stock Production: The Shingo System of Continuous Improvement: Taylor & Francis, 1988.
64. Womac J, Jones D. Lean thinking. New York: Simon and Schuster, 1996.
65. Hamilton B, Wardwell P. e2 Continuous Improvement System: (Managing & Sustaining your Lean Transformation through the "e2 everybody, everyday" Approach to Lean): GBMP, Inc, 2010. 66. Narusawa T, Shook J. Kaizen Express: Fundamentals for Your Lean
Journey: Lean Enterprise Institute, 2009.
67. Huntzinger J. The roots of lean. Training Within Industry: The Origin of Kaizen, Association for manufacturing Excellence, 2002:14–23. 68. Standard work from a lean theory perspective. Annual Conference of
the International Group for Lean Construction, 2008.
69. Benneyan JC, Lloyd RC, Plsek PE. Statistical process control as a tool for research and healthcare improvement. Qual Saf Health Care 2003;12:458–64.
70. Carey RG, Lloyd RC. Measuring Quality Improvement in Healthcare: A Guide to Statistical Process Control Applications: Quality Resources. 1995.
71. Johnson JK, Barach PR. Quality improvement methods to study and improve the process and outcomes of pediatric cardiac care. Prog Pediatr Cardiol 2011;32:147–53.
72. Shook J. Managing to learn: using the A3 Management process to solve problems, gain agreement. Mentor and Lead: Lean Enterprise Institute, 2008.
73. Taylor MJ, McNicholas C, Nicolay C, et al. Systematic review of the application of the plan-do-study-act method to improve quality in healthcare. BMJ Qual Saf 2014;23:290–8.
74. Rother M. The Toyota Kata Practice Guide: practicing scientific thinking skills for superior results in 20 minutes a day: McGraw-Hill Education, 2017.
75. Rother M, Aulinger G. Toyota Kata Culture: building organizational capability and mindset through kata coaching: McGraw-Hill Education, 2017.
76. Rich N, Bateman N, Esain A, et al. Lean evolution: lessons from the workplace: Cambridge University Press, 2006.
77. Gapp R, Fisher R, Kobayashi K. Implementing 5S within a Japanese context: an integrated management system. Management Decision 2008;46:565–79.
78. Galsworth GD, Navarro A. Work that makes sense: operator-led visuality: Visual Thinking Incorporated, 2011.
79. Schonberger RJ. Applications of single-card and dual-card Kanban. Interfaces 1983;13:56–67.
80. Sugimori Y, Kusunoki K, Cho F, et al. Toyota production system and Kanban system Materialization of just-in-time and respect-for-human system. Int J Prod Res 1977;15:553–64.
81. Centers for Disease Control and Prevention. 2017 Million Hearts Hypertension Control Challenge Challenge. gov. 2017 https://www. challenge. gov/ challenge/ 2017- million- hearts- hypertension- control- challenge/ (accessed 11 Apr 2017).
82. Parsons HM. What Happened at Hawthorne?: New evidence suggests the Hawthorne effect resulted from operant reinforcement contingencies. Science 1974;183:922–32.
83. McDermott AM, Kidd P, Gately M, et al. Restructuring of the Diabetes Day Centre: a pilot lean project in a tertiary referral centre in the West of Ireland. BMJ Qual Saf 2013;22:681–8.
84. Mann D. The missing link: Lean leadership. Front Health Serv Manage 2009;26:15–26.
85. Kaplan GS, Patterson SH, Ching JM, et al. Why Lean doesn't work for everyone. BMJ Qual Saf 2014;23:bmjqs-2014-003248. 86. Vest JR, Gamm LD. A critical review of the research literature on
Six Sigma, Lean and StuderGroup's Hardwiring Excellence in the United States: the need to demonstrate and communicate the effectiveness of transformation strategies in healthcare. Implement Sci 2009;4:35.
87. Harrison ML. Limits of Lean — Transformative Care Redesign Must Go Beyond Typical Lean-Based Improvements. NEJM Catalyst 2017 (published Online First: 5 Feb 2017). copyright.
on September 12, 2020 by guest. Protected by