GUASNR
Forest Stand Types Classification Using Tree-Based
Algorithms and SPOT-HRG Data
A. Fallah1, S. Kalbi2, S. Shataee*3
1 Associate Professor, Sari University of Agricultural Sciences and Natural Resources, Sari 2 PhD candidate, Sari University of Agricultural Sciences and Natural Resources, Sari 3 Associate Professor, Gorgan University of Agricultural Sciences and Natural Resources
Received: July 2013 Accepted: December 2013
Abstract
Forest types mapping is one of the most necessary elements in forest management and Silviculture treatments. Traditional methods such as field surveys are time-consuming and cost-intensive. Improving satellite data sources and classification methods offer new opportunities for obtaining more accurate forest biophysical maps. This research compares performance of three non-parametric and tree-based algorithms i.e. the Classification and Regression Tree (CART), Boosting Regression Tree (BRT) and Random Forest (RF) for general forest type mapping using semi high resolution of SPOT-HRG data. Using systematic random sampling design in a small area of the Hyrcanian forests, tree and shrub species were registered in 150 sample plots. Naming of the general forest types in sample plots were done based on frequency of dominant species. After geometric and atmospheric corrections of SOPT-HRG data, suitable image processing transformations were applied to main bands to produce general vegetation indices and principal components. Three nonparametric algorithms performed the wall-to-wall forest type classification. The forest type maps were assessed using unused test plots. Results shows that RF compared to the other two algorithms with overall accuracy of 70% and kappa coefficient of 0.63 could better classify the forest stand types, while the CART method had the lowest accuracy with overall accuracy of 60% and kappa coefficient of 0.51. Performance results of the BRT classifier were slightly similar to RF classifier.
Keywords: Forest types classification, tree-based algorithms, Hyrcanian forest, SPOT-HRG1
1. Introduction
The forest stand type map shows spatial distribution of trees and shrubs species as a group or stand in forest ecosystem, so preparing of a correct forest stand type map is important for understanding forest status. Traditional methods such as field surveys are time-consuming and cost-intensive. Satellite data and their potential are offering new tools for managing and mapping the forest-covered areas. The advances in remote sensing technology together with improvements in estimation and classification algorithms offer opportunities for improving the retrieval of on time information with increased efficiency. The remote sensing data are alternatively produced from fine to coarse spatial resolutions, which are generally grouped to low resolution (like MODIS), medium resolution (like TM or ETM+), and high resolution (like IKONOS) with different spectral wavelengths. Investigations on capabilities of these data for different applications are the main interest of scientists and managers. Use of low spatial resolution imagery is not sufficient for retrieval of the biophysical forest attributes such as forest type or stands. Therefore, many investigations have focused on the capabilities of medium resolutions like Landsat-TM, ETM+ or ASTER data for estimation and classification of forest biophysical attributes. Capability of these data for different subjects relates to factors such as forest condition i.e. structure and composition (homogenous or heterogonous) together with topography conditions. Forests are spatially distributed throughout the world from tropical rain forests to cold and dry taiga with different structures and compositions. The Hyrcanian forests have different compositions and structures that differentiate them with other forests in the world. Among five large vegetation regions in Iran, the most important vegetation region according to density, canopy cover and diversity, is the Hyrcanian (Caspian) region that covers an area of 1,925,125 ha, extending throughout the south coast of the Caspian Sea in the northern part of the country. The Hyrcanian vegetation zone is a green belt stretching over the northern slopes of the Alborz mountain ranges (Sageb-talebi et al., 2003). It has a high production capacity due to humid temperate climate and suitable soil. The Hyrcanian forests extend for 800 km in length. These natural mixed-hardwood forests have comprised from tree species such as beech (Fagus orientalis), hornbeam (Carpinus betelus), alder (Alnus glutinosa), oak (Quercus castaneafolia), maple
(Acer velotonia), ironwood (Parotia persica) together with some rare tree and shrub
species.
not spectral superiority to TM/ETM+ or ASTER data, but it has a spatial resolution superiority compared with the latter. The HRG subsystem provides images with ten meter resolution in three green, red and infrared spectral wavelengths and 20 meters in middle infra-red spectral wavelengths. Clark et al. (2001) demonstrated that Landsat5 TM and SPOT3- HRV statistically produced similar results for plant community classification, but to clarify the significance of spatial resolution on forest cover mapping Salajanu and Olson (2001) found the higher classification accuracy of forest species could obtained using SPOT XS (20 m VNIR) compared to Landsat-TM due to higher spatial resolution of SPOT XS versus Landsat TM. In another comparative study, Lu et al. (2008) examined capability of the ASTER, Landsat TM, and SPOT-HRG data for land cover classification in the Brazilian Amazon and showed that for the six land cover classes, the SPOT data fusion could provide the best classification accuracy. They also concluded that higher spatial resolution images provide better classification accuracy when the spectral wavelengths are similar. Reese (2011) is also concluded that SPOT-HRG data compared to TM and AWiFS imagery could better classify detailed alpine vegetation types.
The literature reviews showed that conventional parametric statistical classification techniques that have generally been used in remote sensing data analyses for over four decades are not appropriate for forest type classification (Richards and Jia, 1999). In recent years, the non-parametric algorithms such as decision tree based algorithms (Breiman et al., 1984) and their variants have been widely used in different studies due to their simple interpretation, high classification accuracy, and ability to characterize complex interactions among variables (Cutler
et al., 2007). Non-parametric algorithms have obvious advantages over
(CTA) is a rule-based technique that has produced highly accurate classifications using a variety of spectral and ancillary data sources (Lawrence et al., 2004). Classification tree analysis generally has resulted in improved accuracies when compared to other classification methods, and boosted algorithms have been commonly reported to increase classification accuracies by 10% or more compared to non-boosted classification trees, although increased accuracy is not guaranteed (Lawrence et al., 2004; Landenburger et al., 2008). Cutler et al. (2007) compared the classification accuracies of RF, classification trees, logistic regression, and linear discriminate analysis for presence of invasive plant species in Lava Beds National Monument in California, presence of rare lichen species in the Pacific Northwest, and nest sites for nesting cavity birds in the Uinta Mountains, Utah. They observed that RF had high accuracies in all applications, compared to other classification methods. However, Baatuuwie and Leeuwen (2011) evaluated the maximum likelihood, spectral angle mapper and decision tree algorithms in forest types mapping using ASTER data in the Offinso forest district of Ghana, and showed that maximum likelihood classifier could accurately classify and map different forest stand types with an overall accuracy of 88.50%.
Comparison of nonparametric algorithms on the semi high-resolution remote sensing data to classify forest types in the Hyrcanian forest can be an innovation in the same studies. Therefore, the aim of this study is comparison of performance for three tree-based classification algorithms including the classification and regression tree (CART), Boosted classification and regression Tree (BRT) and Random Forest (RF) using SPOT -HRG data for mapping the forest types in the Darabkola forest, located at the Hyrcanian forest, northern Iran.
2. Materials and methods Study area
Figure1. Location of study area in the Mazandaran Province (a), allocation of sample plots (b)
Field data
In summer 2010, using a systematic aligned sampling design with 350*500 m intervals, 150 sample plots with 3600 m2 area were located in the study area (Fig. 1).
The geographical center of plots was accurately registered using high precision handy GPS and averaging methods to get accurate positions. In all samples, tree and shrub species of all trees with DBH greater than 7.5 cm were registered. Determination and naming of forest types were conducted based on computing frequency of dominant species in each plot. In the study area, four general forest stand types including pure Fagus (PF), mixed Fagus (MF), mixed Carpinus (MC) and mixed hardwood stands (MH) were recognized.
Satellite data
A small window of the SPOT 5 HRG XS scene acquired on 1 June 2009 was used for forest type classification. The HRG subsystem provides images with a pixel sizes of 10 meters in green, red and near infrared (VNIR) bands, and 20 meters in the shortwave infrared (SWIR) band. The SPOT-HRG data were accurately ortho-rectified by 10 meter spatial resolution DEM and 23 ground control points collected by handy GPS. The total root mean square errors (RMSE) were 0.67 for the VNIR bands, and 0.5 for the SWIR band using second polynomial equation. The SWIR bands were also resized to 10 meters using nearest-neighbor resampling method. The geometric precision of images was also checked using road vector layer and GPS collected control points.
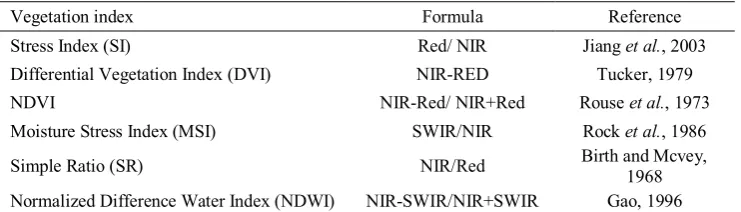
sensor calibration (Mahiny & Turner, 2007; Teillet, 1986). In this study, the general COST method was used to accommodate the atmospheric attenuation and scattering in the visible/ near-infrared bands. In addition, topographic illumination correction was accomplished corresponding to the solar illumination conditions using the ten meters DEM of the study area. To apply COST model, the sun azimuth and elevation were provided form metadata of satellite image. Processing of remote sensing data was performed by extracting different feature sets using suitable band ratios to produce vegetation indices as well as a standardized principal component analysis (PCA) transformation (Tab. 1) which is helpful in exploring forest biophysical attributes.
Table 1. Some used vegetation indices examined in this study
Reference Formula
Vegetation index
Jiang et al., 2003 Red/ NIR
Stress Index (SI)
Tucker, 1979 NIR-RED
Differential Vegetation Index (DVI)
Rouse et al., 1973 NIR-Red/ NIR+Red
NDVI
Rock et al., 1986 SWIR/NIR
Moisture Stress Index (MSI)
Birth and Mcvey, 1968 NIR/Red
Simple Ratio (SR)
Gao, 1996 NIR-SWIR/NIR+SWIR
Normalized Difference Water Index (NDWI)
Methods
Classification and regression tree (CART)
Boosted regression trees (BRT)
The BRT algorithm is a combination of statistical and machine learning techniques that aim to improve the performance of a single model by fitting many models and combining them for prediction (Schapire, 2003). The BRT approach is fundamentally different from traditional regression methods that produce a single ‘best’ model. Instead it uses a boosted technique to combine large numbers of relatively simple tree models adaptively, to optimize predictive performance (Elith
et al., 2006, 2008; Leathwick et al., 2006). The boosted approach used in BRT places
its origins within ML (Schapire, 2003), but subsequent developments in the statistical community reinterpret it as an advanced form of regression (Friedman et al., 2000). The BRT is one of several techniques that aim to improve the performance of a single model by fitting many models and combining them for prediction. The BRT uses two algorithms including regression trees that are from the classification and regression tree (decision tree) group of models, and boosted that builds and combines a collection of models.Boosted is a method for improving model accuracy, based on the idea that it is easier to find and average many rough rules of thumb, than to find a single, highly accurate prediction rule (Schapire, 2003).
Random Forest (RF)
a random sample of training sets for growing each classification tree, and second, in growing any given classification tree, a random selection of predictor features at each node in choosing the best split (Yu et al., 2011). Thus, three parameters in the RF need to be set: how many trees to construct (N), how many predictor variables to be tried at each node for splitting (M), the node size (NS), which determines how deep the regression tree will grow (Yu et al., 2011). Additionally, in order to increase the diversity of trees, RF uses bagging or bootstrap aggregating to make them grow from different training data subsets.
Feature selection
Although feature selection is not necessary in RF (Breiman and Cutler, 2003) and BRT (Prasad et al., 2006), but in some classification algorithms such as CART, high number of independent variables influences on the classification results and selection of the best variables for classification can lead to produce better results. In addition, in some feature selection algorithms, the variables can be sorted based on their importance in classification process. The variable importance enables us to determine what set of variables is deemed important for each of the three methods and to compare them to see whether the sets are similar. The importance values are calculated by the following formula:
(1) I (j) =∑t ∆S (j, t)
Where I (j) is the importance of variable xj and ∆S (j, t) is the reduction in mean
squared error S that would be achieved if node t of the tree were split using xj
(Breiman et al., 1984).
Accuracy assessment
To evaluate performance of a classifier, which is mentioned before, it requires that a randomly selected set of test or unused samples (pixels) for each class be used for computing the classification accuracy (Richards, 1993). In this study, accuracy assessment was performed using 50 test samples. The classified images were then assessed with the test sample plots to generate error matrices of overall accuracy and kappa coefficient. The McNamara’s test (Rozenstein and Karnieli, 2011; De Leeuw
et al., 2006; Foody, 2004) was used to examine the significance of the results.
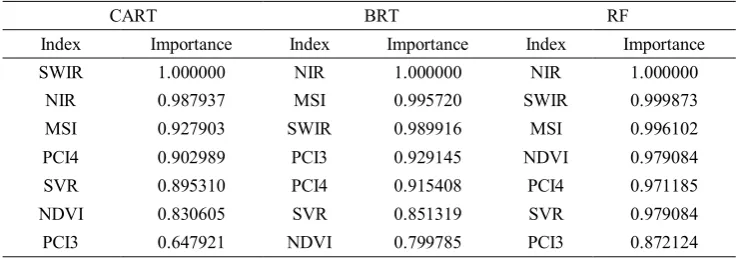
3.Results and discussion
Table 2. Variable importance for forest type mapping using CART, BRT and RF RF BRT CART Importance Index Importance Index Importance Index 1.000000 NIR 1.000000 NIR 1.000000 SWIR 0.999873 SWIR 0.995720 MSI 0.987937 NIR 0.996102 MSI 0.989916 SWIR 0.927903 MSI 0.979084 NDVI 0.929145 PCI3 0.902989 PCI4 0.971185 PCI4 0.915408 PCI4 0.895310 SVR 0.979084 SVR 0.851319 SVR 0.830605 NDVI 0.872124 PCI3 0.799785 NDVI 0.647921 PCI3
Comparison of classification performances
Table 3 shows the summary of performance results including overall accuracy and kappa statistics of the three used classification algorithms. Results show that the Random Forest classifier compared to the other two algorithms with overall accuracy of 70% and kappa coefficient of 0.63 could classify better the forest types, while the CART method had the lowest accuracy with overall accuracy of 60% and kappa coefficient of 0.51. Performance of the BRT classifier is nearly similar to the RF classifier.
Table 3. Summary of accuracy results of the three classifiers
Classifier Overall accuracy (%) kappa statistics
CART 0.60 0.51
BRT 0.68 0.61
RF 0.70 0.63
The McNemer’s test confirmed that accuracies of RF classification results were significantly better than CART algorithm (X2=18.44, P<0.0001), but were not
significant in comparison with the BRT (X2=1.03, not significant (NS)). In addition,
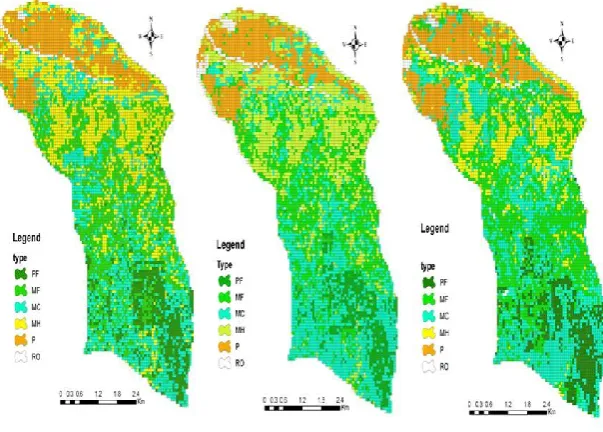
the accuracies of BRT performance were significantly better than the CART performance (X2=14.28, P<0.0001). Figure 2 shows three different classification
Figure 2. Classification maps obtained by CART (a), BRT (b) and RF (c) Results of forest type classification using three algorithms
been demonstrated that RF classifier is a high performance multi- tree algorithm for data mining, classification, prediction and cluster analysis when used remotely sensed data. One of the advantages of RF is that it is resistant to over training and growing a large number of random forest trees does not create a risk of over-fitting, i.e. each tree is a completely independent random experiment. In RF algorithm, data does not need to be rescaled, transformed, or modified in any way and it has resistance to outliers in predictors and automatically handles the missing values. In contrast to CART decision tree algorithm that use only one variable at a time to spilt the data into partitions, in RF, splitting the data is accomplished in a randomly selected variable and it continues with other predictors in a suitable predictor sets to grow classification trees. These arbitrary numbers (ensemble) of simple trees (subset from independent variables) are used to vote their responses to be combined (majority) to determine a class or forest type for a pixel. The data and variables can be randomly sampled in an iteratively bagging bootstrap sampling to generate a forest of classification trees. The McNamara’s test showed that RF and BRT classifiers could significantly produce higher accuracies compared to the CART method. Consistent with the previous studies (Baatuuwie and Leeuwen, 2011; Cutler
et al., 2007; Gislason et al., 2006), the RF classifier could produce the highest accuracy compared to CART classifier. In addition, consistent with the previous studies (Prasad et al., 2006) results showed the accuracies of generated maps by the RF and BRT algorithms were not significantly different.
Results of feature selection and variable importance showed that NIR band in two of the three used algorithms was the important variable for mapping and separating the forest types. In this spectral wavelength, the reflections of tree species are more enhanced and distinguishable. These results are similar to other studies (Rashidi et al., 2009) where it was demonstrated that NIR band had high importance for segregation of forest types.
In comparison to studies that were completed in the Hyrcanian forest, our results showed that overall accuracies obtained in this study ranged between 60-70%, which are higher than previous studies that used parametric classification methods. For example, Abbasi (2001) mapped forest types with an overall accuracy of 44.6%; Shataee (2003) with overall accuracy of 54.8%; Darvishsefat and et al. (2009) with overall accuracy of 51% and Rashidi and et al., (2009) with overall accuracy of 53.22%. One of the reasons of obtaining better results in our study compared to previous studies is the use of nonparametric tree classifier methods. When we use non-parametric classifiers, it is not required to assume that the data follow a normal distribution and no statistical parameters are needed to separate image classes (Quirós et al., 2009).
2004; Landenburger et al., 2008). We also believe that relatively higher accuracies in classification than previous studies which used Landsat TM/ETM+ data are probably due to better spatial and spectral resolution of SPOT-HRG data. The used algorithms are also included in data mining methods category. One of the advantages of these methods is use of whole data in classification process that is unlike the prevalent parametric classification methods. The limited number of training samples compared to the high dimension of data will lead to inaccurate estimation of the covariance structures and degenerate ranks of spectral matrices, thus limiting the accuracy of classification (Hughes, 1968). Other reason for these results is application of surface illumination and topographic correction to the images.
4.Conclusion
In this study, we compared performance of three non-parametric and tree-based algorithms including Classification and Regression Tree (CART), Boosting Regression Tree (BRT) and Random Forest (RF) for general forest type mapping using semi high resolution of SPOT-HRG data. The kappa statistics ranged from 0.51 to 0.63. According to the ranked analysis performances of Landis and Koch (1997), these values are good class performances. Regarding the obtained results in this study, it may be concluded that non parametric classification algorithms such as BRT and RF classifiers on medium resolution images such as SPOT-HRG data can better map the stand types in the study site located in the Hyrcanian forests.
References
Abbasi, M. 2001. Investigation on the possibility of beech forest type mapping using Landsat ETM+ data (Case study: Kheyroud forests), M.Sc Thesis, Tehran University, 114pp. (In Persian)
Baatuuwie, N.B., and Leeuwen, I.L.V. 2011. Evaluations of three classifiers in mapping forest stand types using medium resolution imagery: a case study in the Offinso Forest District, Ghana. African Journal of Environmental Science and Technology. 5(1): 25-36. Birth, G.S., and McVey, G.R. 1968. Measuring the color of growing turf with a reflectance
spectrophotometer. Agronomy Journal. 60: 640-643.
Breiman, L., and Cutler, A. 2003. Setting up, using, and understanding Random Forests v4.0. [Online] URL: http://www.stat.berkeley. edu/users/breiman/rf.html.
Breiman, L. 2001. Random forests. Machine Learning. 45:15–32.
Breiman, L., Friedman, J.H., Olsen, R.A., and Stone, C.J. 1984. Classification and regression trees. Wadsworth and Brooks/Cole, Monterey, California, USA.
Chavez, P.S. 1996. Image-based atmospheric corrections-revisited and improved. Photogrammetric Engineering and Remote Sensing. 62: 1025-1036.
Clark, P.E., Seyfried, M.S., and Harris, B. 2001. Intermountain plant community classification using Landsat TM and SPOT HRV data. Journal of Range Management. 54: 152-160.
Cutler, D.R., Edwards, T.C., Karen, J., Beard, H., Cutler, A., Hess, K.T., Gibson, J., and Lawler, J.J. 2007. Random forests for classification in ecology. Ecology. 88 (11): 2783– 2792.
Darvishsefat, A.A., Abbasi, M., and MarviMohadjer, M.R. 2009. Investigation on the possibility of beech forest type mapping using Landsat ETM+ data (Case study: Kheyroud forest). Journal of Iranian Forest 2(9):105-113 (In Persian).
De Leeuw, J., Jia, H., Yang, L., Liu, X., Schmidt, K., and Skidmore, A.K. 2006. Comparing accuracy assessments to infer superiority of image classification methods. International Journal of Remote Sensing. 27: 223-232.
Dietterich, T. 2000a. An experimental comparison of three methods for constructing ensembles of decision trees: Bagging, boosting and randomization. Machine Learning. 40: 139-157.
Dietterich, T. 2000b. Ensemble methods in machine learning. Lecture Notes Computer Science. 1857: 1–15.
Elith, J., Leathwick, J.R., and Hastie, T. 2008. A working guide to boosted regression trees. Journal of Animal Ecology. 77: 802–813.
Elith, J., Graham, C.H., and Anderson, R.P. 2006. Novel methods improve prediction of specie’s distributions from occurrence data. Echography. 29: 129–151.
Freund, Y., and Schapire, R.E. 1996. Experiments with a new boosting algorithm. In: Machine Learning. Proceedings of the Thirteenth International Conference. 148–156. Friedman, J.H., Hastie, T., and Tibshirani, R. 2000. Additive logistic regression: a statistical
view of boosting. Annals of Statistics. 28: 337–407.
Foody, G.M. 2004. Thematic map comparison: evaluating the statistical significance of differences in classification accuracy. Photogrammetric Engineering and Remote Sensing. 70: 627-634.
Gao, B.G. 1996. NDWI-A normalized difference water index for remote sensing of vegetation liquid water from space. Remote Sensing of Environment. 58:257-266. Gislason, P.O., Benediktsson, J.A., and Sveinsson, J. R. 2006. Random Forests for land cover
classification. Pattern Recognition Letters. 27: 294–300.
Gorgibahri, Y. 2000. Investigation on Classification, typology and planning of Vaz research forest. PhD Thesis, Tehran University, 170p. (In Persian)
Hughes, G.F. 1968. On the mean accuracy of statistical pattern recognizers, IEEE Trans. Inform. Theory. IT-14: 55-63.
Jiang, Y., Carrow, R.N., and Duncan, R.R. 2003. Correlation analysis procedures for canopy spectral reflectance data of seashore paspalum under Traffic stress. Journal of American Society.13:187-208.
Landenburger, L., Lawrence, R.L., Podruzny, Sh. and Schwartz, C.C. 2008. Mapping Regional Distribution of a Single Tree Species: White barks Pine in the Greater Yellowstone Ecosystem. Sensors. 8 (12):4983-4994.
Leathwick, J.R., Elith, J., Chadderton, W.L., Rowe, D., and Hastie, T. 2008. Dispersal, disturbance, and the contrasting biogeographies of New Zealand’s diadromous and non-diadromous fish species. Journal of Biogeography, in press.
Lawrence, R., and Wright, A. 2001. Rule-based classification systems using classification and regression tree (CART) analysis. Photogrammetry Engineering Remote Sensing. 67:1137-1142.
Lawrence, R., Burn, A., Powell, S., and Zambon, M. 2004. Classification of remotely sensed imagery using stochastic gradient boosting as a refinement of classification tree analysis. Remote Sensing of Environment. 90: 331-336.
Leathwick, J.R., Elith, J., Francis, M.P., Hastie, T., and Taylor, P. 2006. Variation in Demersal fish species richness in the oceans surrounding New Zealand: an analysis using boosted regression trees. Marine Ecology Progress Series. 321: 267–281.
Mahiny, A.S., and Turner, B. J. 2003. Modeling Past change in vegetation through Remote and GIS: A Comparison of Networks and logistic Regression Methods. Geocomputation conference, Southampton, UK.
Prasad, M.A., Iverson, L.R., and Liaw, A. 2006. Newer Classification and Regression Tree Techniques: Bagging and Random Forests for Ecological Prediction. Ecosystems. 9: 181– 199.
Qi, J., Chehbouni, A., Huete, A.R., Kerr, Y.H., and Sorooshian, S. 1994. A modified soil adjusted vegetation index. Remote Sensing of Environment. 48:119-126.
Quirós, E., Felicísimo, Á.M., and Cuartero, A. 2009. Testing Multivariate Adaptive Regression Splines (MARS) as a Method of Land Cover Classification of TERRA-ASTER Satellite Images. Sensors. 9(18): 9011-9028.
Rashidi, F., Babaie Kafaki, S., and Oladi, J. 2009. Investigation on the capability of digital data of ETM+ sensor in separating of forest types (Case study: Lafoor area of Savadkooh). Iranian Journal of Forest and Poplar Research. 17(13):51-63 (In Persian).
Rawat, J.K., Saxena, A., and Gupta, S. 2003. Remote Sensing Satellite Based Forest Cover Mapping: Some Recent Developments. Indian Cartographer. 4: 195-198.
Richards, J.A., and Jia, X. 1999. Remote Sensing Digital Image Analysis, An Introduction, Third, Revised and Enlarged Edition. Springer, Berlin. 100p.
Richards, J.A. 1993. Remote sensing digital image analysis: an introduction. Springer-Verlag, Berlin.100p.
Rock, B.N., Vogelmann, J.E., Williams, D.L., Vogelmann, A.F., and Hoshisaki, T. 1986. Remote detection of forest damage. Bioscience. 36: 439-445.
Rouse, J.W., Haas, R.H., Schell, J.A., and Deering, D.W. 1973. Monitoring vegetation systems in the Great Plains with ERTS. In Third Earth Resources Technology Satellite-1 Symposium.1: 309-317.
Rozenstein, O., and Karnieli, A. 2011. Comparison of methods for land-use classification incorporating remote sensing and GIS inputs. Applied Geography. 31: 533-544.
Sagebtalebi, Kh., Sajedi, T., and Yazdian, F. 2003. Forests of Iran. Technical. 339:1-10. Salajanu, D., and Olson, C.E. 2001. The significance of spatial resolution – identifying forest
cover from satellite data. Journal of forestry. 99: 32-38.
Schapire, R. 2003. The boosting approach to machine learning–an overview. MSRI Workshop on Nonlinear Estimation and Classification, 2002 (Eds D.D).
Selle, B., Lischeid, G., and Huwe, B. 2007. Effective modeling of percolation at the landscape scale using data based approaches. Computers & Geosciences. 34: 699–713. Shataee, SH. 2003. Investigation on the possibility of beech forest type mapping using
satellite data (Case study: Khyrood forest). PhD Thesis, Tehran University, 155p. (In Persian)
Stehman, S.V., and Czaplewski, L.R. 1998. Design and analysis of thematic map accuracy assessment: fundamental principles. Remote Sensing Environment. 64: 331-344. Teillet, P.M. 1986. Image correction for radiometric effects in remote sensing, International
Journal of Remote Sensing 7: 1637−1651.
Tian-Shyug, L., Chiu, C.C., Chou, Y.C., and Lu, C.J. 2006. Mining the customer credit using classification and regression tree and multivariate adaptive regression splines. Computational Statistics & Data Analysis. 50:1113–1130.
Tucker, C.J. 1979. Red and photographic infrared linear combinations for monitoring vegetation. Remote Sensing of Environment. 8:127-150.
Walton, J.T. 2008. Sub pixel urban land cover estimation: comparing cubist, random forests, and support vector regression. Photogrammetric Engineering & Remote Sensing. 74(10): 1213–1222
Watts, J.D., and Lawrence, R.L. 2008. Merging Random Forest classification with an object- oriented approach for analysis of agricultural lands. The International Archives of the Photogrammetry, Remote Sensing and Spatial Information Sciences, Beijing 2008. Vol. XXXVII. Part B7. 579-582