EFFECT OF DIFFERENT IRRIGATION LEVELS ON GROWTH AND
YIELD PARAMETERS OF SUGARCANE
S. M. I. Hossain*, S. U. K. Eusufzai and M. A. Rahman**
ABSTRACT: An experiment was conducted in Bangladesh Sugarcane Research Institute (BSRI) farm at Ishurdi during 2003-04 and 2004-05 cropping seasons to find out the effect of different irrigation levels on growth and yield parameters of six sugarcane varieties (Isd 16, Isd 30, Isd 31, Isd 32, Isd 33 and Isd 34). The experiment was laid up in two factors split-plot design with five irrigation levels in main plots and six varieties in subplots. Irrigations at 21, 28, 35 or 42 days interval in addition to two live irrigations increased sugarcane yield from 15% to 46%. Irrigation at 21 days interval showed higher establishment, tiller, millable cane and yield of cane over irrigation at 28, 35 or 42 days interval. Varieties Isd 34, Isd 31, Isd 32 and Isd 33 showed better performance and produced signifi-cantly higher yield among the selected varieties. Hence sugarcane varieties Isd 31, Isd 32, Isd 33 and Isd 34 may be cultivated with potential yield in clay loam soil by providing 4 to 5 irrigations at an interval of 21-42 days in addition to two live irrigations at 0 and 14 days after transplanting when soil bed settlings are used as planting material.
Key Words: Sugarcane; Irrigation; Variety; Performance; Yield Component; Bangladesh.
INTRODUCTION
Water is a scarce and indispensable basic input for sugarcane as it is for other crops. Insufficient or excess water supply is invariably a constraint to growth and yield of sugarcane. For proper growth, sug-arcane needs about 1260 mm of rain wa-ter or equivalent irrigation per year (Shih et al., 1977). In areas of low or unreliable rainfall or where the rainfall is not even throughout the year the crop is to be irri-gated. Sugarcane has a high water use ef-ficiency than other crops. It has been worked out that 200-250 tons of water is required to produce one ton of sugarcane (Anon, 1987).
Sugarcane production in Bangladesh suffers fluctuations because of poor distri-bution and shortage of rainfall. Annual av-erage rainfall in the sugarcane growing zone ranges between 1200 mm and 2020 mm which is logically satisfactory for grow-ing sugarcane. But the rainfall is not evenly distributed over the year. Yearly rainfall starts from April and continues to October.
However, more than 60% of the total rain-fall concentrates in June, July and August, causing water stagnation in the field, which creates oxygen stress in the root zone resulting in loss of sugarcane yield and reduction of quality. From November to March, the rainfall is very scanty and erratic. In some of these months no rain-fall occurs. But plantation, germination and tiller formation of sugarcane mainly takes place during these dry months. Sugarcane, thus, in these months needs adequate moisture level to promote successful ger-mination, tillering and growth of the crop. It is reported that yearly 2 to 3 irrigations from November to March increased sugar-cane yield by 30% or more (Hossain, 1992). The highest yield of sugarcane (107 t ha-1)
was obtained from Bangladesh Sugarcane Research Institute’s farm by applying three irrigations totaling 30 cm of water which were applied once at 24 hour after planta-tion and the rest at 30 days and 90 days after plantation (Eusufzai et al., 2000). Mathew and Varughese (2005) also reported
*Department of Agricultural Engineering, Bangabandhu Sheikh Mujibur Rahman Agricultural University, Gazipur-1706, Bangladesh.
that irrigation positively influenced all at-tributes and nutrient uptake and apprecia-bly increased the cane yield. They obtained the highest yield of 107.40 t ha-1 with
wa-ter use efficiency of 1.28 t ha-1cm-1 for the
variety ‘Madhuri’ in India.
Again excess water use may induce leaching of valuable nutrients beyond root zone and may also create oxygen stress and therefore may retard normal growth of plant instead of boosting yield. Application of ex-cess water is an economic loss for the sug-arcane growers in addition to the yield loss. Sugarcane in general grows well up to soil moisture retention range of 0.2 –2.5 bars in arid climates and about 0.2-1.8 to 2.5 bars in humid climates (Husz, 1972). Gen-erally, the percent aeration porosity even after irrigation should not be below 10% (Husz, 1972 as cited by Srivastava and Singh, 1987)
On the other hand, all varieties of sug-arcane do not response to water deficit/ stress similarly. Some varieties can with-stand more water stress than others, thus producing better yield in even drought con-dition. In contrast, some varieties can pro-duce better yield in water stagnation con-dition. Therefore, determination of perfor-mance of different sugarcane varieties at different soil moisture levels is an impor-tant aspect to optimise economic yield of sugarcane at different locations of the country. Research work on this aspect has not been yet undertaken in Bangladesh although research works on other aspects of irrigation for sugarcane have been done by many researchers (Eusufzai et al., 2000; Siddique et al., 2001). Hence, the present
experiment was conducted during 2003-04 and 2004-05 cropping seasons to find out the effect of different irrigation levels on growth and yield parameters of some se-lected varieties of sugarcane.
MATERIALS AND METHODS
The study was carried out in Bangladesh Sugarcane Research Institute (BSRI) farm at Ishurdi with six sugarcane varieties namely, Isd 16, Isd 30, Isd 31, Isd 32, Isd 33 and Isd 34. Settlings were raised from budchips of these varieties in soil bed. At the age of 60-69 days the settlings were transplanted in the main field. The experi-ment was laid in split-plot design with five irrigation levels in the main plots and six sugarcane varieties in the sub-plot (Table 1) and was replicated thrice. The budchip settlings were transplanted @ 25000 settlings per hectare. The soil of the ex-perimental field was loamy to clay loam with pH value ranged from 7.57 to 7.70. (Table 2).
Chemical fertilizers were applied as per BARC recommendation (BARC, 1989) and intercultural operations were done as per BSRI recommendation (Rahman et al.,1998). Number of tillers produced by dif-ferent varieties in difdif-ferent irrigation treat-ments were counted during May, 2004 af-ter 6 months of transplantation. Number of millable canes were counted just one week before harvesting at the age of 13 months. Chemical analyses of canes were done during premature stage in October and mature stage in December to find the pol percentage of the cane (pol % cane). Pol Table 1. Main plot and sub-plot treatments of the experiment laid in split-plot design
Main-plot treatment Sub-plot treatment
(Irrigation) (Variety)
% cane determined at matured stage has been included in this paper for discussion.
Number of Irrigation Applied
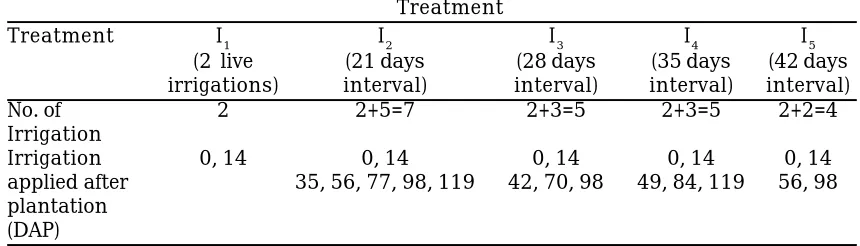
Only two live irrigations at 0 and 14 days after plantation (DAP) were applied in treatment I1. During 2003-04, irrigation
treatment I1, I2, I3, I4 and I5 received 2, 7, 5, 5 and 4 irrigations, respectively (Table 3). However, during 2004-05, these treatments received 2, 7, 6, 5, and 5 irrigations, re-spectively (Table 4). During 2004-05 treat-ment I3 and I5 received one more irriga-tion over that they received during 2003-04. It is because rainfall started little later during 2004-05. The higher number of ir-rigations applied during both 2003-04 and 2004-05 was 7 and was applied to treatment I2 where irrigation was applied at 21 days
interval. During first two live irrigations, water was applied at a depth of 6 cm each. However, the latter irrigations water was applied at a depth of 10 cm each.
RESULTS AND DISCUSSION Establishment of Settling
From the previous practice and expe-rience it was essentially important to
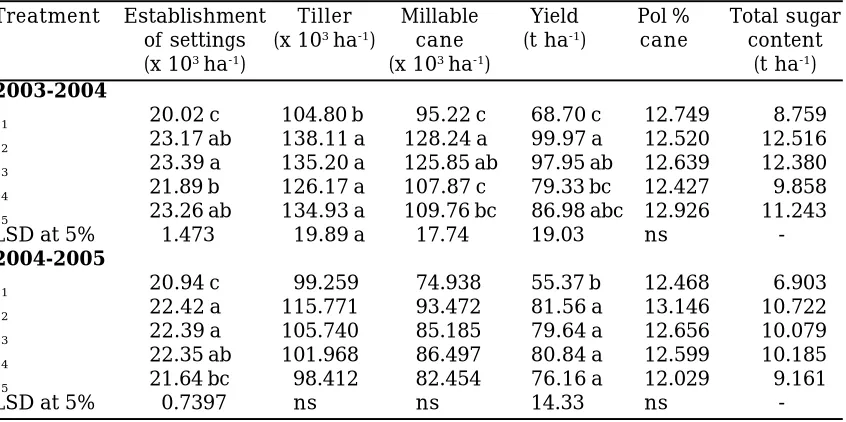
ap-ply at least two irrigations at 0 and 14 days after transplantation for soil bed settlings (Hossain, 2005). However, some plant died after 14 days of transplantation due to pest infestation, diseases and high water stress. The results showed that the establishment of settlings was significantly higher (Table 5). The statistically significant highest es-tablishment was found in the treatment I3(23.39 x 10³ha-1) followed by treatment
I2(23.17 x 10³ha-1) and I
5 (23.26 x 10³ha-1)
during 2003-04. The lowest establishment was found in the treatment I1 (20.02 x 10³ha-1) where no irrigation was applied
except two live irrigations.
However, during 2004-05, highest es-tablishment was found in I2 (22.42 x 10³ha -1) which was statistically similar with the
treatment I3 (22.39 x 10³ ha-1) and I
4 (22.35
x 103ha-1). The lowest establishment of
settlings was found in I1 (20.94 x10³ha-1).
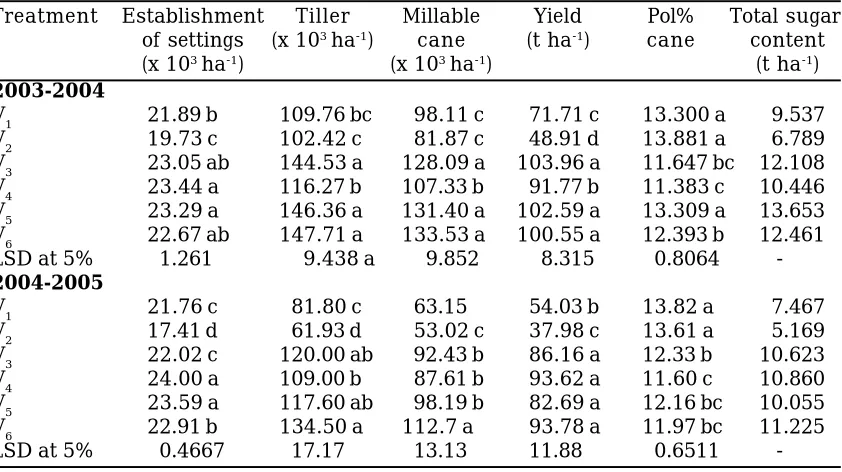
On the other hand, significantly higher establishment of settlings was found in the varieties V4, V5, V6 and V3 over vari-eties V1 and V2 during 2003-04 (Table 5). The highest establishment was found in the variety V4 (23.44 x 10³ha-1) and the
low-est low-establishment was found in the vari-ety V2 (19.73 x10³ha-1). During 2004-05,
sig-Table 2. Physisochemical properties of the experimental field
Depth Texture pH Organic N P K S
(cm) matter (%) (ppm) (meq/ (ppm)
(%) 100g soil-1)
0-15 Loam 7.57 1.30 0.042 10.0 0.22 27.0
16.50 Loam 7.62 0.87 0.020 5.5 0.22 25.0
51.75 Clay loam 7.70 0.62 0.019 3.0 0.23 18.0
Table 3. Number and day of irrigation application for different treatments during 2003-04 (planted on December 6, 2003)
Treatment
Treatment I1 I2 I3 I4 I5
(2 live (21 days (28 days (35 days (42 days irrigations) interval) interval) interval) interval)
No. of 2 2+5=7 2+3=5 2+3=5 2+2=4
Irrigation
Irrigation 0, 14 0, 14 0, 14 0, 14 0, 14
applied after 35, 56, 77, 98, 119 42, 70, 98 49, 84, 119 56, 98 plantation
nificantly higher establishments were also shown by V4 (24.00 x 10³ha-1) and V
5 (23.59
x 103ha-1) over others (Table 6). The lowest
establishment was shown by variety V2 (17.41 x 10³ha-1) during 2004-05. On the
basis of the establishment potential the varieties can be ranked as: Isd 32 > Isd 33 > Isd 34 > Isd 31 > Isd 16 >Isd 30.
Number of Tillers
It is evident that during 2003-04, the number of tillers produced in irrigation treatment I2, I3, I4 and I5 where 5, 3, 3 and 2 extra irrigations applied, were signifi-cantly higher than the control treatment I1 where only two live irrigations were ap-plied (Table 5). Similar effects of irrigation treatments on tiller production were also
observed during 2004-05. In both cropping seasons the highest number of tillers was produced in the treatment I2 (138.11 x 10³ha-1 and 115.771 x 10³ ha-1 respectively)
followed by treatment I3 (135.20 x 10³ha-1
and 105.740 x10³ha-1 respectively) although
the differences were not statistically sig-nificant. The lowest number of tillers were produced in the treatment I1 (104.8 x 10³
ha-1) during 2003-04 and in I
5 (98.41 x
103ha-1) during 2004-05. These evidences
reestablished the fact that irrigation sig-nificantly increases the number of tillers. Beside irrigation, number of tiller also depends on the variety as it is the inher-ent characteristics of each variety. Under the same input and environmental condi-tion all the varieties do not usually produce
Table 4. Number and day of irrigation application for different treatments during 2004-05 (planted on December 5, 2004)
Treatment
Treatment I1 I2 I3 I4 I5
(2 live (21 days (28 days (35 days (42 days
irrigations) interval) Interval) interval) interval)
No. of 2 2+5=7 2+4=6 2+3=5 2+3=5
Irrigation
Irrigation 0,14 0,14 0,14 0,14 0,14
applied after 35,56,77,98,119 42,70,98,126 49,84,119 56,98,140 plantation
(DAP)
Table 5. Contribution of irrigation to yield and other parameters of sugarcane dur-ing 2003-04 and 2004-05
Treatment Establishment Tiller Millable Yield Pol % Total sugar of settings (x 103 ha-1) cane (t ha-1) cane content
(x 103 ha-1) (x 103 ha-1) (t ha-1)
2003-2004
I1 20.02 c 104.80 b 95.22 c 68.70 c 12.749 8.759
I2 23.17 ab 138.11 a 128.24 a 99.97 a 12.520 12.516
I3 23.39 a 135.20 a 125.85 ab 97.95 ab 12.639 12.380
I4 21.89 b 126.17 a 107.87 c 79.33 bc 12.427 9.858
I5 23.26 ab 134.93 a 109.76 bc 86.98 abc 12.926 11.243
LSD at 5% 1.473 19.89 a 17.74 19.03 ns
-2004-2005
I1 20.94 c 99.259 74.938 55.37 b 12.468 6.903
I2 22.42 a 115.771 93.472 81.56 a 13.146 10.722
I3 22.39 a 105.740 85.185 79.64 a 12.656 10.079
I4 22.35 ab 101.968 86.497 80.84 a 12.599 10.185
I5 21.64 bc 98.412 82.454 76.16 a 12.029 9.161
-same number of tillers. It is evident that variety V6, V5 and V3 produced significantly higher number of tiller (147.71 x 10³ha-1,
146.36 x 10³ha-1 and 144.53 x 10³ha-1
re-spectively) over variety V1, V2 and V4 during 2003-04. Similarly the highest number of tillers was also produced by the variety V6 (134.50 x 10³ha-1) during 2004-05. The
low-est number of tillers was produced by the variety V2 during both 2003-04 and 2004-05 cropping seasons. On the basis of the tiller production potentials, the varieties can be ranked as: Isd 34 > Isd 33 > Isd 31 > Isd 32 > Isd 16 > Isd 30.
Millable Cane
Millable cane is the number of canes that are used for milling/crushing. It is the number of tiller that can survive and be-come matured in competition with others. From the data of 2003-04 (Table 5), the high-est number of millable cane was obtained from the treatment I2 (128.24 x 10³ha-1)
where irrigation was applied at 21 days in-terval in addition to two live irrigations at 0 and 14 DAP. The lowest millable canes were obtained from treatment I1 (95.22 x 10³ha-1) where only two live irrigations
were applied. Table 5 shows a general trend that the shorter the irrigation interval, the higher the number of millable cane.
Similar contribution of irrigation was also observed during 2004-05. The highest number of millable canes was also produced in the treatment I2 (93.472 x 10³ha-1) and
the lowest number of millable canes was produced in the treatment I1 (74.938 x 10³ha-1) (Table 5). Therefore, it is revealed
that irrigation increased the number of millable cane as it increased the number of tillers.
In variety, the highest number of millable cane was produced by the variety V6 (133.53 x 10³ha-1) and the lowest by the
variety V2 during 2003-04 (Table 6). How-ever, varieties V3, V5 and V6 produced sig-nificantly higher number of millable cane over varieties V4, V1 and V2. It is also
evi-dent that variety that produced higher number of tiller, also produced higher
num-ber of millable cane.
Similar results were also observed during 2004-05. The highest number of millable cane was also produced by the va-riety V6 (112.70 x 10³ha-1) during 2004-05.
Therefore, it is evident that during both cropping seasons the variety V6 produced the highest number of millable cane fol-lowed by the varieties V3 and V5 (Table 6). Thus on the basis of the millable cane pro-duction potential the varieties can be ranked as: Isd 34 > Isd 33 > Isd 31 > Isd 32 > Isd 16>Isd 30.
Cane Yield
Yield of sugarcane is the final output from the field for the farmers. It is evident that irrigation has a positive impact to in-crease the yield of sugarcane (Table 5). During 2003-04, the highest yield of sug-arcane (99.97 t ha-1) was produced in the
treatment I2 where irrigation was applied at 21 days interval. However, yield differ-ence among the treatments I2, I3, and I5 are statistically insignificant. Treatment I4 produced significantly lower yield than treatment I3 due to lower establishment of settlings, which caused lower number of millable cane causing lower yield. More-over, yield difference between treatment I4 and I5 was statistically insignificant.
Similar contribution of irrigation to increase yield was also found during 2004-05. The highest yield of sugarcane was also produced in treatment I2 (81.56 t ha-1) while
the lowest was in the treatment I1 (55.37 t ha-1). However, the differences in yield
among treatments I2, I3, I4 and I5 were sta-tistically insignificant. It is important to mention that the average yield in all treat-ments during 2004-05 were lower than that of 2003-04. It was because of heavy weed infestation in the field during February and March 2004-05. It is apparent that addi-tional irrigations over two live irrigations increased the yield of sugarcane up to 46% over control (Table 5).
ha-1, which was statistically similar with
the variety V5 (102.59 t ha-1) and V
6 (100.55
t ha-1). The lowest yield was produced by the
variety V2 (48.91 t ha-1). However, during
2004-05, the highest yield was produced by the variety V6 (93.78 t ha-1). But the
high-est yield produced by V6 was statistically similar to yield produced by the varieties V3 (86.16 t ha-1), V
4 (93.62 t ha-1) and V5
(82.69 t ha-1). Thus on the basis of yield
performance the varieties can be ranked as: Isd34 > Isd 31 > Isd 32 > Isd 33 > Isd 16 > Isd 30.
Pol Percentage of Cane
Irrigation did not have any significant effect on pol percentage of cane. Differences in pol percentage of cane among the treat-ments are statistically insignificant and ranged from 12.427% to 12.926% and 12.029 to 13.146% during 2003-04 and 2004-05 respectively (Table 5). However pol percentage of cane varied widely from va-riety to vava-riety and differences were sta-tistically significant (Table 6). The highest pol percentage of cane (above 13 %) was found in the variety V1 and V2 during both 2003-04 and 2004-05 cropping seasons
al-though their cane yields were lower. The lowest pol percentage of cane was found in the variety V4 (11.383% and 11.600% dur-ing 2003-04 and 2004-05, respectively. On the basis of pol percentage of cane, variet-ies can be ranked as: Isd 30 > Isd 16 > Isd 33 > Isd 34 > Isd 31 > Isd 32.
Total Sugar Content
It is the amount of total sugar that is contained with the total produced cane. Considering the irrigation treatments highest amount of total sugar was obtained from treatment I2 during both 2003-04 and 2004-05 (12.516 and 10.722 tha-1
respec-tively) (Table 5). However, considering va-rietal performance, it is evident from the Table 6 that the highest total sugar con-tent was obtained from the variety V5 (13.653 tha-1) during 2003-04 while the
highest total sugar content was obtained from the variety V6 (11.225 tha-1) during
2004-05. During both the seasons the least total sugar content was obtained from va-riety V1 and V2. Thus on the basis of the total sugar content, the varieties can be ranked as: Isd 33 > Isd 34 > Isd 31 > Isd 32 > Isd 16 > Isd 30.
Table 6. Contribution of variety to yield and other parameters of sugarcane during 2003-04 and 2004-05
Treatment Establishment Tiller Millable Yield Pol% Total sugar of settings (x 103 ha-1) cane (t ha-1) cane content
(x 103 ha-1) (x 103 ha-1) (t ha-1)
2003-2004
V1 21.89 b 109.76 bc 98.11 c 71.71 c 13.300 a 9.537
V2 19.73 c 102.42 c 81.87 c 48.91 d 13.881 a 6.789
V3 23.05 ab 144.53 a 128.09 a 103.96 a 11.647 bc 12.108
V4 23.44 a 116.27 b 107.33 b 91.77 b 11.383 c 10.446
V5 23.29 a 146.36 a 131.40 a 102.59 a 13.309 a 13.653 V6 22.67 ab 147.71 a 133.53 a 100.55 a 12.393 b 12.461
LSD at 5% 1.261 9.438 a 9.852 8.315 0.8064
-2004-2005
V1 21.76 c 81.80 c 63.15 54.03 b 13.82 a 7.467
V2 17.41 d 61.93 d 53.02 c 37.98 c 13.61 a 5.169
V3 22.02 c 120.00 ab 92.43 b 86.16 a 12.33 b 10.623
V4 24.00 a 109.00 b 87.61 b 93.62 a 11.60 c 10.860
V5 23.59 a 117.60 ab 98.19 b 82.69 a 12.16 bc 10.055
V6 22.91 b 134.50 a 112.7 a 93.78 a 11.97 bc 11.225
-Table 7. Interaction effect of irrigation and variety on yield and other parameters of sugarcane during 2003-04 and 2004-05
S. Treatment Establishment Tiller Millable Yield Pol % No. combination of setting (x103ha-1) cane (t ha-1) cane
(irrigation + (x 103 ha-1) (x 103 ha-1)
variety)
2003-04
1 I1V1 19.67 85.00 81.00 56.90 14.303 2 I1V2 15.33 87.56 68.22 41.77 14.447 3 I1V3 21.22 123.56 117.11 77.00 11.623
4 I1V4 22.89 103.33 93.67 77.20 10.937 5 I1V5 21.33 111.45 103.22 89.57 12.917
6 I1V6 19.67 117.89 108.11 69.77 12.270 7 I2V1 21.89 117.78 106.78 87.57 12.533 8 I2V2 22.33 113.22 101.67 56.13 13.817
9 I2V3 23.11 144.33 143.22 114.00 11.660 10 I2V4 23.55 123.11 125.22 104.43 10.957
11 I2V5 24.33 158.89 148.67 119.67 13.223 12 I2V6 23.78 153.89 143.89 105.90 12.930 13 I3V1 23.99 124.55 117.33 86.43 13.790
14 I3V2 21.00 99.22 80.22 52.77 13.393 15 I3V3 24.11 157.11 143.78 117.37 11.613
16 I3V4 23.44 124.00 116.56 105.67 11.283 17 I3V5 24.33 165.89 150.56 118.00 13.730 18 I3V6 23.44 157.89 146.67 119.57 12.023
19 I4V1 20.23 108.78 91.56 61.43 12.040 20 I4V2 19.89 101.67 76.67 44.47 13.867
21 I4V3 23.22 135.44 115.00 89.33 11.680 22 I4V4 22.78 111.33 96.78 87.90 11.857 23 I4V5 22.56 144.22 130.44 87.87 14.123
24 I4V6 22.67 155.56 136.78 105.00 10.997 25 I5V1 23.66 112.67 93.89 66.23 13.833
26 I5V2 20.11 110.44 82.55 49.43 13.880 27 I5V3 23.56 162.22 121.33 122.13 11.660 28 I5V4 24.56 119.55 104.44 83.67 11.880
29 I5V5 23.89 151.33 124.11 97.87 12.553 30 I5V6 23.78 153.33 132.22 102.53 13.747
Interaction effect ns ns ns ns ns
2004-05
1 I1V1 20.09 c 63.33 40.93 33.52 13.78
2 I1V2 16.67 e 74.81 65.65 37.67 12.84 3 I1V3 18.89 d 135.10 70.74 54.20 12.60
4 I1V4 24.17 a 101.30 87.41 73.64 11.67 5 I1V5 23.52 a 94.17 71.85 53.78 12.75 6 I1V6 22.31 b 126.85 113.06 79.40 11.17
7 I2V1 22.22 b 94.81 76.02 59.96 14.67 8 I2V2 18.15 c 62.04 52.50 32.42 14.79
9 I2V3 21.76 b 126.48 102.96 79.11 12.22 10 I2V4 24.72 a 136.57 95.56 121.14 11.57 11 I2V5 23.89 a 134.44 117.69 96.70 13.17
12 I2V6 23.80 a 140.28 116.11 88.51 12.46 13 I3V1 22.31 c 88.05 66.02 61.67 14.01
14 I3V2 17.87 d 51.76 40.00 36.05 13.58 15 I3V3 23.42 ab 123.70 95.28 97.39 12.72 16 I3V4 24.17 a 111.57 91.39 93.86 11.93
17 I3V5 23.61 ab 119.81 104.54 91.65 11.87 18 I3V6 22.96 bc 139.54 113.89 104.42 11.82
19 I4V1 23.15 a 84.26 72.78 59.68 13.56 20 I4V2 17.41 b 62.50 47.04 40.97 14.24 21 I4V3 23.15 a 92.97 98.61 88.64 11.93
22 I4V4 23.70 a 98.52 77.96 97.82 11.29 23 I4V5 23.71 a 119.17 100.28 92.20 12.04
24 I4V6 22.96 a 152.78 122.32 110.04 12.55 25 I5V1 21.02 b 78.52 60.00 55.34 13.09 26 I5V2 16.94 c 58.52 59.91 42.81 12.59
27 I5V3 22.87 a 121.95 94.54 111.48 12.17 28 I5V4 23.24 a 97.87 85.74 81.65 11.55
29 I5V5 23.24 a 120.46 96.57 79.13 10.95 30 I5V6 22.50 a 130.15 97.96 86.55 11.83 Interaction effect 1.044 ns ns ns ns
Interaction Effect
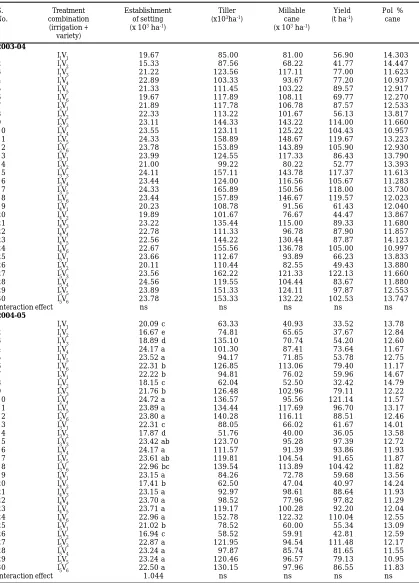
The interaction effects of irrigation and variety on establishment of settlings, tiller, millable cane, yield and pol percent-age of cane were statistically insignificant during 2003-04 (Table 7). However, during 2004-05 only establishment of settlings showed significant differences in interac-tion effect (Table 7). Variety V4 and V5 showed the highest establishment in all the treatment combinations. Variety V3 and V6 also showed significantly higher estab-lishment in some other treatment combi-nations. An exceptionally highest yield of 122.13 t ha-1 was produced by I
5V3
treat-ment-combination during 2003-04 while 121.14 t ha-1 by I
2V4 treatment
combina-tion during 2004-05. However, compara-tively higher yields were produced by I2V1-6 and I3V1-6 treatment-combinations during 2003-04 and I3V1-6 and I4V1-6 treatment-com-bination during 2004-05.
The study revealed that there was no statistical evidence of interaction effect between irrigation and variety. But both irrigation and variety showed their indi-vidual effect on establishment of settlings, tiller and millable cane production, and cane yield. However, irrigation did not have any effect on pol percentage of cane. It is therefore concludeed that irrigation at an interval of 21 days in addition to two live irrigations at 0 and 14 DAP of budchip settlings produced the highest yield over control. However, irrigation at 21 to 42 days interval produced statistically same yield in clay loam soil. Moreover, it showed a trend that the shorter the irrigation inter-val (i.e. the higher the number of irriga-tion), the higher the yield. To maximize the cane yield the selection of varieties for cul-tivation from the studied varieties may be as: Isd 34 > Isd 31 > Isd 32 > Isd 33 > Isd 16 > Isd 30. But, for maximizing total sugar content the varieties may be selected as: Isd 33 > Isd 34 > Isd 31 > Isd 32 > Isd 16 > Isd 30.
Therefore, for cultivation of sugarcane by raising settlings from budchip in soil bed,
the variety Isd 31, Isd 32, Isd 33 and Isd 34 may be potentially practiced with 4 to 5 ir-rigations at an interval of 21 to 42 days in addition to two live irrigations at 0 and 14 DAP.
LITERATURE CITED
Anonymous. 1987. Water management in sugarcane. Indian Sugar, 37(9):467-469. BARC (Bangladesh Agricultural Research Council). 1989. Fertilizer recommenda-tion guide. Soil publicarecommenda-tion No. 32, Pub-lished by the Bangladesh Agricultural Research Council, Farmgate, New Air-port Road, Dhaka-1215, p. 93.
Eusufzai, S.U.K. Khan, M.R. and Barma, A.C. 2000. Effect of irrigation on yield, water use efficiency and yield contrib-uting parameters of sugarcane. Bangladesh J. Sugarcane, 22: 77-82. Hossain, S.M.I. 1992. Sugarcane irrigation
in Bangladesh. The Bangladesh Ob-server, Dhaka, December 20, p. 4. Husz, G.S. 1972. Sugarcane: Cultivation
and Fertilisation, series of monographs on tropical and sub-tropical crops. Ruler Stickstoff, A.G. Bochun, West Germany. Mathew, T. and Varughese, K. 2005. Irri-gation Management for sustainable cane production. Indian J. Agron. 5(3), 239-242.
Shih, S.F. Myhre, D.L. Mishoe, J.W. and Kidder, G. 1977. Water management for sugarcane production in Florida Everglandes. Proc. ISSCT. 2: 995-1008. Rahman, A.B.M. Ali, M.K. and Rahman, M.Kh. 1998. Sugarcane Cultivation: Technologies and Techniques (Bangla). Publication No. 74. Bangladesh Sugar-cane Research Institute, Ishurdi, Pabna, Bangladesh, p. 11-22.
Siddique, M. A. B. Hossain, S. M. I. and Hossain, M. A. 2001. Irrigation schedul-ing of sugarcane with onion as inter-crop. Bangladesh J. Sugarcane, 23: 36-39.