R E S E A R C H
Open Access
Exploring targets of TET2-mediated
methylation reprogramming as potential
discriminators of prostate cancer progression
Shivani Kamdar
1,2, Ruth Isserlin
3, Theodorus Van der Kwast
2,4, Alexandre R. Zlotta
1,5, Gary D. Bader
3,
Neil E. Fleshner
5and Bharati Bapat
1,2,4,5*Abstract
Background:Global DNA methylation alterations are hallmarks of cancer. The tumor-suppressive TET enzymes, which are involved in DNA demethylation, are decreased in prostate cancer (PCa); in particular, TET2 is specifically targeted by androgen-dependent mechanisms of repression in PCa and may play a central role in carcinogenesis. Thus, the identification of key genes targeted by TET2 dysregulation may provide further insight into cancer biology. Results:Using a CRISPR/Cas9-derivedTET2-knockout prostate cell line, and through transcriptome and whole-methylome sequencing, we identified seven candidate genes—ASB2,ETNK2,MEIS2,NRG1,NTN1,NUDT10, and SRPX—exhibiting reduced expression and increased promoter methylation, a pattern characteristic of tumor suppressors. Decreased expression of these genes significantly discriminates between recurrent and non-recurrent prostate tumors from the Cancer Genome Atlas (TCGA) cohort (n= 423), andASB2,NUDT10, andSRPXwere significantly correlated with lower recurrence-free survival in patients by Kaplan-Meier analysis.ASB2,MEIS2, and SRPXalso showed significantly lower expression in high-risk Gleason score 8 tumors as compared to low or intermediate risk tumors, suggesting that these genes may be particularly useful as indicators of PCa progression. Furthermore, methylation array probes in the TCGA dataset, which were proximal to the highly conserved, differentially methylated sites identified in ourTET2-knockout cells, were able to significantly distinguish between matched prostate tumor and normal prostate tissues (n= 50 pairs). ExceptASB2, all genes exhibited significantly increased methylation at these probes, and methylation status of at least one probe for each of these genes showed association with measures of PCa progression such as recurrence, stage, or Gleason score. SinceASB2did not have any probes within the TET2-knockout differentially methylated region, we validatedASB2methylation in an independent series of matched tumor-normal samples (n= 19) by methylation-specific qPCR, which revealed concordant and significant increases in promoter methylation within theTET2-knockout site.
Conclusions:Our study identifies seven genes governed byTET2loss in PCa which exhibit an association between their methylation and expression status and measures of PCa progression. As differential methylation profiles and TET2 expression are associated with advanced PCa, further investigation of these specialized TET2 targets may provide important insights into patterns of carcinogenic gene dysregulation.
Keywords:Prostate cancer, TET2 knockout, Differential methylation profiling, Integrative analysis, Tumor progression
© The Author(s). 2019Open AccessThis article is distributed under the terms of the Creative Commons Attribution 4.0
International License (http://creativecommons.org/licenses/by/4.0/), which permits unrestricted use, distribution, and
reproduction in any medium, provided you give appropriate credit to the original author(s) and the source, provide a link to the Creative Commons license, and indicate if changes were made. The Creative Commons Public Domain Dedication waiver (http://creativecommons.org/publicdomain/zero/1.0/) applies to the data made available in this article, unless otherwise stated. * Correspondence:[email protected]
1Lunenfeld-Tanenbaum Research Institute, Mount Sinai Hospital, 60 Murray
Street, L6-304B, Toronto, ON M5T 3L9, Canada
2Department of Laboratory Medicine and Pathobiology, University of
Toronto, Medical Sciences Building (6th floor), 1 King’s College Circle, Toronto, ON M5S 1A8, Canada
Introduction
Prostate cancer (PCa) is the second most common cancer diagnosed in men worldwide, with significant global in-creases in incidence rates (2.4–21.4%) in 23 countries over the last 10 years [1,2]. Widespread epigenomic dysregula-tion events in PCa have been identified as a hallmark of tumorigenesis [3–6]. Among these, tumor-specific DNA methylation (5mC) alterations and repression of gene ex-pression are an emerging class of biomarkers as well as potential therapeutic targets, highlighting their import-ance in prostate carcinogenesis [7–14].
In PCa specifically, differential genomic patterns of 5mC and its derivative, 5-hydroxymethylcytosine (5hmC) have been linked to distinct molecular subtypes, indicating clear epigenetic stratification within tumors. For example, TMPRSS2-ERGfusion-positive tumors and tumors show-ing either SPOP or FOXA1 mutations possess distinct methylation signatures as identified by unsupervised clus-tering [5], while significant loss of 5hmC is observed only withinERG-fusion negative PCa [15]. Our previous stud-ies have shown that locus-specific 5hmC alteration is sig-nificantly correlated to transcriptional repression of multiple genes in prostate cancer cell lines, indicating the potential functional importance of these changes [16].In normal cells, the ten-eleven translocase (TET) family of genes oxidize 5mC to 5hmC, regulating levels of both epigenetic marks and promoting demethylation. TheTET family consists of three members—TET1, TET2, and TET3—which generate 5hmC through Fe2+ and α-ketoglutarate-dependent dioxygenase activity [17, 18]. While all TETgenes show loss of expression in PCa tis-sues, their mutation frequencies in primary prostate tu-mors are low, in contrast to the high mutation rates observed in metastatic castration-resistant prostate cancer and hematological malignancies [19–24].
Of the three TET enzymes, TET2 in particular is uniquely implicated as having a central role in PCa biology due to its key involvement with androgen receptor (AR) signaling. TET2 is able to bind to AR and its transcrip-tional coactivators in a prostate-specific interaction and has been linked to regulation of androgen-dependent genes such as PSA [23]. In turn, expression of the AR-induced microRNAs 29a and 29b specifically target and downregulateTET2in PCa, resulting in activation of AR and mTOR signaling pathways and promoting pro-carcinogenic biological functions [19,20]. In contrast, its family memberTET3has not been well investigated in the context of PCa and, althoughTET1 is known to be co-recruited along AR as part of a hormonal response in normal prostate cells, this link has not yet been investi-gated in PCa [25]. Furthermore, loss ofTET2activity has profound implications on PCa development, where re-duced TET2 expression is correlated with decreased disease-free survival, increased Gleason score, and
metastasis [20, 23]. Thus, there is ample evidence to sug-gest thatTET2loss may act as a key mechanism of PCa development, and exploration of its downstream target genes may provide new insights into cancer biology.
To investigate TET2’s role in PCa pathogenesis, we generatedTET2 knockout (KO) cell-lines in representa-tive normal prostate cells to discover key candidate genes regulated by TET2-mediated methylation repro-gramming. Here, we describe seven promising targets of epigenetic modification directed byTET2loss by analyz-ing their methylation and expression profiles in both prostate-derived cell lines and prostate tumors from the Cancer Genome Atlas (TCGA). These target genes are able to significantly differentiate between recurrent and non-recurrent tumors based on their expression status, further implicating TET2-governed changes as a signifi-cant process in carcinogenesis. Promoter methylation gain of one such promising candidate gene, ankyrin re-peat and SOCS-box containing protein 2 (ASB2), within the TET2-target site is investigated in an independent series of primary prostate tumors. These studies eluci-date the dynamics ofTET2-mediated gene regulation in order to develop a novel selection strategy for identifying genes whose methylation and differential expression may play a key role in prostate carcinogenesis.
Results
Generation ofTET2-knockout prostate cell lines
Sanger sequencing of clonally expanded populations using primers surrounding the indel target region (Additional file 1: Figure S1; Additional file 2: Table S1) revealed two CRISPR-knockout clones (CR1 and CR2; derived from the “P38” Sigma gRNA sequence [see the
“Materials and methods” section for details]) exhibiting
confirmed via Western blot (Fig. 1b, Additional file 4: Figure S3).
Methylation and expression profiles show extensive
epigenetic silencing inTET2-knockout cells
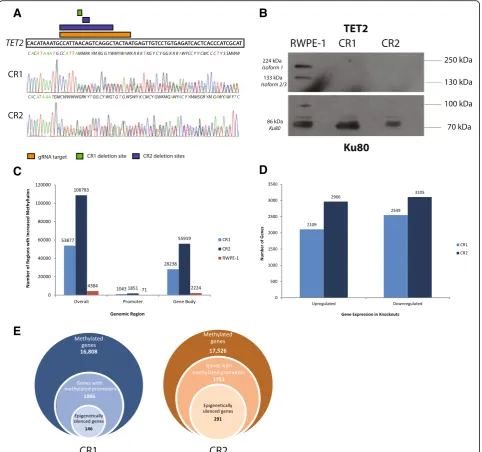
We performed next-generation sequencing (NGS) of genomic DNA following methyl-binding protein capture (MBD-Seq) and poly-A enriched mRNA (RNA-seq) to determine the effects of TET2 loss on prostate cells at both whole-methylome and whole-transcriptome levels. We observed large increases in differentially methylated regions (DMRs) in KOs versus parental cells (Fig. 1c, Additional file5: Figure S4). Similarly, extensive changes in gene expression were observed in both KOs, with 17.3% and 4.5% more genes showing significant down-regulation (> 1.5-fold decrease, p< 0.05) than upregula-tion (> 1.5-fold increase, p< 0.05) in CR1 and CR2, respectively (Fig. 1d, Additional file 6: Figure S5). 47.1% of downregulated genes and 42.3% of upregulated genes were shared between bothTET2KO cell lines.
As promoter methylation gain is likely correlated with decreases in gene expression in cancer, especially in tumor suppressors [15–17], we examined the proportion of genes that showed both significant downregulation of expression (p< 0.05, edgeR v 3.8.6) and concomitant in-creased promoter methylation (p< 0.05, DiffBind), in ei-ther knockout (Fig. 1e), of which 36.7% were commonly shared between both KOs. We found that 14.5% (146 genes) of all genes exhibiting promoter methylation in CR1 also showed significant expression loss, which was comparable to the 16.6% of such genes (291 genes) dis-covered in CR2. A further 54 of these genes overlapped between both knockouts (Additional file7: Table S2).
Subsequently, all genes exhibiting expression changes in either knockout were further assessed to determine their suitability as key targets ofTET2-mediated reprogramming.
A selected panel of key candidate genes exhibits differential methylation and downregulation in an independent cohort of primary prostate tumors
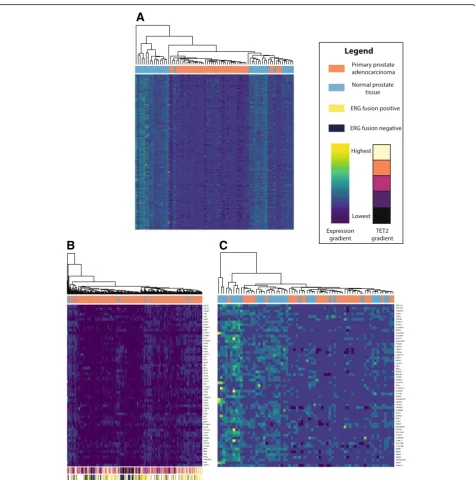
To identify the most significantly affected TET2-target genes with evidence of the highest potential impact in our model, we first compared global expression profiles in our cell line models to those reported in a subset of tumors from the TCGA which were in the bottom 10th percentile of TET2 expression (n= 43 of 423 total tumors) as compared to normal prostate tissue from the same cohort (n= 35). Out of 4192 genes with significantly decreased expression in either TET2 knockout (p< 0.05, FC < 0.75, edgeR; independent of methylation status), 780 genes ex-hibited significant loss of expression below the Bonferroni-corrected p value threshold of 1.193E−5 (Mann-Whitney U test) in the low-TET2 TCGA subset (Fig. 2a, Additional file 8: Figure S6). Of these genes, 61
exhibited significant promoter methylation (p< 0.05, Diff-Bind) in our knockout cell lines, all of which had also been identified as exhibiting significant 5hmC loss in cancer cells from our previous study [16], implicating them as strong potential targets of TET-mediated demethylation (Additional file9: Table S3). In turn, all but one of these genes exhibited significantly altered methylation in the low-TET2 TCGA tumors with methylation array data available (n= 43) as compared to normal prostate samples (n= 50). Fourteen of these 60 genes exhibited significant association with ERG fusion status (Mann-Whitney U test, Bonferroni-corrected p-value < 0.05), of which 11 showed significantly increased expression in ERG-positive tumors and three showed significantly decreased expression (Additional file 10: Table S4). TET2 expression was also significantly decreased in ERG-negative as compared to ERG-positive tumors (p= 7.124E−05, Mann-WhitneyUtest).
Next, we assessed the ability of these 60 TET2-target genes to distinguish between prostate tumor and normal samples (n= 35) expressing variable levels of TET2, in either all tumors with expression data available (n= 423, Fig.2b) or in matched tumor and normal pairs only (n = 35, Fig. 2c). Twenty-seven genes exhibited significant loss of expression below the Bonferroni-corrected p value threshold (p< 4.2373E−4, Mann-Whitney U test) in both sets and were further assessed via pathway analysis.
TET2-target genes are involved in critical biological
processes governing signaling interactions and the immune system
We assessed significantly enriched biological pathway annotations (binomial pvalue < 0.05) for (a) all methyl-ated and downregulmethyl-ated genes from our TET2-KO cells alone and (b) the 27 candidate genes identified above, with the Genomic Regions Enrichment of Annotations Tool (GREAT), using the whole genome as a back-ground. Enriched pathways would not only highlight key functions significantly affected by globalTET2-mediated alteration of the genes (set a), but would also provide insight into the potential biological consequences of can-didate gene silencing (set b).
candidate genes identified above (ANO1, MEIS2,PDE4A, PMP22, andSRPX) were identified through pathway ana-lysis as genes known to be downregulated in prostate can-cer samples specifically, indicating the relevance of these candidates to PCa in other datasets as well.
Expression levels and methylation status of keyTET2-target
genes exhibit correlation with measures of prostate cancer progression
As reduced TET2 levels are correlated with advanced PCa and decreased survival [19, 22], we assessed the
A
B
C
D
E
Fig. 1Methylation and expression profiles of CRISPR-Cas9TET2-knockout cells.aSanger sequencing chromatograms depict deletion sites observed in CR1 (green bar; heterozygous knockout) or CR2 (blue bar; functional homozygous knockout) which occur within the CRISPR guide RNA target site
(orange bar). Mutant sequences for each knockout are shown, compared to the parentalTET2sequence above.bWestern blot shows complete loss of
bothTET2isoforms in CR1 and CR2 knockouts as compared to parental RWPE-1 cells (top).Ku80loading control is shown on the bottom.cMethylation
levels are globally increased inTET2-knockout cells, with more differentially methylated regions (DMRs) in the promoter, gene body, and overall in both
knockouts as compared to RWPE-1 (DiffBind,p< 0.05,n= 2). CR2 exhibits higher methylation levels as compared to CR1.The graph depicts the number
of DMRs exhibiting increased methylation as compared to RWPE-1 (for CR1 and CR2) or as compared to either knockout (for RWPE-1).dGene
expression profiles show comparable levels of upregulation and downregulation in both knockouts, with 17.3% and 4.5% more genes showing
significant downregulation than upregulation (1.5-fold change,p< 0.05).eVisual depiction of gene selection to identify genes exhibiting both
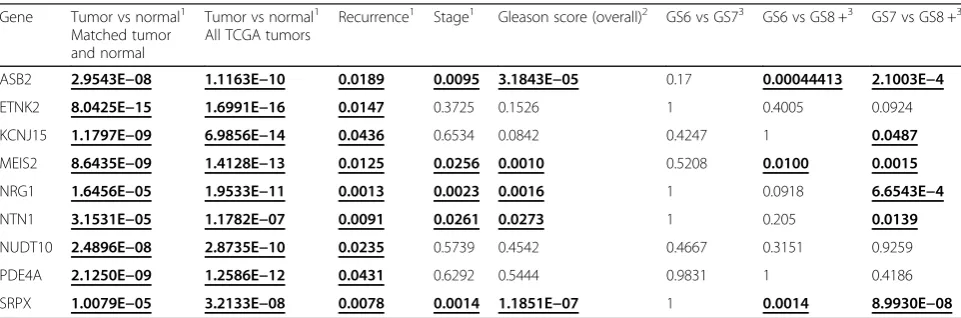
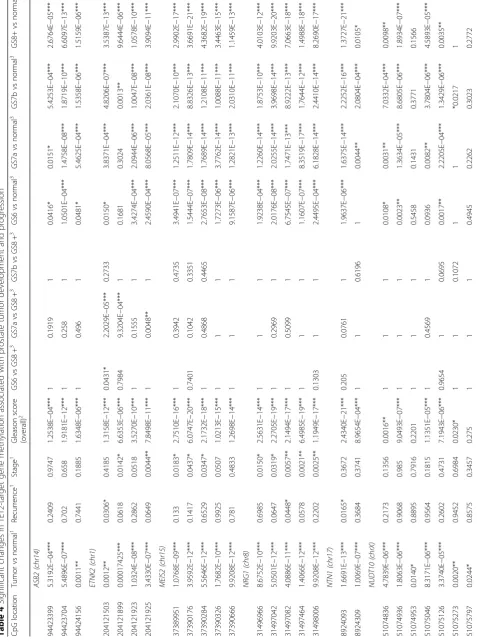
ability of changes in expression of our 27 TET2-target candidate genes to discriminate based on pathological stage, Gleason score (GS), and recurrence in the TCGA dataset (n= 423 tumor samples). Lowered expression of nine of these genes was able to significantly distinguish
recurrent tumors from non-recurrent tumors (Mann-Whitney U test, p< 0.05, Table 1). Five genes could distinguish between tumors of differing patho-logical stage and Gleason scores. Of these, ankyrin re-peat and SOCS box protein 2 (ASB2), Meis homeobox 2
B
A
C
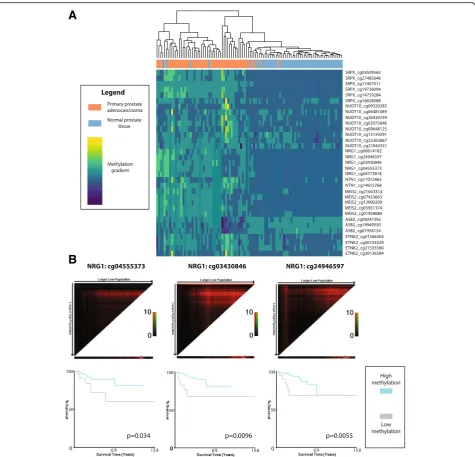
Fig. 2Genes exhibiting expression loss inTET2-knockout cell lines show discriminatory ability between normal prostate and prostate tumor
based on expression status. Unsupervised heatmaps depict expression values normalized by gene fora780 genes exhibiting significant loss of
expression in bothTET2-knockout cells (edgeR,p< 0.05) and a subset of tumors from the Cancer Genome Atlas (TCGA) within the lowest 10th
percentile ofTET2expression (Mann-WhitneyU,p< 1.193E−5), on this low-TET2tumor subset;b60 genes matching the above criteria and
exhibiting increased promoter methylation inTET2knockouts (DiffBind,p< 0.05), in all TCGA tumors with expression data available (n= 423) or
cin matched tumor and normal pairs (n= 35). Expression gradient bar indicates normalized expression levels, ranging from highest (yellow) to
lowest (dark blue).TET2gradient bar indicatesTET2expression in the entire TCGA dataset, ranging from highest (cream) to lowest (black). ERG
(MEIS2), and sushi repeat-containing protein X-linked (SRPX) were able to specifically distinguish GS6 or GS7 from GS8 or higher tumors (Bonferroni-adjusted Dunn test,p< 0.05).
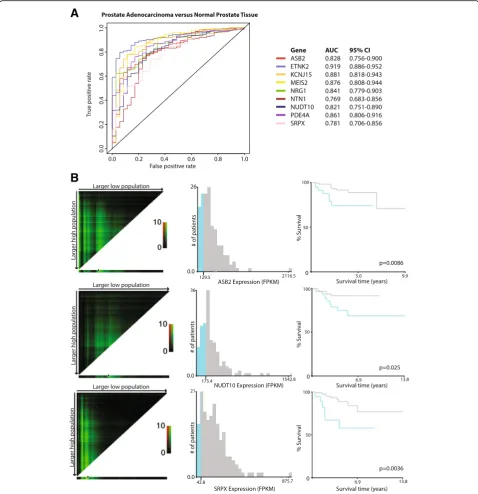
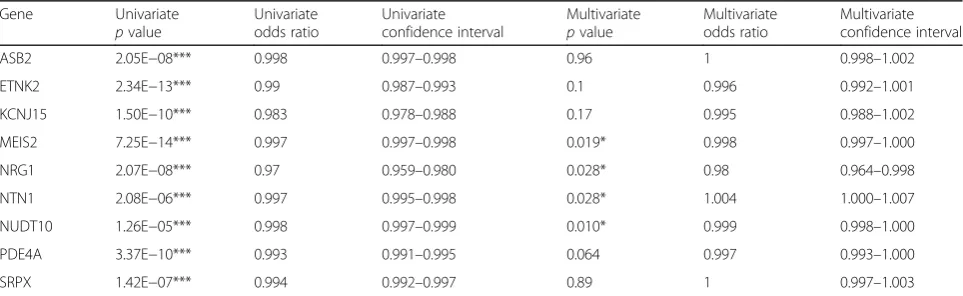
We next examined the performance of these nine genes’expression levels in discriminating between pros-tate tumor and normal tissue through receiver operating curve (ROC) analysis in the TCGA cohort (Fig. 4a, Table 2). All genes exhibited strong performance, with ETNK2 expression providing the highest accuracy of classification (AUC = 0.919, 95% CI 0.886–0.952; sensi-tivity = 0.797, specificity = 0.943). However, although all nine genes were significant predictors of tumor status in univariate logistic regression analyses, four genes in par-ticular—MEIS2, NRG1, NTN1, and NUDT10—were de-termined to be independent predictors by multivariate logistic regression (Table3).
As Mann-Whitney U analysis indicated that the ex-pression of the nine candidate genes was correlated with recurrence, we assessed whether decreased gene
expression was correlated with recurrence-free survival in PCa through X-tile and Kaplan-Meier analysis. Lowered expression of three of the nine genes—ASB2, NUDT10, and SRPX—was significantly correlated with poor prognosis in PCa patients (Fig.4b), while two more genes—ETNK2 and NTN1—were trending (p< 0.10, Additional file12: Figure S8). Overall, these analyses ex-hibited the utility of these genes as promising indicators of PCa status and progression.
We subsequently examined methylation of the nine candidate genes able to distinguish recurrent tumors in the TCGA database at sites proximal to (± 500 bp) or within regions gaining methylation in our KO cell line models to assess possible linkages between the TET2 -target gene panel and PCa. Out of the nine genes, seven possessed TCGA probes proximal to our TET2-KO differential methylation sites which showed discrimin-atory ability between matched tumor and normal sam-ples (n= 50 pairs) based on differential methylation values at specific CpG sites (Table 4, Fig. 5a).
Fig. 3Pathway analysis of candidate genes significantly altered byTET2-knockout. Selected, significant pathway enrichment annotations from
GREAT for genes exhibiting significantly altered expression in bothTET2-knockout cell lines and in tumor versus normal samples from the TCGA
(binomialpvalue < 0.05). Bar coloration indicates the number of candidate genes enriched within each pathway
Table 1Significant changes in TET2-target gene expression associated with prostate cancer development and progression
Gene Tumor vs normal1
Matched tumor and normal
Tumor vs normal1 All TCGA tumors
Recurrence1 Stage1 Gleason score (overall)2 GS6 vs GS73 GS6 vs GS8 +3 GS7 vs GS8 +3
ASB2 2.9543E−08 1.1163E−10 0.0189 0.0095 3.1843E−05 0.17 0.00044413 2.1003E−4
ETNK2 8.0425E−15 1.6991E−16 0.0147 0.3725 0.1526 1 0.4005 0.0924
KCNJ15 1.1797E−09 6.9856E−14 0.0436 0.6534 0.0842 0.4247 1 0.0487
MEIS2 8.6435E−09 1.4128E−13 0.0125 0.0256 0.0010 0.5208 0.0100 0.0015
NRG1 1.6456E−05 1.9533E−11 0.0013 0.0023 0.0016 1 0.0918 6.6543E−4
NTN1 3.1531E−05 1.1782E−07 0.0091 0.0261 0.0273 1 0.205 0.0139
NUDT10 2.4896E−08 2.8735E−10 0.0235 0.5739 0.4542 0.4667 0.3151 0.9259
PDE4A 2.1250E−09 1.2586E−12 0.0431 0.6292 0.5444 0.9831 1 0.4186
SRPX 1.0079E−05 3.2133E−08 0.0078 0.0014 1.1851E−07 1 0.0014 8.9930E−08
Methylation of SRPX was found to be completely inde-pendent of ERG fusion status in tumors. ASB2, MEIS2, and NRG1 methylation was increased in ERG-fusion positive tumors, while ETNK2, NTN1, and NUDT10
showed decreased methylation associated with ERG sta-tus (Additional file 13: Table S5). Gene probe methyla-tion differences were validated in an independent methylation array dataset (n= 90; accession number
A
B
Fig. 4Candidate gene expression is indicative of tumor status and can predict worse recurrence-free survival in patients.aReceiver operating
characteristic (ROC) curves for individual candidate gene expression, stratifying between benign (n= 35) and tumor (n= 423) patients in the TCGA
cohort. AUCs and 95% confidence intervals for each gene are provided on the right.bX-tile analysis and Kaplan-Meier plots for prediction of
biochemical recurrence-free survival in the TCGA cohort. Left: X-tile plots depictχ2values for all possible data divisions, with brightness indicating
strength of association and green coloration indicating a direct relationship. Black circles on the bottom bars for each graph depict automatically
generated cut points maximizing theχ2value in an auto-generated training set. Middle: Histogram depicting the number of patients in the
auto-generated validation set below (blue) or above (gray) the cutoff point. Right: Kaplan-Meier plot showing recurrence-free survival in low-expressing
GSE73549), with probes in all genes except forASB2able to significantly distinguish between normal tissues, prostate tumors, and lymph node PCa metastases (Kruskal-Wallis testp< 0.05, Additional file14: Table S6). Increased methylation of two probes in MEIS2 (cg01566404 and cg13800209) was also able to signifi-cantly distinguish between prostate tumor sites and meta-static cancer (Bonferroni-adjusted Dunn test,p< 0.05).
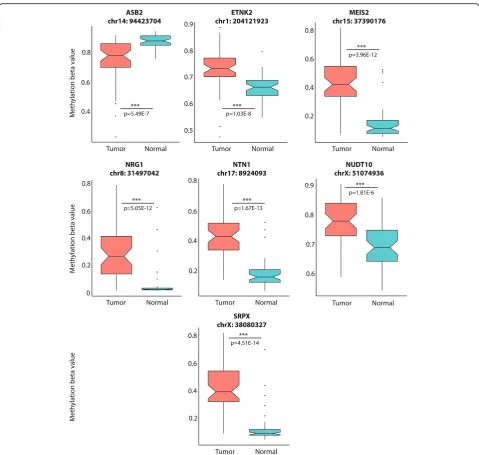
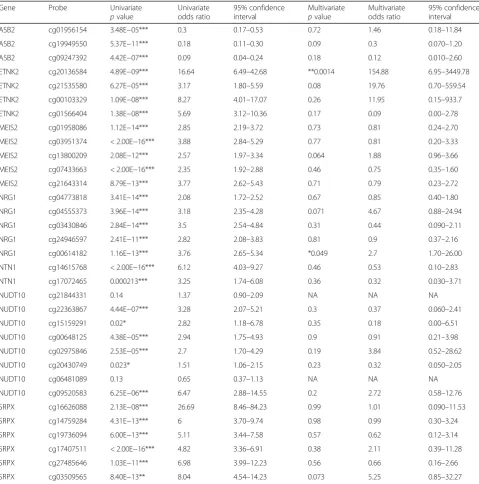
All genes exceptASB2exhibited significantly increased tumor methylation as compared to normal prostate in all significant proximal probes, while ASB2 methylation was significantly decreased in TCGA prostate tumors at all significant probes within the promoter as well as its single proximal probe (Additional file 15: Figure S9, Table5, Fig.6). These findings were reflected in univari-ate logistic regression analyses of logistic-transformed methylation β-values (M-values; Table 6) in the entire TCGA dataset (n= 478), whereASB2methylation probes were unique in exhibiting significant association with tumor status based on decreased, rather than increased, methylation values (ORs ranging from 0.09 to 0.30). In-triguingly, ASB2 did not possess any probes located within the ASB2 promoter methylation peak from the
TET2-KO differentially methylated site (DMS), raising the possibility that the increased methylation observed in TET2 KO cells was specific to that region. Most methylation probes exhibited strong discriminatory performance between tumor and normal tissue, with median AUC of 0.834 and probes within three genes— MEIS2,NRG1, and SRPX—exhibiting sensitivities greater than 90% (Table 5). However, multivariate logistic re-gression analyses indicated that probes in ETNK2 (cg20136584, Wald p value = 0.0014) and NRG1 (cg00614182, Wald p value = 0.049) were independent predictors of tumor versus normal status in the TCGA cohort, indicating that increased methylation of these genes may be particularly important in PCa (Table6).
Next, we examined methylation of these proximal probes in all tumors from the TCGA cohort (n= 428) as possible discriminators for the aforementioned clinicopathological variables (Table4, Additional file16: Figure S10). All seven genes with proximal probes possessed at least one probe able to significantly distinguish tumors of any GS (6, 7a, 7b, or 8+) from normal samples (Bonferroni-adjusted Dunn test,p< 0.05). Furthermore, all genes exceptMEIS2 andASB2possessed at least one methylation probe able to significantly distinguish tumors based on recurrence (Mann-WhitneyUtest,p< 0.05). Kaplan-Meier analysis of these significant probes revealed that high methylation levels at three NRG1 probes were significantly associated with poor outcome in terms of recurrence-free survival (Fig. 5b). Two more probes in NRG1 (cg00614182, log-rank p value = 0.0544) and ETNK2 (cg20136584, log-rankpvalue = 0.0693) were trending for significance.
TET2-target geneASB2exhibits localized and specific gain
of promoter methylation in prostate tumors within the
TET2-target site
As ASB2 was unique among the seven candidate genes in exhibiting a differential methylation pattern in its proximal methylation probes in the TCGA as compared
Table 2Sensitivity and specificity for nine candidate genes in classifying prostate tumor vs normal
Gene Sensitivity Specificity
ASB2 0.631 0.914
ETNK2 0.797 0.943
KCNJ15 0.778 0.886
MEIS2 0.839 0.829
NRG1 0.619 0.971
NTN1 0.749 0.771
NUDT10 0.787 0.743
PDE4A 0.759 0.829
SRPX 0.73 0.714
Table 3Univariate and multivariate logistic regression analyses for classification of prostate tumor vs normal prostate
Gene Univariate
pvalue
Univariate odds ratio
Univariate confidence interval
Multivariate pvalue
Multivariate odds ratio
Multivariate confidence interval
ASB2 2.05E−08*** 0.998 0.997–0.998 0.96 1 0.998–1.002
ETNK2 2.34E−13*** 0.99 0.987–0.993 0.1 0.996 0.992–1.001
KCNJ15 1.50E−10*** 0.983 0.978–0.988 0.17 0.995 0.988–1.002
MEIS2 7.25E−14*** 0.997 0.997–0.998 0.019* 0.998 0.997–1.000
NRG1 2.07E−08*** 0.97 0.959–0.980 0.028* 0.98 0.964–0.998
NTN1 2.08E−06*** 0.997 0.995–0.998 0.028* 1.004 1.000–1.007
NUDT10 1.26E−05*** 0.998 0.997–0.999 0.010* 0.999 0.998–1.000
PDE4A 3.37E−10*** 0.993 0.991–0.995 0.064 0.997 0.993–1.000
SRPX 1.42E−07*** 0.994 0.992–0.997 0.89 1 0.997–1.003
to our KOs, we selected this gene for further validation to assess the specificity and accuracy of the TET2-directed methylation changes observed in our cell line model.
Following validation of ASB2methylation and expres-sion data from sequencing via MBD-qPCR and RT-qPCR, respectively, in both KO and parental cells (Additional file 17: Figure S11 and Additional file 18: Figure S12), we examined methylation levels of our TET2-KO-specific DMR in an independent, limited series
of primary patient samples comprised of matched normal and tumor tissues (n= 19 per group).
We found that, in concordance with the results ob-served in our TET2 KO models and in contrast to our observations in the TCGA dataset, methylation of the ASB2 promoter region was significantly increased in tumor samples as compared to normal (p= 0.04067, paired Wilcoxon signed-rank test, Fig. 7). This observa-tion underscores both qualitative and quantitative
A
B
Fig. 5Tumor methylation comparison of candidate genes and predictive ability for recurrence.aUnsupervised heatmap depicting methylation beta values normalized by probe for seven genes exhibiting significantly altered expression and methylation in both knockouts and matched
prostate tumor and normal samples (n= 50). Methylation gradient bar indicates normalized methylation levels, ranging from highest (yellow) to
lowest (dark blue). Dendrograms indicate clustering between tissue samples.bX-tile analysis depicting methylation probes significantly associated
with outcome. High-methylation probe status (gray, above cutoff) was indicative of worse recurrence-free survival as compared to patients with
differences occurring in methylation marks within the TET2-targetedASB2gene region.
Discussion
Multiple lines of evidence have implicated a role for dys-regulation of the master epigenetic regulator TET2 in PCa development and progression. Although TET2 is less frequently mutated in primary PCa as compared to metastatic PCa, several factors have been hypothesized as potentially contributing to its loss of expression, in-cluding hypoxia, which deprives TET enzymes of the
oxygen required for their dioxygenase activity, alter-ations in expression of TET-governing transcription fac-tors such as high-mobility group AT-hook 2 (HGMA2), and repression of TET by oncogenic miRNAs [25, 28]. Furthermore, TET2 exhibits high mutation rates (10–20%) and extensive loss of heterozygosity (~ 60%) in metastatic prostate tumors [21–23, 28]. Genome-wide association studies have also shown increased PCa risk linked to an intergenicTET2-proximal SNP (rs7679673) [23,29]. However, perhaps due to its low somatic muta-tion rates in primary prostate cancer, TET2-mediated changes have not been systematically investigated as po-tential drivers of cancer development. Therefore, we per-formed TET2 KO in normal prostate RWPE-1 cells to identify targets of TET2 mediation that may be import-ant in prostate carcinogenesis.
Of the two different KOs, CR1 (the heterozygous knock-out) showed unique methylation targeting of 487 genes, while the homozygous knockout model CR2 had 2682 uniquely methylated genes. TET2 haploinsufficiency is enough to alter cellular properties and contribute to hematological malignancies, possibly due to a decrease in its catalytic activity [26,30]. However, as complete loss of TET2protein is observed in both KOs, these findings sug-gest that certain TET2 mutations may cause a dominant negative phenotype. The usage of alternative compensa-tory mechanisms (such as increased activity of otherTET enzymes) may explain the differential profiles between the two KOs; however, further studies are required to deter-mine whether the type of TET2 mutation influences the use of alternative 5hmC pathways.
Interestingly, we found that biological pathways af-fected by methylation gain in TET2 KOs overlapped with intergenic 5hmC gain that we previously reported in PCa cell lines [16]. Paradoxically, despite the extensive global loss of 5hmC in PCa, increases in intergenic 5hmC levels were found to occur in genes related to in-flammation and cellular adhesion—the same pathways enriched among silenced genes from our knockout model—resulting in downregulation of immune and ad-hesive functions. These observations suggest that not only are these critical functions governed byTET2 dys-regulation, but also that intergenic 5hmC and promoter 5mC gain may work synergistically to downregulate the same genes and pathways in cancer.
Intriguingly, out of seven key TET2-governed genes identified from our model exhibiting differential methy-lation in normal versus tumor samples in the TCGA at TET2-KO DMS-proximal probes, only one—ASB2— showed significantly decreased, rather than increased, methylation levels in cancer. However, the other target genes possessed probes either within the peaks identified through our methylation sequencing strategy (ETNK2, MEIS2, NRG1, NUDT10) or closer to these DMSs than
Table 5Sensitivity and specificity of candidate gene methylation in classifying prostate tumor vs normal prostate tissue
Gene Probe ID Sensitivity Specificity AUC
ASB2 cg01956154 0.514 0.8 0.684
ASB2 cg19949550 0.759 0.8 0.834
ASB2 cg09247392 0.61 0.84 0.747
ETNK2 cg20136584 0.61 0.92 0.803
ETNK2 cg21535580 0.486 0.9 0.687
ETNK2 cg00103329 0.612 0.94 0.798
ETNK2 cg01566404 0.703 0.86 0.79
MEIS2 cg01958086 0.811 0.84 0.879
MEIS2 cg03951374 0.86 0.92 0.917
MEIS2 cg13800209 0.914 0.84 0.909
MEIS2 cg07433663 0.79 0.88 0.881
MEIS2 cg21643314 0.867 0.82 0.871
NRG1 cg04773818 0.794 0.9 0.849
NRG1 cg04555373 0.902 0.88 0.912
NRG1 cg03430846 0.888 0.86 0.891
NRG1 cg24946597 0.855 0.92 0.914
NRG1 cg00614182 0.862 0.84 0.881
NTN1 cg14615768 0.839 0.94 0.926
NTN1 cg17072465 0.481 0.94 0.671
NUDT10 cg21844331 0.381 0.86 0.62
NUDT10 cg22363867 0.755 0.7 0.747
NUDT10 cg15159291 0.341 0.86 0.61
NUDT10 cg00648125 0.558 0.84 0.712
NUDT10 cg02975846 0.558 0.88 0.705
NUDT10 cg20430749 0.311 1 0.558
NUDT10 cg06481089 0.306 0.92 0.603
NUDT10 cg09520583 0.5 0.92 0.75
SRPX cg16626088 0.762 0.66 0.771
SRPX cg14759284 0.818 0.92 0.902
SRPX cg19736094 0.895 0.9 0.925
SRPX cg17407511 0.874 0.9 0.909
SRPX cg27485646 0.902 0.84 0.905
those forASB2 (at distances of 328 bp, 160 bp, or 22 bp for ASB2, NTN1, or SRPX, respectively), and examin-ation of methylexamin-ation in matched tumor and normal sam-ples from an independent series indicated concordant and increased 5mC within the ASB2 TET2-KO DMS. Furthermore,TET2-KO differentially methylated sites in all candidate genes were highly conserved in primates, ranging from 71.4% (5/7) of CpGs exhibiting conserva-tion among at least three primate species in ASB2 to 100% conservation for all CpGs in ETNK2, MEIS2, NRG1, and SRPX. This sequence conservation suggests
that these TET2-mediated regions may possess a func-tionally important role.
Methylation of ETNK2, NTN1, and NUDT10 was in-creased in ERG-fusion negative tumors, which is con-cordant with the significant loss of TET2 expression in these tumor samples. The increased methylation of MEIS2and NRG1in ERG-positive tumors indicates that TMPRSS2-ERG fusion impacts the methylation status of these genes. However, expression of all seven candidate genes was also found to be independent of ERG fusion status in prostate tumors, which may indicate that their
Fig. 6Methylation differences between tumor and normal samples for seven candidate genes. Notched boxplots show distribution of methylation beta values from 450 k methylation array for representative methylation probes within 500 bp surrounding the differentially methylated regions
observed in candidate genes from ourTET2knockouts in matched tumor vs normal samples (n= 50). Notches indicate 95% confidence interval for
expression is influenced more strongly by TET2 status than by mutation subtype in PCa. Taken together, these findings suggest thatTET2loss results in highly localized region-specific, rather than widespread, changes in methy-lation at conserved regions within target gene promoters, which may have profound effects on gene expression.
Several prior studies have indicated the functional im-portance of our candidate gene panel in cancer develop-ment and progression. All candidate genes except
ethanolamine kinase 2 (ETNK2) have been specifically linked to PCa in some manner. The cell migration-critical gene netrin 1 (NTN1), cellular adhesion molecule neure-gulin 1 (NRG1), and the putative tumor suppressor sushi repeat-containing protein X-linked (SRPX) exhibit down-regulation in prostate cancer as compared to normal pros-tate or benign prospros-tate hyperplasia tissue [30–33], and evidence for association between the expression of ubiqui-tin ligaseASB2and PCa progression is established in the
Table 6Univariate and multivariate logistic regression analyses for classification of prostate tumor vs normal prostate based on probe methylation
Gene Probe Univariate
pvalue
Univariate odds ratio
95% confidence interval
Multivariate pvalue
Multivariate odds ratio
95% confidence interval
ASB2 cg01956154 3.48E−05*** 0.3 0.17–0.53 0.72 1.46 0.18–11.84
ASB2 cg19949550 5.37E−11*** 0.18 0.11–0.30 0.09 0.3 0.070–1.20
ASB2 cg09247392 4.42E−07*** 0.09 0.04–0.24 0.18 0.12 0.010–2.60
ETNK2 cg20136584 4.89E−09*** 16.64 6.49–42.68 **0.0014 154.88 6.95–3449.78
ETNK2 cg21535580 6.27E−05*** 3.17 1.80–5.59 0.08 19.76 0.70–559.54
ETNK2 cg00103329 1.09E−08*** 8.27 4.01–17.07 0.26 11.95 0.15–933.7
ETNK2 cg01566404 1.38E−08*** 5.69 3.12–10.36 0.17 0.09 0.00–2.78
MEIS2 cg01958086 1.12E−14*** 2.85 2.19–3.72 0.73 0.81 0.24–2.70
MEIS2 cg03951374 < 2.00E−16*** 3.88 2.84–5.29 0.77 0.81 0.20–3.33
MEIS2 cg13800209 2.08E−12*** 2.57 1.97–3.34 0.064 1.88 0.96–3.66
MEIS2 cg07433663 < 2.00E−16*** 2.35 1.92–2.88 0.46 0.75 0.35–1.60
MEIS2 cg21643314 8.79E−13*** 3.77 2.62–5.43 0.71 0.79 0.23–2.72
NRG1 cg04773818 3.41E−14*** 2.08 1.72–2.52 0.67 0.85 0.40–1.80
NRG1 cg04555373 3.96E−14*** 3.18 2.35–4.28 0.071 4.67 0.88–24.94
NRG1 cg03430846 2.84E−14*** 3.5 2.54–4.84 0.31 0.44 0.090–2.11
NRG1 cg24946597 2.41E−11*** 2.82 2.08–3.83 0.81 0.9 0.37–2.16
NRG1 cg00614182 1.16E−13*** 3.76 2.65–5.34 *0.049 2.7 1.70–26.00
NTN1 cg14615768 < 2.00E−16*** 6.12 4.03–9.27 0.46 0.53 0.10–2.83
NTN1 cg17072465 0.000213*** 3.25 1.74–6.08 0.36 0.32 0.030–3.71
NUDT10 cg21844331 0.14 1.37 0.90–2.09 NA NA NA
NUDT10 cg22363867 4.44E−07*** 3.28 2.07–5.21 0.3 0.37 0.060–2.41
NUDT10 cg15159291 0.02* 2.82 1.18–6.78 0.35 0.18 0.00–6.51
NUDT10 cg00648125 4.38E−05*** 2.94 1.75–4.93 0.9 0.91 0.21–3.98
NUDT10 cg02975846 2.53E−05*** 2.7 1.70–4.29 0.19 3.84 0.52–28.62
NUDT10 cg20430749 0.023* 1.51 1.06–2.15 0.23 0.32 0.050–2.05
NUDT10 cg06481089 0.13 0.65 0.37–1.13 NA NA NA
NUDT10 cg09520583 6.25E−06*** 6.47 2.88–14.55 0.2 2.72 0.58–12.76
SRPX cg16626088 2.13E−08*** 26.69 8.46–84.23 0.99 1.01 0.090–11.53
SRPX cg14759284 4.31E−13*** 6 3.70–9.74 0.98 0.99 0.30–3.24
SRPX cg19736094 6.00E−13*** 5.11 3.44–7.58 0.57 0.62 0.12–3.14
SRPX cg17407511 < 2.00E−16*** 4.82 3.36–6.91 0.38 2.11 0.39–11.28
SRPX cg27485646 1.03E−11*** 6.98 3.99–12.23 0.56 0.66 0.16–2.66
SRPX cg03509565 8.40E−13** 8.04 4.54–14.23 0.073 5.25 0.85–32.27
literature [34,35]. Intriguingly, although we foundNRG1 probe methylation status to be significantly associated with recurrence-free survival by Kaplan-Meier analyses, its ex-pression was not, even though bothNRG1expression and methylation were associated withTET2expression status. This may indicate that candidate gene expression may be influenced in a methylation-independent manner (such as TET2-mediated O-GlcNAcylation); however, further stud-ies are required to elucidate the mechanisms of this relationship.
Loss of the transcriptional regulatorMEIS2is not only associated with recurrence and worse survival in PCa patients [36], but is also associated with the development of castration-resistant prostate cancer due to its inhib-ition resulting in constitutive activation of nuclear factor kappa-light-chain-enhancer of activated B cells (NF-κB) signaling [37]. Although expression of nudix hydrolase 10 (NUDT10) has not yet been examined in the context of PCa, the rs5945572 risk SNP within this gene is sig-nificantly associated with increased risk of PCa in Caucasian, African, and Asian ethnic groups, function-ally implicating this gene in prostate cancer [38]. Intriguingly, several of these genes are upregulated in other types of cancers, including gastric, ovarian, and breast cancers, indicating that the mechanisms by which
they contribute to PCa may be unique. Overall, further exploration of the TET2 KO DMRs within the target genes identified by this study may uncover new insight into the mechanisms of carcinogenic changes in PCa.
In conclusion, we have demonstrated the utility of our TET2-knockout based candidate selection strategy in identifying significantly altered genes and potential markers of prostate carcinogenesis. Correlation of TET2-target genes with clinicopathological characteris-tics of PCa revealed a panel of seven promising candi-dates—ASB2, ETNK2, MEIS2, NRG1, NTN1, NUDT10, and SRPX—exhibiting discriminatory ability between tumor and normal samples and/or measures of PCa pro-gression based on their 5mC and expression status. Low-ered expression of three of these genes (ASB2,NUDT10, and SRPX), as well as increased methylation of NRG1, was significantly correlated with lower recurrence-free survival in PCa patients, showing the utility of these TET2 targets as potential markers of disease. Validation of one such target gene, ASB2, indicated high specificity of TET2-mediated methylation, which may provide insight into the functionality of TET2-directed changes in PCa. Ultimately, future biological studies of epigenetic and transcriptomic disruption of candidate gene in can-cer may allow us to not only identify new diagnostic and prognostic markers for PCa, but may also provide novel insights into the dynamic changes underlying develop-ment and progression in many different cancers exhibit-ingTET2dysregulation.
Supplementary information
Supplementary information is available at Clinical Epi-genetics’website.
Materials and methods Cell culture and CRISPR knockout
Normal human prostate epithelial cell line, RWPE-1, was obtained from the American Type Culture Collec-tion (ATCC, Manassas, Virginia). For CRISPR knockout, cells were transfected using Lipofectamine as per the manufacturer’s protocol with commercially available Sigma (St. Louis, Missouri) CRISPR plasmid expressing gRNA targeting the first coding exon of TET2, as well as Cas9 fused to GFP via a 2A linker peptide (gRNA target ID: HS0000114238; sequence: TTAGTAGCCTGACT GTTAA with TGG protospacer-associated motif ). Forty-eight hours post-transfection, GFP-FACS was used to perform single-cell sorting of successfully transfected cells onto 96-well plates. Post-expansion, populations were assayed via Sanger sequencing (The Centre for Ap-plied Genomics, Toronto) for the presence of indels. Off-target analysis was performed as described by Mali et al. [27]. RWPE-1 and knockout cells were cultured with keratinocyte serum-free medium (K-SFM)
Fig. 7PromoterASB2region gaining methylation in knockouts exhibits hypermethylation in prostate tumor samples compared to matched normal prostate. Scatterplot depicting increased methylation
in matched tumor and normal samples (n= 18 per group), with mean
(Invitrogen, catalog #17005042), supplemented with 0.05 mg/mL bovine pituitary extract (BPE) and 5 ng/mL human recombinant epidermal growth factor (EGF). All cells were cultured as a monolayer and maintained in a humidified incubator at 37 °C with 5% CO2.
Patient cohort
Radical prostatectomy tissue samples used in this study were comprised of treatment-naïve patients with PCa with matched normal tissue samples and were accrued for gene methylation analysis as per REB guidelines. Gleason score 7 samples were collected from October 2002 to July 2007, with a median follow-up time of 5.04 years (ranging from 3.88 to 9.79 years). Full clinical information for these patients can be found in Additional file19: Table S7.
DNA and RNA extraction
DNA was extracted from cell pellets using the QIAamp DNA Mini Kit (Qiagen, catalog #51306) following the manufacturer’s protocol. Whole RNA was extracted via TRIzol method as per the manufacturer’s protocol (Thermo Fisher, catalog #15596026) and was cleaned up using the RNeasy Mini Kit (Qiagen, catalog #74104).
Whole-methylome and whole-transcriptome sequencing: MBD-Seq and RNA-Seq
2.5μg sheared genomic DNA from RWPE-1 and CR1/CR2 knockout cells was enriched for 5mC with the MethylMi-ner kit (Invitrogen, catalog #ME10025) as previously de-scribed [16]. Enriched DNA was submitted in duplicate along with unenriched input controls for library prepar-ation (NEBNext® ChIP-seq Library Prep Reagent Set for Illumina) and high-throughput sequencing using the HiSeq 2500 (Illumina, San Diego, California) at The Centre for Applied Genomics. Each library generated approximately 75 million paired-end reads. RNA library preparation for each of the above cell lines was performed following the NEB NEBNext Ultra Directional Library Preparation protocol (poly-A mRNA) on 200 ng total RNA. Libraries were sequenced in duplicate using the HiSeq 2500 at The Centre for Applied Genomics, with each library generating approximately 30 million paired-end reads.
Bioinformatics analysis of MBD-Seq
Trimmed reads were mapped to hg19 using Bowtie2 (v2.2.1). [39] Repitools (v 1.12.1) was used to evaluate bound, enriched sample enrichment compared to input (Additional file20: Figure S13). Significantly enriched re-gions of methylation were identified using Model-based Analysis of ChIP-Seq algorithm (MACS v 2.0.10). [40] DiffBind (v 1.12.2) was used to derive consensus peaks based on the presence of a peak in at least one sample analyzed. Annotation was performed using ChIPpea-kAnno R package (v.2.16.4) [41] and a customized
version of Annovar program [42] with RefSeq genes to determine specific genomic features closest to the peaks.
Bioinformatics analysis of RNA-Seq
Trimmed reads were aligned to the hg19 human genome using Tophat v2.0.11, and raw read counts were extracted using htseq-count v0.6.1p2, with only uniquely mapping reads being counted. Raw gene counts were then loaded and sample-normalized using DESeq v1.18.0, and MDS analysis was performed to determine sample separation (Additional file21: Figure S14). Two-condition differential expression was done with edgeR v3.8.6, filtering for only genes that were expressed. Quality of raw and trimmed reads was assessed with FastQC v0.11.2 and FastQ-Screen v0.4.3, and read distribution and strandedness was assessed with RSeQC v2.3.7. The above two analyses were per-formed by The Centre for Applied Genomics (Toronto).
Western blotting
Cells were lysed with RIPA buffer supplemented with pro-tease inhibitors and incubated on ice for 10 min, then cen-trifuged at 14,000 RPM for 10 min at 4 °C. Fifty-microgram samples with SDS loading dye were boiled and run on a 7.5% SDS-PAGE gel. Proteins were detected by immuno-blotting (using 5% milk in TBS-T as blocking reagent) with antibodies against TET2(Abcam, ab94580) orKu80 (Cell Signaling Technologies, C48E7) overnight at 4 °C Unedited Western blot images from Figure 1B are shown in Add-itional22: Figure S15.
qRT-PCR
Primers were designed for specific targeting ofASB2–001 (isoform 2) and ASB2–002 (isoform 1) (GrCh37) so that the shared reverse primer spanned the junctions between exons 4 and 5 in isoform 1 and exons 3 and 4 in isoform 2. The forward primer for isoform 1 was located in its sec-ond exon (which is unique to isoform 1), while the forward primer for isoform 2 was located within a 67-bp region in its first exon unique to isoform 2 (Additional file 2: Table S1). Reverse transcription was performed using the qScript cDNA SuperMix kit (Quantabio, catalog #95048–100), and expression levels of transcripts were analyzed using SYBR Green qPCR.
Pathway analysis of MBD-Seq datasets correlated with RNA-Seq expression data
MethyLight
Genomic DNA from matched normal and tumors was bisulfite converted and subjected to the MethyLight assay as previously described [44], using ALU as a methylation reference (Additional file 2: Table S1). Each sample was analyzed in duplicate on the Applied Biosys-tems® 7500 Real-Time PCR System. Methylation levels were determined using the delta-delta Ct method, with supermethylated (CH3) DNA from EMD Millipore (catalog #S7821) as control. Genes with Ct for ALU ex-ceeding a value of 30 were excluded from the analysis.
Statistical analyses
Association between candidate gene expression or methylation and tumor versus normal status or outcome was analyzed using Kruskal-Wallis and Mann-Whitney Utests as part of the base “stats”package of R (v3.4.0). Bonferroni correction was applied by dividing 0.05 by the number of samples analyzed and using the resultant value as the confidence threshold. Receiver operator curve (ROC) analysis was used to assess the discrimin-atory ability of candidate gene expression between tumor and normal samples. ROC plots, confidence intervals (via DeLong’s test), and AUC values were generated using the ROCR package in R (v1.0.7). Sensitivity and specificity were calculated based on the identification of the optimal cutoff point from ROC curve analysis maxi-mizing both values. Univariate and multivariate logistic regression analyses were performed for individual gene expression values via generalized linear model analysis in R, using Waldpvalues to determine significance, and odds ratios were calculated via the logistic display func-tion of the epiDisplay package (v3.5.0.1).
X-tile software (v3.6.1) was used to split the TCGA data-set into two parts, and X-tile plots were used to determine the optimal cutoff point for prediction of biochemical re-currence in the training set (cutoff points generated auto-matically by X-tile software) [45]. This cutoff was applied to the validation set as generated by X-tile software, and Kaplan-Meier survival curves and log-rankpvalues were used to assess individual gene performance.p< 0.05 was used as the confidence threshold for the above analyses unless otherwise specified in the manuscript.
Additional files
Additional file 1:Figure S1.CRISPR-TET2 guide RNA targets the first coding exon of TET2. Arrows indicate the CRISPR target site on gene diagram of the functional TET2 isoform 1, which truncates the protein before any functional domains are produced. (TIF 134 kb)
Additional file 2:Table S1.Primer and probe sequences used for CRISPR verification and methylation-specific qPCR. (XLSX 17 kb)
Additional file 3:Figure S2.Off-target analysis of CRISPR-TET2 clones (CR1 and CR2). Sanger sequencing chromatograms for the top two gene regions partially matching the CRISPR-TET2 gRNA sequence shows no
off-target effects of CRISPR on the parental gene sequence for either CR1 (top) or CR2 (bottom). (TIF 7908 kb)
Additional file 4:Figure S3.Overexposed Western blot for TET2 protein in parental RWPE-1 and TET2-KO cells. Overexposed Western blot shows no detectable bands for either TET2 isoform for CR1 or CR2 knockouts as compared to parental RWPE-1 cells. (TIF 4414 kb)
Additional file 5:Figure S4.Heatmap showing methylation of all genes exhibiting increased promoter methylation in TET2-KOs as compared to RWPE-1 cells. Methylation gradient bar indicates gene-normalized methylation levels, ranging from highest (yellow) to lowest (dark blue). Heatmap was generated via unsupervised clustering and clusters RWPE-1 cells separately from knockouts. (TIF 29540 kb)
Additional file 6:Figure S5.Heatmap showing expression of all differentially expressed and downregulated genes in both TET2-KOs as compared to RWPE-1 cells. Expression gradient bar indicates gene-normalized expression levels, ranging from highest (yellow) to lowest (dark blue). Heatmap was generated via unsupervised clustering and clusters RWPE-1 cells separately from knockouts. (TIF 29524 kb)
Additional file 7:Table S2.Genes exhibiting both significantly increased promoter methylation and significantly lowered expression in CRISPR TET2-KO cells. (XLSX 26 kb)
Additional file 8:Figure S6.Heatmap showing expression of 780 genes which exhibited significant expression alterations in knockout cells as well
as low-TET2expressing tumors, for all tumor (n= 423) and normal (n= 35)
samples in the TCGA. Expression gradient bar indicates gene-normalized expression levels, ranging from highest (yellow) to lowest (dark blue). Heatmap was generated via unsupervised clustering. (TIF 36633 kb)
Additional file 9:Table S3.Characteristics of the 61 genes exhibiting significantly increased promoter methylation and lowered expression in TET2-KOs as well as significantly lowered expression in TCGA prostate tumors. (XLSX 18 kb)
Additional file 10:Table S4.Expression of candidate genes significantly associated with ERG fusion status. (XLSX 18 kb)
Additional file 11:Figure S7.Pathway enrichment analysis of genes losing expression in CRISPR-TET2 knockout cells. Visual depiction of key pathways identified from GREAT analysis of all genes silenced in both CR1 and CR2, using the whole genome as a background. (TIF 917 kb)
Additional file 12:Figure S8.X-tile analysis and Kaplan-Meier plots for prediction of biochemical recurrence-free survival in the TCGA cohort.
Left: X-tile plots depictχ2values for all possible data divisions, with brightness
indicating strength of association and green coloration indicating a direct relationship. Black circles on the bottom bars for each graph depict
automatically generated cut points maximizing theχ2value in an
auto-generated training set. Middle: Histogram depicting the number of patients in the auto-generated validation set below (blue) or above (gray) the cutoff point. Right: Kaplan-Meier plot showing recurrence-free survival in low-expressing (blue; below cutoff) or high-expressing (gray; above
cutoff) groups for each gene. Log-rankpvalues are indicated on each graph.
(EPS 3514 kb)
Additional file 13:Table S5.Association of candidate gene probe methylation with ERG fusion status. (XLSX 19 kb)
Additional file 14:Table S6.Analysis of candidate gene probes in an independent methylation array dataset (GSE73549). (XLSX 20 kb)
Additional file 15:Figure S9.Methylation array probe locations on
candidate genes with respect to theTET2-knockout methylated site and
transcription start sites. Numbers indicate the genomic location of each
probe (blue circle), transcription start site (green triangle), orTET2-knockout
differentially methylated site (red rectangle). Probes chosen are within 500
base pairs ofTET2-KO sites except forASB2, which includes two additional
probes within the promoter region. (TIF 37076 kb)
Additional file 16:Figure S10.Heatmap showing methylation of seven
candidate genes for all tumor (n= 428) and normal (n= 50) samples in
Additional file 17:Figure S11.Methylation ofASB2is increased in both
knockouts (CR1 and CR2) within theTET2-knockout cell differentially
methylated site. Expression analysis performed using MethyLight
methylation-specific qPCR (n= 3). (TIF 472 kb)
Additional file 18:Figure S12.Expression of bothASB2isoforms is lowered in both knockouts as compared to parental RWPE-1 cells. Expression
analysis performed using qRT-PCR (n= 3). (TIF 1636 kb)
Additional file 19:Table S7.Clinicopathological characteristics of prostate tumor tissues used for methylation analysis. (XLSX 15 kb)
Additional file 20:Figure S13.Diagnostic enrichment plot of MBD-Seq samples from TET2-KO cells as compared to input controls. Enrichment diagnostic graphs comparing the curve of input (non-enriched) sample (blue and yellow lines) to biological replicates of CR1 (green and orange lines) and CR2 (purple and red lines), respectively. (TIF 12551 kb)
Additional file 21:Figure S14.Multidimensional scaling (MDS) plot depicting Euclidean distances (similarities) between RNA-sequencing samples. MDS plot shows relative similarities between RWPE-1, TET2-KO cells, and the prostate adenocarcinoma 22Rv1 cell line based on RNA sequencing results. (TIF 13562 kb)
Additional file 22:Proteins were detected by immunoblotting with antibodies. (TIF 118 kb)
Acknowledgements
Not applicable
Funding
This work was supported by Prostate Cancer Canada and the Movember Foundation under Translation Acceleration Grant number 2014-01. SNK was
funded by the Ontario Graduate Scholarship (OGS)–Faculty of Medicine at
University of Toronto (UofT), Scace Graduate Fellowship in Prostate Cancer Research (UofT), Frank Fletcher Memorial Fund (UofT), and the Peterborough K.M. Hunter OSOTF Award (UofT).
Availability of data and materials
The data sets supporting the results of this article will be made available in the Gene Expression Omnibus (GEO) repository following acceptance, under accession number GSE128399 (The Cancer Genome Atlas datasets analysed
in this study are publicly available online athttps://portal.gdc.cancer.gov. [5]
Authors’contributions
SNK carried out CRISPR knockout cell line generation, 5mC enrichment, and sample preparation/submission for sequencing; performed and analyzed all data including integrative analysis and pathway analysis, candidate gene panel identification, heatmap generation/interpretation, statistical analyses, MethyLight, and qPCR experiments; and drafted the manuscript. RH and GB helped with pathway analysis and interpretation. AZ, TvdK, and NH participated in the design, coordination, and critical review of the manuscript. BB conceived of the study, participated in its design and coordination, and helped to draft the manuscript. All authors read and approved the final manuscript.
Ethics approval and consent to participate
Matched human prostate tumor and normal tissue was obtained as per ethical approvals established by the Research Ethics Board of Mount Sinai Hospital, Toronto, Ontario (REB reference #140071-E).
Consent for publication
Not applicable
Competing interests
The authors declare that they have no competing interests.
Publisher’s Note
Springer Nature remains neutral with regard to jurisdictional claims in published maps and institutional affiliations.
Author details
1Lunenfeld-Tanenbaum Research Institute, Mount Sinai Hospital, 60 Murray
Street, L6-304B, Toronto, ON M5T 3L9, Canada.2Department of Laboratory
Medicine and Pathobiology, University of Toronto, Medical Sciences Building (6th floor), 1 King’s College Circle, Toronto, ON M5S 1A8, Canada.3Terrence Donnelly Centre for Cellular and Biomolecular Research, University of Toronto, 160 College St, Toronto, ON M5S 3E1, Canada.4Department of Pathology, University Health Network, University of Toronto, 200 Elizabeth St, Toronto, ON M5G 2C4, Canada.5Department of Surgery and Surgical Oncology, Division of Urology, University Health Network, University of Toronto, 190 Elizabeth St, Toronto, ON M5G 2C4, Canada.
Received: 18 December 2018 Accepted: 10 March 2019
References
1. Ferlay J, Soerjomataram I, Dikshit R, Eser S, Mathers C, Rebelo M, et al.
Cancer incidence and mortality worldwide: sources, methods and major
patterns in GLOBOCAN 2012. Int J Cancer. 2015;136(5):E359–86.
2. Wong MCS, Goggins WB, Wang HH, Fung FD, Leung C, Wong SY, et al.
Global incidence and mortality for prostate cancer: analysis of temporal
patterns and trends in 36 countries. Eur Urol. 2016;70(5):862–74.
3. Foley R, Hollywood D, Lawler M. Molecular pathology of prostate cancer:
the key to identifying new biomarkers of disease. Endocr Relat Cancer. 2004;
11(3):477–88.
4. Fraser M, Sabelnykova VY, Yamaguchi TN, Heisler LE, Livingstone J, Huang V,
et al. Genomic hallmarks of localized, non-indolent prostate cancer. Nature.
2017;541(7637):359–64.
5. Cancer Genome Atlas Research Network. The molecular taxonomy of
primary prostate cancer. Cell. 2015;163(4):1011–25.
6. Packer JR, Maitland NJ. The molecular and cellular origin of human prostate
cancer. Biochim Biophys Acta. 2016;1863(6 Pt A):1238–60.
7. Jerónimo C, Henrique R, Hoque MO, Mambo E, Ribeiro FR, Varzim G, et al. A
quantitative promoter methylation profile of prostate cancer. Clin Cancer
Res. 2004;10(24):8472–8.
8. Pan J, Chen J, Zhang B, Chen X, Huang B, Zhuang J, et al. Association
between RASSF1A promoter methylation and prostate cancer: a systematic review and meta-analysis. PLoS One. 2013;8(9):e75283.
9. Cairns P, Esteller M, Herman JG, Schoenberg M, Jeronimo C,
Sanchez-Cespedes M, et al. Molecular detection of prostate cancer in urine by GSTP1
hypermethylation. Clin Cancer Res. 2001;7(9):2727–30.
10. Jerónimo C, Usadel H, Henrique R, Silva C, Oliveira J, Lopes C, et al.
Quantitative GSTP1 hypermethylation in bodily fluids of patients with
prostate cancer. Urology. 2002;60(6):1131–5.
11. Lee WH, Isaacs WB, Bova GS, Nelson WG. CG island methylation changes
near the GSTP1 gene in prostatic carcinoma cells detected using the polymerase chain reaction: a new prostate cancer biomarker. Cancer
Epidemiol Biomark Prev. 1997;6(6):443–50.
12. Zhao F, Olkhov-Mitsel E, van der Kwast T, Sykes J, Zdravic D, Venkateswaran
V, et al. Urinary DNA methylation biomarkers for noninvasive prediction of aggressive disease in patients with prostate cancer on active surveillance. J
Urol. 2017;197(2):335–41.
13. Liu L, Kron KJ, Pethe VV, Demetrashvili N, Nesbitt ME, Trachtenberg J, et al.
Association of tissue promoter methylation levels of APC, TGFβ2, HOXD3 and
RASSF1A with prostate cancer progression. Int J Cancer. 2011;129(10):2454–62.
14. Olkhov-Mitsel E, van der Kwast T, Kron K, Ozcelik H, Briollais L, Massey C, et
al. Quantitative DNA methylation analysis of genes coding for kallikrein-related peptidases 6 and 10 as biomarkers for prostate cancer. Epigenetics.
2012;7(9):1037–45.
15. Strand SH, Hoyer S, Lynnerup AS, Haldrup C, Storebjerg TM, Borre M, et al.
High levels of 5-hydroxymethylcytosine (5hmC) is an adverse predictor of biochemical recurrence after prostatectomy in ERG-negative prostate cancer. Clin Epigenetics. 2015;7:111.
16. Kamdar SN, Ho LT, Kron KJ, Isserlin R, van der Kwast T, Zlotta AR, et al.
Dynamic interplay between locus-specific DNA methylation and hydroxymethylation regulates distinct biological pathways in prostate carcinogenesis. Clin Epigenetics. 2016;8:32.
17. Pastor WA, Aravind L, Rao A. TETonic shift: biological roles of TET proteins in
DNA demethylation and transcription. Nat Rev Mol Cell Biol. 2013;14(6):341–56.
18. Rasmussen KD, Helin K. Role of TET enzymes in DNA methylation,
development, and cancer. Genes Dev. 2016;30:733–50.
19. Yang H, Liu Y, Bai F, Zhang JY, Ma SH, Liu J, et al. Tumor development is
associated with decrease of TET gene expression and 5-methylcytosine
20. Takayama K, Misawa A, Suzuki T, Takagi K, Hayashizaki Y, Fujimura T, et al. TET2 repression by androgen hormone regulates global
hydroxymethylation status and prostate cancer progression. Nat Commun. 2015;6:8219.
21. Jeschke J, Collignon E, Fuks F. Portraits of TET-mediated DNA
hydroxymethylation in cancer. Curr Opin Genet Dev. 2016;36:16–26.
22. Nickerson L, Im KM, Misner KJ, Tan W, Lou H, Gold B, et al. Somatic
alterations contributing to metastasis of a castration resistant prostate
cancer. Hum Mutat. 2013;34(9):1231–41.
23. Nickerson ML, Das S, Im KM, Turan S, Berndt S, Li H, et al. TET2 binds the
androgen receptor and loss is associated with prostate cancer. Oncogene.
2017;36(15):2172–83.
24. Smeets E, Lynch AG, Prekovic S, Van den Broeck T, Moris L, Helsen C, et al.
The role of TET-mediated DNA hydroxymethylation in prostate cancer. Mol
Cell Endocrinol. 2017.https://doi.org/10.1016/j.mce.2017.08.021.
25. Dhiman VK, Attwood K, Campbell MJ, Smiraglia DJ. Hormone
stimulation of androgen receptor mediates dynamic changes in DNA methylation patterns at regulatory elements. Oncotarget. 2015;6(40):
42575–89.
26. Ko M, Huang Y, Jankowska AM, Pape UJ, Tahiliani M, Bandukwala HS, et al.
Impaired hydroxylation of 5-methylcytosine in myeloid cancers with mutant
TET2. Nature. 2010;468:839–43.
27. Mali P, Esvelt KM, Church GM. Cas9 as a versatile tool for engineering
biology. Nat Methods. 2013;10(10):957–63.
28. Huang Y, Rao A. Connections between TET proteins and aberrant DNA
modification in cancer. Trends Genet. 2014;30(10):464–74.
29. Choudhury AD, Eeles R, Freedland SJ, Isaacs WB, Pomerantz MM, Schalken
JA, et al. The role of genetic markers in the management of prostate
cancer. Eur Urol. 2012;62(4):577–87.
30. Latil A, Chêne L, Cochant-Priollet B, Mangin P, Fournier G, Berthon P, et al.
Quantification of netrins, slits and their receptors in human prostate tumors.
Int J Cancer. 2003;103(3):306–15.
31. Latil A, Bièche I, Chêne L, Laurendeau I, Berthon P, Cussenot O, et al. Gene
expression profiling in clinically localized prostate cancer: a four-gene expression
model predicts clinical behavior. Clin Cancer Res. 2003;9(15):5477–85.
32. Kim CJ, Shimakage M, Kushima R, Mukaisho K, Shinka T, Okada Y, et al.
Down-regulation of drs mRNA in human prostate carcinomas. Hum Pathol.
2003;34(7):654–7.
33. Stamey TA, Warrington JA, Caldwell MC, Chen Z, Fan Z, Mahadevappa M, et
al. Molecular genetic profiling of Gleason grade 4/5 prostate cancers
compared to benign prostatic hyperplasia. J Urol. 2001;166(6):2171–7.
34. Erho N, Buerki C, Triche TJ, Davicioni E, Vergara IA. Transcriptome-wide
detection of differentially expressed coding and non-coding transcripts and
their clinical significance in prostate cancer. J Oncol. 2012.https://doi.org/
10.1155/2012/541353.
35. Yu YP, Landsittel D, Jing L, Nelson J, Ren B, Liu L, et al. Gene expression
alterations in prostate cancer predicting tumor aggression and preceding
development of malignancy. J Clin Oncol. 2004;22:2790–9.
36. Chen JL, Li J, Kiriluk KJ, Rosen AM, Paner GP, Antic T, et al. Deregulation of a
Hox protein regulatory network spanning prostate cancer initiation and
progression. Clin Cancer Res. 2012;18(16):4291–302.
37. Jeong JH, Park SJ, Dickinson SI, Luo JL. A constitutive intrinsic inflammatory
signaling circuit composed of miR-196b, Meis2, PPP3CC, and p65 drives
prostate cancer castration resistance. Mol Cell. 2017;65(1):154–67.
38. Wencheng L, Gu M. NUDT11 rs5945572 polymorphism and prostate cancer
risk: a meta-analysis. Int J Clin Exp Med. 2015;8(3):3474–81.
39. Langmead B, Trapnell C, Pop M, Salzberg SL. Ultrafast and memory-efficient
alignment of short DNA sequences to the human genome. Genome Biol.
2009.https://doi.org/10.1186/gb-2009-10-3-r25.
40. Zhang Y, Liu T, Meyer CA, Eeckhoute J, Johnson DS, Bernstein BE, et al.
Model-based analysis of ChIP-Seq (MACS). Genome Biol. 2008.https://doi.
org/10.1186/gb-2008-9-9-r137.
41. Zhu LJ, Gazin C, Lawson ND, Pagès H, Lin SM, Lapointe DS, et al.
ChIPpeakAnno: a Bioconductor package to annotate ChIP-seq and ChIP-chip
data. BMC Bioinformatics. 2010.https://doi.org/10.1186/1471-2105-11-237.
42. Wang K, Li M, Hakonarson H. ANNOVAR: functional annotation of genetic
variants from high-throughput sequencing data. Nucleic Acids Res. 2010. https://doi.org/10.1093/nar/gkq603.
43. McLean CY, Bristor D, Hiller M, Clarke SL, Schaar BT, Lowe CB, et al. GREAT
improves functional interpretation of cis-regulatory regions. Nat Biotechnol.
2010.https://doi.org/10.1038/nbt.1630.
44. Kron KJ, Liu L, Pethe VV, Demetrashvili N, Nesbitt ME, Trachtenberg J, et al.
DNA methylation of HOXD3 as a marker of prostate cancer progression. Lab
Investig. 2010;90:1060–7.
45. Camp RL, Dolled-Filhart M, Rimm DL. X-tile: a new bioinformatics tool for
biomarker assessment and outcome-based cut-point optimization. Clin