BioMedCentral
Page 1 of 23 (page number not for citation purposes)
Microbial Cell Factories
Open Access
Research
Quantifying the metabolic capabilities of engineered
Zymomonas
mobilis
using linear programming analysis
Ivi C Tsantili
1,2,5, M Nazmul Karim
3and Maria I Klapa*
1,2,4Address: 1Metabolic Engineering and Systems Biology Laboratory, Institute of Chemical Engineering and High-Temperature Chemical Processes, Foundation for Research and Technology-Hellas, GR-26504, Patras, Greece, 2Interdepartmental Graduate Program "Mathematical Modelling in Modern Technologies and Finance", National Technical University of Athens, Zografou Campus, GR-15780, Athens, Greece, 3Department of Chemical Engineering, Texas Tech University, Lubbock, TX 79409, USA, 4Department of Chemical and Biomolecular Engineering, University of Maryland, College Park, MD 20742, USA and 5Present address: Department of Naval Architecture and Marine Engineering, National Technical University of Athens, Zografou Campus, GR-15780, Athens, Greece
Email: Ivi C Tsantili - [email protected]; M Nazmul Karim - [email protected]; Maria I Klapa* - [email protected] * Corresponding author
Abstract
Background: The need for discovery of alternative, renewable, environmentally friendly energy sources and the development of cost-efficient, "clean" methods for their conversion into higher fuels becomes imperative. Ethanol, whose significance as fuel has dramatically increased in the last decade, can be produced from hexoses and pentoses through microbial fermentation. Importantly, plant biomass, if appropriately and effectively decomposed, is a potential inexpensive and highly renewable source of the hexose and pentose mixture. Recently, the engineered (to also catabolize pentoses) anaerobic bacterium
Zymomonas mobilis has been widely discussed among the most promising microorganisms for the microbial production of ethanol fuel. However, Z. mobilis genome having been fully sequenced in 2005, there is still a small number of published studies of its in vivo physiology and limited use of the metabolic engineering experimental and computational toolboxes to understand its metabolic pathway interconnectivity and regulation towards the optimization of its hexose and pentose fermentation into ethanol.
Results: In this paper, we reconstructed the metabolic network of the engineered Z. mobilis to a level that it could be modelled using the metabolic engineering methodologies. We then used linear programming (LP) analysis and identified the Z. mobilis metabolic boundaries with respect to various biological objectives, these boundaries being determined only by Z. mobilis network's stoichiometric connectivity. This study revealed the essential for bacterial growth reactions and elucidated the association between the metabolic pathways, especially regarding main product and byproduct formation. More specifically, the study indicated that ethanol and biomass production depend directly on anaerobic respiration stoichiometry and activity. Thus, enhanced understanding and improved means for analyzing anaerobic respiration and redox potential in vivo are needed to yield further conclusions for potential genetic targets that may lead to optimized Z. mobilis strains.
Conclusion: Applying LP to study the Z. mobilis physiology enabled the identification of the main factors influencing the accomplishment of certain biological objectives due to metabolic network connectivity only. This first-level metabolic analysis model forms the basis for the incorporation of more complex regulatory mechanisms and the formation of more realistic models for the accurate simulation of the in vivo Z. mobilis physiology.
Published: 9 March 2007
Microbial Cell Factories 2007, 6:8 doi:10.1186/1475-2859-6-8
Received: 29 December 2006 Accepted: 9 March 2007
This article is available from: http://www.microbialcellfactories.com/content/6/1/8 © 2007 Tsantili et al; licensee BioMed Central Ltd.
Microbial Cell Factories 2007, 6:8 http://www.microbialcellfactories.com/content/6/1/8
Page 2 of 23 (page number not for citation purposes)
Background
In the highly energy-consuming and earth-polluting era of the early 21st century, the need for discovery of alternative,
renewable, environmentally friendly energy sources and the development of cost-efficient, environmentally clean methods for their conversion into higher fuels becomes more than imperative. Ethanol's significance as fuel has dramatically increased in the last decade [1] due to char-acteristics that render it more effective than gasoline in optimized engines [2], with the additional advantage of contributing less to the green house effect than the con-ventional fuel. Ethanol, among other effective fuels, could be produced from hexoses and pentoses through micro-bial fermentation [3-8]. Importantly, plant biomass, which constitutes one of the main renewable energy sources on earth, could provide a significant and inexpen-sive source of the hexose and pentose mixture, if appropri-ately and effectively depolymerized [2,9-11],. In this context, optimization of the hexose and pentose micro-bial fermentation into ethanol is of great importance. Metabolic engineering (ME) can significantly contribute towards this end with its experimental and computational toolboxes [12-14].
To-date, Saccharomyces cerevisiae [15-17] and Escherichia coli [18-20] have been the main industrial microorgan-isms utilized for ethanol production, with Klebsiella oxy-topa, Pichia stipitis and pastoris [2,19] being studied as potential candidates. Recently, the anaerobic Zymomonas mobilis is being also discussed among the most promising microorganisms for the microbial conversion of hexoses and pentoses into ethanol fuel due to numerous advanta-geous characteristics [17]. Its ethanol yield reaches 98% of the theoretical maximum compared to ~90% of S. cerevi-siae [17]. Z. mobilis is the only to-date identified bacterium that is toxicologically tolerant to high ethanol concentra-tions [2,21], requiring thus less intricate and consequently less expensive downstream processing for the removal of ethanol in industrial chemical plants. Moreover, it has (i) low biomass yield [22], biomass competing with ethanol for the available carbon source(s), (ii) high speed of sub-strate conversion to metabolic products [17], and (iii) comparatively simple glycolytic pathways [21], fact that might prove beneficial for this organism's cell engineering towards the optimization of the ethanol production proc-ess. In addition, any disadvantages of the Z. mobilis use for ethanol production in the food and beverage industry, referring mainly to the formation of byproducts modify-ing food flavor [17], are not applicable in the context of biofuel production. Finally, its wild-type not catabolizing pentose sugars, Z. mobilis engineering [24] resolved the last major obstacle associated with its use for the fermen-tation of plant biomass [25].
Despite, however, the increasing interest in Z. mobilis, the number of reports in current literature studying its in vivo physiology remains small [22,23,26-29]. This implies a rather limited so far use of the metabolic engineering tool-box for the analysis of the microorganism's metabolic pathway interconnectivity and regulation. The recent pub-lication of Z. mobilis full genome [21] is expected to greatly assist the investigations for the identification of potential genetic modification targets towards optimized Z. mobilis strains. In this context, the main objectives of the presented work, discussed sequentially in the follow-ing sections, were (a) to reconstruct the metabolic net-work of the engineered Z. mobilis using the available resources to a level that it could be modeled according to the existing metabolic engineering methodologies, and (b) to use linear programming (LP) analysis – the first level of metabolic modeling towards the simulation of in vivo physiology [30-37] – for the identification of the microorganism's metabolic boundaries with respect to various biological objectives, as these boundaries are determined only by the stoichiometric connectivity of the network.
Results and Discussion
A. Reconstruction of the Z. mobilis Metabolic Network
The reconstruction of an organism's metabolic network used to be mainly based on the existing knowledge about the metabolic network structure of similar cellular sys-tems, along with any available data regarding in vitro/in vivo enzymatic activity and metabolic output measure-ments under various genetic backgrounds or environmen-tal conditions [see e.g. [38]]. In the post-genomic era, the available resources are further augmented by the ever-increasing knowledge about gene annotation based on high-throughput sequencing [e.g. [33,39,40]] and gene expression analyses [41]. While the availability of the genomic data provides a significant advancement in the process of reconstructing the maximum potentially active metabolic network of a biological system, this remains a non-trivial task that requires the direct involvement of an expert's judgment to decide over the sometimes multiple feasible answers to questions that arise during the process [42].
Microbial Cell Factories 2007, 6:8 http://www.microbialcellfactories.com/content/6/1/8
Page 3 of 23 (page number not for citation purposes) catabolism of glucose into pyruvate (reactions 1–11) that
leads to the production of 1 mole of ATP, NADPH and NADH. Xylose isomerase, xylulokinase and the full pen-tose phosphate pathway (PPP) (reactions 12–19) were considered as potentially active to account for the catabo-lism of pentoses by the engineered strain. Because xylitol has been observed as product of an engineered Z. mobilis strain under a particular set of conditions [22], reaction 39 was also included in the reconstructed network.
No α-ketoglutarate dehydrogenase gene has yet been annotated in the Z. mobilis genome, supporting the cur-rent hypothesis that the anaerobic Z. mobilis features an incomplete citric acid cycle (TCA) (reactions 28–33) [22,23]. This is in agreement with prior biological knowl-edge [45], according to which fermenting organisms transform TCA from an oxidative to a reductive pathway. In this case, the two separate parts of the TCA cycle serve in producing the biosynthetic precursors α-ketoglutarate (left branch in Figure 1), oxaloacetate and succinyl-CoA (right branch in Figure 1). The "right" (in figure 1) branch is also connected to the anaerobic respiration, since under anaerobic conditions fumarate could act as electron acceptor and be reduced to succinate through a mem-brane-bound fumarate reductase enzyme (reaction 32) [45]. According to the currently available genomic and metabolic information, the Z. mobilis oxaloacetate pool is replenished by two anaplerotic reactions catalyzed by the
enzymes phosphoenolpyruvate carboxylase (reaction 35) and malate dehydrogenase (reaction 34). Anaerobically growing Z. mobilis can feature a number of fermentation reactions (reactions 20–27). These reactions and their connection with anaerobic respiration are currently con-sidered the determining factor for the Z. mobilis ability to produce ethanol in high yields [17].
Major role in a metabolic network's reconstruction and further modeling plays the selection of the respiration reactions (reactions 41–47). While no clear indication of the activity of the formate dehydrogenase (reaction 40) complex with ubiquinol-cytochrome c reductase (reaction 45) currently exists, reaction 45 was still included in the stoichiometric model [36], formate considered among the potential products of the anaerobic microorganism. An additional assumption, which is not currently backed up by genomic information, is the activity of NAD(P) tran-shydrogenase (it will be referred as trans in the rest of the text) (reaction 47); including this reaction in the stoichio-metric model, NADH and NADPH become equivalent [35]. Finally, the considered amino acid biosynthesis and cumulative biomass formation reactions (reactions 61– 79) were based on the information of Table 1, the latter being populated after appropriately modifying Table 2 in [22]. Among the modifications, methionine biosynthesis, which in [22] was considered as catalyzed by the EC 2.3.1.46 enzyme, was replaced by reaction 71 catalyzed by
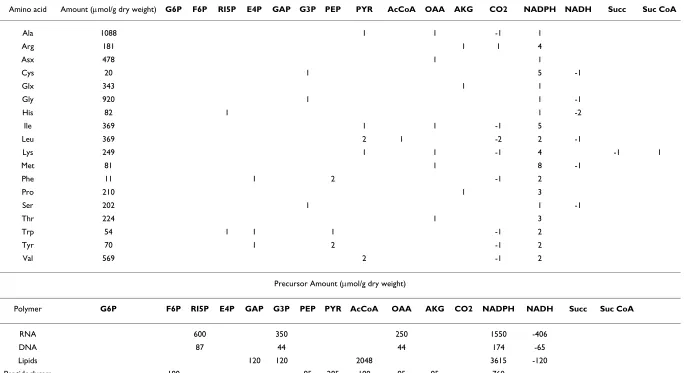
The Z. mobilis reconstructed metabolic network Figure 1
The Z. mobilis reconstructed metabolic network. The numbers next to the reaction arrows refer to the reaction listing in Appendix 1A. Biomass precursors are circled.
GLC XYLOSE GLC XYLOSE G6P 6PG PYR GAP ATP Hexp QH2
NADH NADPH NAD RIBU5P XYLU5P Acetate AcAld F6P NADPH PEP NAD NADH ATP NADH CO2 Acetoin 2K3 D6P ATP ATP CIT aKG CO2 NADPH Suc SucCoA Formate
ATP Hexp QH2
NADPH Anaerobic Respiration NADH NADPH ATP 2 AcCoA Ethanol CIT Formate SED7P Glycerol Ext Glycerol Formate RI5P Formate Ext Acetate Ext Ethanol Ext Acetoin Ext AcAld Ext Lactate Ext 1 2,3 4 5 6,7,8,9 10 11 12,13 14 15 16 17 E4P 18 19 29,30 33 53 35 52 21 54 22 55 24 25 56 57 36,37,38 58 Xylitol 39 59 40 60 42 FADH2 43
46 44 45
47 OAA MAL FUM 28 31 32 34 FAD Xylitol Ext CO2 Lactate 20 23 26, 27
-Biosynthetic precursors are circled
NADH
41 G6P
6PG
PYR
GAP ATP Hexp QH2
NADH NADPH NAD RIBU5P XYLU5P Acetate AcAld F6P NADPH PEP NAD NADH ATP NADH CO2 Acetoin 2K3 D6P ATP ATP CIT aKG CO2 NADPH Suc SucCoA Formate
ATP Hexp QH2
NADPH Anaerobic Respiration NADH NADPH ATP 2 AcCoA Ethanol CIT Formate SED7P Glycerol Ext Glycerol Formate RI5P Formate Ext Acetate Ext Ethanol Ext Acetoin Ext AcAld Ext Lactate Ext 1 2,3 4 5 6,7,8,9 10 11 12,13 14 15 16 17 E4P 18 19 29,30 33 53 35 52 21 54 22 55 24 25 56 57 36,37,38 58 Xylitol 39 59 40 60 42 FADH2 43
46 44 45
47 OAA MAL FUM 28 31 32 34 FAD OAA MAL FUM 28 31 32 34 FAD Xylitol Ext CO2 Lactate 20 23 26, 27 CO2 Lactate 20 23 26, 27
-Biosynthetic precursors are circled
NADH 41
Microbial Cell Factories
200
7,
6
:8
http
://www.mi
cro
bia
lcell
factorie
s.com/conten
t/6/1/8
Pa
ge 4 of
2
3
(page number not for citation purposes)
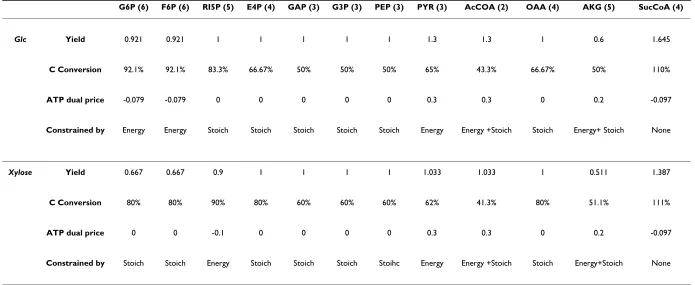
Table 1: Z. mobilis biosynthetic requirements
Precursor Stoichiometry (mol/mol amino acid)
Amino acid Amount (µmol/g dry weight) G6P F6P RI5P E4P GAP G3P PEP PYR AcCoA OAA AKG CO2 NADPH NADH Succ Suc CoA
Ala 1088 1 1 -1 1
Arg 181 1 1 4
Asx 478 1 1
Cys 20 1 5 -1
Glx 343 1 1
Gly 920 1 1 -1
His 82 1 1 -2
Ile 369 1 1 -1 5
Leu 369 2 1 -2 2 -1
Lys 249 1 1 -1 4 -1 1
Met 81 1 8 -1
Phe 11 1 2 -1 2
Pro 210 1 3
Ser 202 1 1 -1
Thr 224 1 3
Trp 54 1 1 1 -1 2
Tyr 70 1 2 -1 2
Val 569 2 -1 2
Precursor Amount (µmol/g dry weight)
Polymer G6P F6P RI5P E4P GAP G3P PEP PYR AcCoA OAA AKG CO2 NADPH NADH Succ Suc CoA
RNA 600 350 250 1550 -406
DNA 87 44 44 174 -65
Lipids 120 120 2048 3615 -120
Peptidoglycam 190 95 285 190 95 95 760
Glycogen 154
C1-Units 49 49 -49
Microbial Cell Factories 2007, 6:8 http://www.microbialcellfactories.com/content/6/1/8
Page 5 of 23 (page number not for citation purposes) the EC 2.3.1.31 enzyme, the latter being identified as
potentially active in Z. mobilis [43]; according to current knowledge, only one of the two enzymes could be poten-tially active in an organism, never both [47].
In summary, the reconstructed metabolic network com-prises 79 reactions and 77 metabolites, among which 19 and 18, respectively, participate solely in the amino acid biosynthesis and cumulative biomass formation reac-tions. The potential reversibility of the reactions was determined based on currently available knowledge pro-vided mainly from metabolic databases [43,44]. Among the metabolites, two (glucose M47 and xylose Ext-M48) were considered as potential substrates, while nine were considered as potential products (Acetaldehyde (AcAld) M51, Succinate (Suc) M52, Ethanol Ext-M53, Lactate Ext-M54, Acetate Ext-M55, Acetoin Ext-M56, Glycerol Ext-M57, Xylitol Ext-M58, Formate Ext-M59), based primarily on data from in vivo experiments [22] (the number of each metabolite refers to its listing in Appendix 1B). In the rest of the text, all metabolites will be referred by their abbreviations shown in Appendix 1B.
B. Linear Programming Analysis
B1. Production of Cofactors
The maximum ATP production (11.667 moles ATP per mole glucose, 9 moles ATP per mole xylose and 10.333 moles ATP per 0.5 mole glucose and 0.5 mole xylose) requires the use of the PPP leading to the production of acetate (see Figure 2). This route is preferred, because it allows for the largest possible, under the particular cir-cumstances, NADH and NADPH production. Specifically, based on the stoichiometry of the respiration reactions, production of 1 mole NADH or NADPH corresponds to production of 1.333 mole ATP. This explains the -1.333 dual price of NADPH or NADH in all three examined sub-strate cases.
In the case that the ATP production rate is imposed to be equal to the ATP consumption rate, maximum NADH or NADPH production (6.5 moles of NADH or NADPH per mole glucose, 4.5 moles NADH or NADPH per mole xylose, 5.5 moles NADH or NADPH per 0.5 mole xylose and 0.5 mole glucose) requires the use of the PPP leading to the production of both acetate and glycerol. Glycerol production, although competing with the objective as it consumes NADH, is part of the solution, because of the "ATP balance equal to zero" constraint and the fact that the stoichiometry of the network provides limited number of metabolic routes for the consumption of ATP. Specifically, the stoichiometry of the network after the GAP node favours only the production of ATP, providing no options for the consumption of the produced ATP. This explanation for the glycerol production is supported by the dual price of ATP, which is equal to 1.5 in all three
examined substrate cases. This indicates that the maxi-mum NADH or NADPH production would have increased by 1.5 mole, should the capability of the net-work to consume ATP have increased by 1 mole. This is indeed the case when no constraint is imposed on the ATP balance. Then, the substrate(s) is(are) fully converted to acetate, while the maximum production of NADH or NADPH is increased by 1.5 mole.
B2. Production of Biosynthetic Precursors
Z. mobilis has 12 biosynthetic precursors, namely the ele-ments G6P, F6P, RI5P, E4P, GAP, G3P, PEP, PYR, AcCoA, OAA, AKG and succinyl-CoA (see Appendix 1B). Z. mobilis capability to produce each one of those is shown in Table 2 (see Materials and Methods for the formulation of the LP problem). Interestingly, no full conversion of glucose or xylose to G6P/F6P or RI5P, respectively, is observed, despite the latter being the immediate product(s) of the former. The microorganism's capability to produce G6P/ F6P or RI5P from glucose or xylose, respectively, is limited by energy requirements. This is true, because conversion of 1 mole of glucose to 1 mole of G6P/F6P or 1 mole of xylose to 1 mole of RI5P is accompanied by the consump-tion of 1 mole ATP. Due to the "ATP balance should be equal to zero" constraint, this ATP consumption imposes the activation of ATP producing routes in addition to the catabolic reaction "Glc → G6P/F6P" or "Xylulose → RI5P". The "equal to zero" constraint on the ATP balance explains also the fact that the PYR (and consequently AcCoA) production is constrained by energy require-ments, while this is not the case for the immediate precur-sors of pyruvate (PYR), GAP and G3P. Finally, the production of AKG, which is accompanied by NADP reduction, is also constrained by energy requirements in both glucose and xylose substrate cases. This is indicated by the ATP and NADPH positive dual prices, when consid-ered that NADPH can be transformed to ATP through the anaerobic respiration.
B3. Ethanol Production
maxi-Microbial Cell Factories
200
7,
6
:8
http
://www.mi
cro
bia
lcell
factorie
s.com/conten
t/6/1/8
Pa
ge 6 of
2
3
(page number not for citation purposes)
Table 2: Maximization of Biosynthetic Precursor Production for glucose or xylose substrate cases.
G6P (6) F6P (6) RI5P (5) E4P (4) GAP (3) G3P (3) PEP (3) PYR (3) AcCOA (2) OAA (4) AKG (5) SucCoA (4)
Glc Yield 0.921 0.921 1 1 1 1 1 1.3 1.3 1 0.6 1.645
C Conversion 92.1% 92.1% 83.3% 66.67% 50% 50% 50% 65% 43.3% 66.67% 50% 110%
ATP dual price -0.079 -0.079 0 0 0 0 0 0.3 0.3 0 0.2 -0.097
Constrained by Energy Energy Stoich Stoich Stoich Stoich Stoich Energy Energy +Stoich Stoich Energy+ Stoich None
Xylose Yield 0.667 0.667 0.9 1 1 1 1 1.033 1.033 1 0.511 1.387
C Conversion 80% 80% 90% 80% 60% 60% 60% 62% 41.3% 80% 51.1% 111%
ATP dual price 0 0 -0.1 0 0 0 0 0.3 0.3 0 0.2 -0.097
Constrained by Stoich Stoich Energy Stoich Stoich Stoich Stoihc Energy Energy +Stoich Stoich Energy+Stoich None
Microbial Cell Factories 2007, 6:8 http://www.microbialcellfactories.com/content/6/1/8
Page 7 of 23 (page number not for citation purposes) mum ethanol yield equal to 0.1667 × 0.5 = 0.0833 mole,
NADPH dual price being equal to -0.1667 with allowable decrease equal to 0.5 mole. Indeed, the maximum ethanol yield increased to 1.5 mole per mole glucose, 1.167 mole per mole xylose and 1.333 mole per 0.5 mole glucose and 0.5 mole xylose, when the NADH consumption rate was allowed to be smaller than its production rate. In these LP problems, the ATP dual price remains positive (+0.5), with allowable increase equal to 1 mole per mole of sub-strate feed, while the optimal flux distribution still com-prises the production of glycerol.
If no constraint is imposed on the ATP balance, the etha-nol yield is equal to the chemically allowed maximum (namely 2 moles per mole glucose, 1.667 mole per mole xylose and 1.833 mole per 0.5 mole glucose and 0.5 mole xylose). The substrate(s) is(are) fully converted to ethanol without the formation of byproducts. The result is identi-cal in the case that the "ATP balance is equal to zero" con-straint is active but the respiration reactions are considered as potentially reversible. This case is equiva-lent to no constraint on the ATP balance as the surplus of the produced ATP is allowed to be transformed to NADH through the anaerobic respiration.
B4. Biomass Production
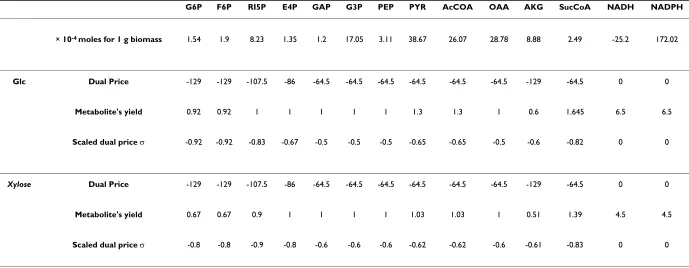
The maximum growth of Z. mobilis was estimated equal to: a) 129 g biomass per mole of glucose, b) 107.5 g bio-mass per mole xylose and c) 118.25 g biobio-mass per 0.5 mole xylose and 0.5 mole glucose(see figure 4). The dual prices of all biosynthetic precursors and NADH/NADPH are shown in Table 3 for the substrate cases of glucose and xylose. It can be observed that despite their coefficients in the biomass equation being relatively small, the dual prices of G6P/F6P or RI5P for glucose or xylose as susb-trate, respectively, are the largest in absolute value. This holds true, because these biosynthetic precursors are the immediate product of the corresponding substrate. Thus, despite their small direct contribution to biomass forma-tion, they are precursors of all the other biosynthetic mol-ecules. The scaled dual prices in Table 3 further support this explanation, providing also information about other major biosynthetic precursors. Specifically, they indicate that when the network achieves maximum growth, the production of G6P/F6P, RI5P and Suc-CoA (in decreasing order of scaled dual prices), when glucose is the only sub-strate, or RI5P, Suc-CoA, G6P/F6P and E4P (the latter two have same scaled dual prices), when xylose is the only substrate, approach their maximum yield (see section B.2).
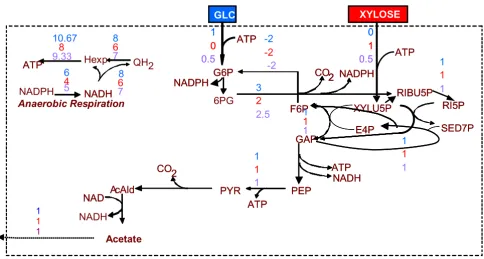
Optimal flux distribution for maximization of the ATP production rate Figure 2
Optimal flux distribution for maximization of the ATP production rate. The flux values next to each reaction arrow refer to the three examined substrate cases (from upper to lower): (a) glucose as single substrate, (b) xylose as single substrate, and (c) 50% of each. Due to the linearity of problem, the solution of the latter case is an interpolation of the first two.
G6P
6PG
PYR
GAP
ATP Hexp
NADH NADPH
NAD
RIBU5P
XYLU5P
AcAld
CO2
F6P
NADPH
PEP
ATP NADH CO2
ATP
ATP NADPH
Anaerobic Respiration
NADPH
ATP
2
Acetate
SED7P
GLC XYLOSE
RI5P 1
0
0.5
-2
-2
-2
0
1
0.5
3
2
2.5
1
1
1
1
1
1 E4P
1.42
1.08
1
1
1
1
1
1
NADH G6P
PYR
GAP Hexp
NADH NADPH
NAD
RIBU5P
XYLU5P
AcAld
CO2
F6P
NADPH
PEP
ATP NADH CO2
ATP
ATP Anaerobic Respiration
NADH
NADPH
ATP
2
SED7P
GLC XYLOSE
RI5P 1
0
0.5
0
1
0.5
E4P
1 1
1
ATP Hexp QH2
NADPH
8
6
7
10.67
8
9.33
6
4
5
NADH 8
6
7
ATP
Microbial Cell Factories 2007, 6:8 http://www.microbialcellfactories.com/content/6/1/8
Page 8 of 23 (page number not for citation purposes)
B.5 Ethanol production under specific biosynthetic requirements
Constraining growth to [0.1 × n]-fold (n ∈ N,1 ≤n ≤ 10) of the maximum biomass yield calculated in section B4, the maximum ethanol yield becomes equal to (1-0.1 × n )-fold of the maximum chemically allowed ethanol yield (see section B3) for any of the three considered substrate cases. For all values of n, the substrate(s) is(are) cat-abolized through the E.D., P.P. and E.M.P pathways, while the respiration uses the transhydrogenase (trans) reaction (r-47). For the particular biosynthetic require-ments and LP constraints, the ATP and NADH/NADPH dual prices are equal to zero and the estimated maximum ethanol yield is constrained only by the stoichiometry of the network.
B.6. Effect of single and double gene deletions on Z. mobilis
metabolic capabilities
Deletion of a gene in the context of the metabolic LP prob-lem is equivalent to the flux of the reaction that is cata-lyzed by the enzyme encoded by the particular gene being equal to zero. Analysis of the effect that single or double gene deletions may have on the theoretical yield and max-imum ethanol production is important for two reasons: a) it provides insight to the degree to which a particular met-abolic reaction or set of two reactions is indeed crucial for cellular growth and/or ethanol production, and b) it enhances the understanding of the metabolic network's connectivity and flexibility to activate alternative routes for the accomplishment of specific biological objectives.
Some of the examined gene deletion LP problems had no feasible solution. In the biological context, these were treated equivalently to the cases in which the optimal value of the objective function was determined equal to zero. For obvious reasons, the deletions of the genes encoding the enzymes that catalyze the catabolic reactions of the two substrates glucose and xylose, r1 and r12-13, respectively, were excluded from this analysis.
B.6.1. Effect of single gene deletions on ethanol yield
In Table 4, the genes are divided into four categories depending on the extent to which the maximum ethanol yield decreases due to each gene's deletion (Figure 5 shows the actual value of the decrease). The four gene cat-egories are subsequently color-coded and depicted in the context of the metabolic network (see Figures 6A–B for glucose and xylose as substrate, respectively), providing thus insight to the importance of each gene's reaction for the network's ethanol producing capability. Studying the solutions of the gene deletion LP problems, the following observations could be made:
1. Deletion of genes whose reactions are part of the ED, EMP and PP pathways lead to the largest changes in etha-nol yield for any of the two utilized substrates. This should be expected, since it is through these pathways that the two substrates are catabolized to PYR and the rest of the products (see section B3). Specifically:
Optimal flux distribution for maximization of the ethanol production rate Figure 3
Microbial Cell Factories
200
7,
6
:8
http
://www.mi
cro
bia
lcell
factorie
s.com/conten
t/6/1/8
Pa
ge 9 of
2
3
(page number not for citation purposes)
Table 3: Biosynthetic precursor scaled dual prices for glucose or xylose as substrates.
G6P F6P RI5P E4P GAP G3P PEP PYR AcCOA OAA AKG SucCoA NADH NADPH
× 10-4 moles for 1 g biomass 1.54 1.9 8.23 1.35 1.2 17.05 3.11 38.67 26.07 28.78 8.88 2.49 -25.2 172.02
Glc Dual Price -129 -129 -107.5 -86 -64.5 -64.5 -64.5 -64.5 -64.5 -64.5 -129 -64.5 0 0
Metabolite's yield 0.92 0.92 1 1 1 1 1 1.3 1.3 1 0.6 1.645 6.5 6.5
Scaled dual price σ -0.92 -0.92 -0.83 -0.67 -0.5 -0.5 -0.5 -0.65 -0.65 -0.5 -0.6 -0.82 0 0
Xylose Dual Price -129 -129 -107.5 -86 -64.5 -64.5 -64.5 -64.5 -64.5 -64.5 -129 -64.5 0 0
Metabolite's yield 0.67 0.67 0.9 1 1 1 1 1.03 1.03 1 0.51 1.39 4.5 4.5
Scaled dual price σ -0.8 -0.8 -0.9 -0.8 -0.6 -0.6 -0.6 -0.62 -0.62 -0.6 -0.61 -0.83 0 0
Microbial Cell Factories 2007, 6:8 http://www.microbialcellfactories.com/content/6/1/8
Page 10 of 23 (page number not for citation purposes) • regarding the ED pathway, when glucose is used as
sub-strate either alone or in combination with xylose, deletion of any gene of the pathway (namely zwf-r2, pgl-r3, edd-r4 or eda-r5) prohibits ethanol production. When xylose is used as substrate, this is true for the deletion of zwf-r2 or pgl-r3. In the case of edd-r4 or eda-r5 deletion, ethanol is produced, but the maximum ethanol yield drops to 10.3% of the maximum for the original network (see sec-tion B3) with the simultaneous producsec-tion of 0.778 mole xylitol per mole of substrate.
• regarding the E.M.P. pathway, deletion of any of its genes (namely gap-r6, pgk-r7, pgm-r8, eno-r9 or pyk-r10) leads to 50% or 65.4% decrease in the maximum capabil-ity for the original network to produce ethanol, when the substrate is glucose or xylose, respectively. In all cases, the cell produces 1 mole of glycerol per mole of substrate, while the ATP and NADPH/NADH dual prices are nega-tive, indicating that the ethanol producing capability of the network is constrained by energy requirements. The
Table 4: Number of single deletions leading to x% decrease in the maximum ethanol or growth yield
x = 0 0 < x < 50 50 ≤ x < 100 x = 100
Ethanol Yield Glucose 22 7 8 7
Xylose 22 2 7 13
Growth Yield Glucose 14 14 0 16
Xylose 17 8 0 19
Both glucose and xylose substrate cases are depicted.
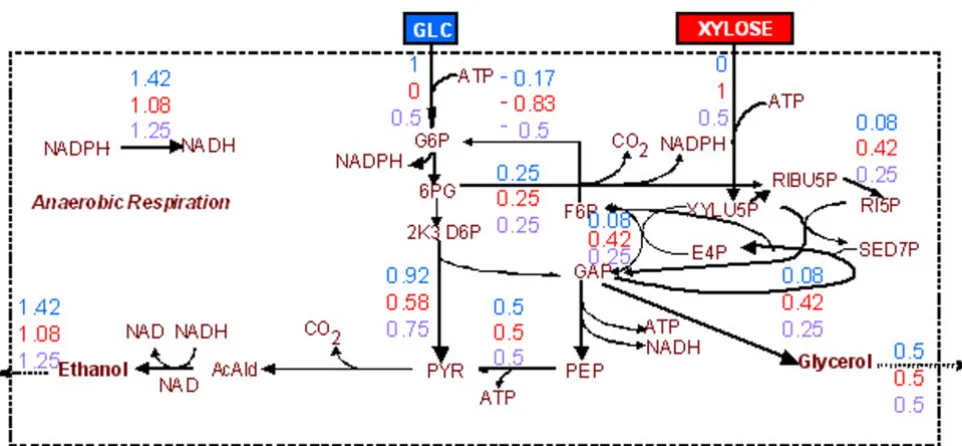
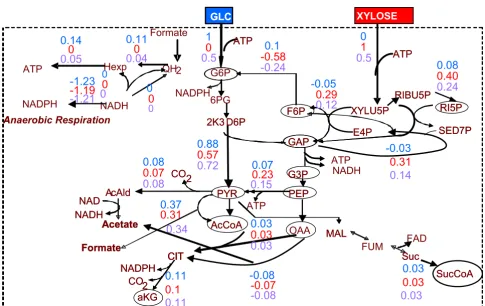
One of the optimal flux distributions corresponding to the maximum growth rate Figure 4
One of the optimal flux distributions corresponding to the maximum growth rate. In the case of glucose substrate, an identified alternative solution involved r40 = depicted value - 0.31 and r22 = depicted value + 0.31; this and the depicted in the figure as active route are equivalent with respect to AcCoA synthesis, thus leading to the same biomass production rate. Depicted flux values are defined as in Figures 2-3.
G6P
6PG
PYR
GAP
ATP Hexp 2
NADPH
NAD
RIBU5P
XYLU5P
Acetate
AcAld
CO2
F6P
PEP
NADH
ATP NADH
OAA 2K3 D6P
ATP
ATP
CIT
aKG CO2 NADPH
Suc
SucCoA
ATP Hexp QH2
NADPH
Anaerobic Respiration
ATP
AcCoA
CIT Formate
SED7P
GLC XYLOSE
RI5P
1
0
0.5
0.07
0.23
0.15
0.1
-0.58
-0.24
0
1
0.5
0.08
0.40
0.24
E4P
-0.03
0.31
0.14
-0.05
0.29
0.12
0.03
0.03
0.03
0.08
0.07
0.08
-0.08
-0.07
-0.08
0.37
0.31
0.34
0
0
0.0
0
0
0.15
0
0.05
-1.25
-1.21
-1.23
NADH0.88
0.57
0.72
G3P
0.11
0.1
0.11
0.11
0
0.04
Formate
MAL
FUM FAD
PYR
GAP
ATP Hexp 2
NADPH
NAD
RIBU5P
XYLU5P
Acetate
AcAld
CO2
F6P
PEP
NADH
2K3 D6P
ATP
CIT
aKG CO2 NADPH
Suc
SucCoA
ATP Hexp QH2
NADPH
Anaerobic Respiration
NADPH
ATP
AcCoA
CIT Formate
SED7P
GLC XYLOSE
RI5P
E4P
0
0
0
0
0
0
0.14
0
0.05
-1.23
-1.19
-1.21
NADH
G3P
0.11
0
0.04
Formate
MAL
0.03
0.03
Microbial Cell Factories 2007, 6:8 http://www.microbialcellfactories.com/content/6/1/8
Page 11 of 23 (page number not for citation purposes) cell is respiring through r47 (trans), r41 (ndh1), r44 (uqr)
and r46 (atpase) reactions.
• regarding the PPP, when glucose is the substrate, dele-tion of any of the PPP genes (namely pria-r15, rpe-r16, tklb-r17 and r19, tal-r18) and/or gnd-r14 or pgi-r11, the latter two reactions connecting the PPP to the E.D. and EMP pathway, respectively, leads to 11.8% decrease in the maximum capability of the network to produce ethanol. In all cases, the NADPH/NADH dual prices are negative (-0.5), indicating that the network could produce more eth-anol should more NADPH or NADH be available. This is true, because the deletion of any of the above mentioned genes results into zero flux for r14, and consequently into production of 1 mole NADPH less than in the original network, while the network produces acetate through r24 (aldh) to satisfy the NADH/NADPH balance constraint. In the case that xylose is used as substrate, deletion of any of the pria-r15, tktlb-r17 and r19, tal-r18 or pgi-r11 pro-hibits ethanol production. Deletion of rpe-r16 or gnd-r14 leads to 19.2% or 15.4%, respectively, decrease in the net-work's ethanol producing capability. In the case of the rpe-r16 deletion, the NADH/NADPH dual price is positive (0.25), indicating that if the network could consume more NADPH or NADH through additional metabolic routes, its ethanol producing capability would be higher. This holds true, because XYLU5P cannot be directly con-verted to RIBU5P, thereby the fluxes through r2 and r14,
and consequently the NADPH production rate through these reactions, increase. The cell is thus forced to produce 0.625 mole glycerol/mole xylose to satisfy the zero ATP balance constraint. To respire, the network uses r44 (uqr), r42 (ndh2) and r47 (trans).
2. In the optimal ethanol-producing flux distribution of the original network (see section B.3), glycerol is the only other product apart from ethanol. This justifies the observed strong impact that deletion of any gene in the glycerol biosynthesis pathway (r36-tpi, r37-gpsA, r38) has on the network's ethanol producing capability. Specifi-cally, in the case of glucose substrate, the network's etha-nol-producing capability decreased to only 11.8% of the original network's, while it was fully prohibited in the other two substrate cases.
3. The deletion of the trans gene (corresponding to reac-tion-47) is observed to prohibit ethanol production, in the case that no biosynthetic requirements are taken into consideration, because r-47 is then the only available NADPH sink.
B.6.2. Effect of single deletions on cell growth
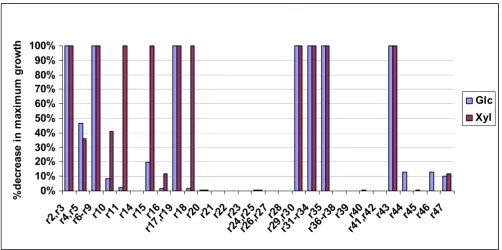
In Table 4, the genes are divided into four categories depending on the extent to which maximum growth is decreased due to each gene's deletion (Figure 7 shows the actual value of the decrease after each gene's deletion). In The % decrease in the maximum ethanol yield after the depicted gene's deletion with respect to the original network's for the glucose and xylose substrate cases
Figure 5
The % decrease in the maximum ethanol yield after the depicted gene's deletion with respect to the original network's for the glucose and xylose substrate cases.
0% 10% 20% 30% 40% 50% 60% 70% 80% 90% 100%
r2,r 3
r4,r 5
r6-r10 r1 1
r14 r15 r16 r1
7-r19 r20,
r21 r22 r23 r2
4-r27 r2
8-r30 r3
1-r33 r34,
r35 r3
6-38 r39 r40 r4
1-r46 r47
%
d
ecr
eas
e i
n
m
axi
m
u
m
eth
an
o
l yi
el
d
Glc
Microbial Cell Factories 2007, 6:8 http://www.microbialcellfactories.com/content/6/1/8
Page 12 of 23 (page number not for citation purposes) Figures 6C–D, the four color-coded gene categories are
depicted in the context of the metabolic network (for glu-cose and xylose as substrate, respectively), providing thus insight to the importance of each gene's reaction for cell growth. The main observations are summarized below:
1. Deletion of any gene whose reaction's products are bio-synthetic precursors is lethal for the cell, if no alternative routes for these compounds' production exist. Indeed, for all examined substrate cases, deletion of any of zwf-r2, pgl-r3, gap-r6, pgk-r7, pgm-r8, eno-r9, aconA-r29, citC-r30, sucD-r33 or ppc-r35 is lethal. In addition, deletion of any gene whose reaction is part of the "right" leg of the TCA cycle, namely fumA-r31, sdhC-r32, yqkJ-r33 or FADH2 dehydrogenase (fadh)-r43 (the latter being directly associated with r32), are considered to be lethal, even though they are not used in the optimal solution (see section B.4). These genes are necessary for the production
of succinate and subsequently of SucCoA, the latter being used for lysine production (r70). The fact that the produc-tion of lysine is accompanied by re-generaproduc-tion of succi-nate explains why r31, r32, r34 and r43 do not carry flux in the optimal solution, the latter corresponding to the physiology of the cell at metabolic steady-state.
2. Deletion of the PPP tklb-(r17 and r19) gene is lethal for the cell in all examined substrate cases. Deletion of the PPP pria-r15 or PPP tal-r18 or pgi-r11, whose reaction connects the PP to the EMP pathway, are lethal only in the case that xylose is the sole substrate. On the contrary, in the case that glucose is the sole substrate, the deletion of these genes causes only 19.4%, 1.5% and 2.5%, respec-tively, decrease in the maximum growth.
3. Deletion of EDP edd-r4 and/or eda-r5 leads to 46.8% or 36.1% decrease in the maximum biomass yield, in the Color-coded metabolic network indicating the impact of each gene's deletion in
Figure 6
Color-coded metabolic network indicating the impact of each gene's deletion in: A. Maximum ethanol yield when glucose is used as sole substrate; B. Maximum ethanol yield when xylose is used as sole substrate; C. Maximum growth when glucose is used as sole substrate; D. Maximum growth when xylose is used as sole substrate. Green, orange, purple and red color indi-cate that the deletion of the particular reaction's corresponding gene causes a x% decrease in the optimal objective value, where x = 0, 0 < x < 50, 50 ≤ x < 100 and x = 100, respectively.
G6P 6PG
PYR
GAP ATP Hexp QH2
NADH NADPH NAD RIBU5P XYLU5P Acetate AcAld CO2 F6P NADPH PEP NAD NADH ATP NADH CO2 OAA 2K3D6P ATP ATP CIT aKG CO2 NADPH MAL FUM Suc SucCoA Formate
ATP Hexp QH2 NADPH Anaerobic Respiration NADH NADPH ATP 2 AcCoA Ethanol CIT Formate SED7P GLC XYLOSE Glycerol Formate RI5P E4P Xylitol FADH2 FAD Lactate Acetoin NADH G6P 6PG PYR GAP ATP Hexp QH2
NADH NADPH NAD RIBU5P XYLU5P Acetate AcAld CO2 F6P NADPH PEP NAD NADH ATP NADH CO2 OAA 2K3D6P ATP ATP CIT aKG CO2 NADPH MAL FUM Suc SucCoA Formate
ATP Hexp QH2 NADPH Anaerobic Respiration NADH NADPH ATP 2 AcCoA Ethanol CIT Formate SED7P GLC XYLOSE Glycerol Formate RI5P E4P Xylitol FADH2 FAD Lactate Acetoin NADH A G6P 6PG PYR GAP ATP Hexp QH2
NADH NADPH NAD Ac NAD RIBU5P XYLU5P etate AcAld 2 F6P NADPH PEP NADH ATP NADH CO2 OAA 2K3D6P ATP ATP CIT aKG CO2 NADPH MAL FUM Suc SucCoA Formate ATP NADPH Anaerobic Respirat NAD
Hexp QH2
ion H NADPH ATP 2 AcCoA Ethanol CIT Formate SED7P GLC XYLOSE Glycerol e RI5P Format E4P Xylitol FADH2 FAD CO LactateAcetoin NADH G6P 6PG PYR GAP ATP Hexp QH2
NADH NADPH NAD Ac NAD RIBU5P XYLU5P etate AcAld 2 F6P NADPH PEP NADH ATP NADH CO2 OAA 2K3D6P ATP ATP CIT aKG CO2 NADPH MAL FUM Suc SucCoA Formate ATP NADPH Anaerobic Respirat NAD
Hexp QH2
ion H NADPH ATP 2 AcCoA Ethanol CIT Formate SED7P B GLC XYLOSE Glycerol e RI5P Format E4P Xylitol FADH2 FAD CO LactateAcetoin NADH G6P 6PG PYR GAP ATP Hexp QH2
NADH NADPH NAD A RIBU5P XYLU5P cetate AcAld CO2 F6P NADPH PEP NAD NADH ATP NADH CO2 OAA 2K3D6P ATP ATP CIT aKG CO2 NADPH MAL FUM Suc SucCoA Formate ATP NADPH Anaerobic Respirat NADH
Hexp QH2
ion NADPH ATP 2 AcCoA Ethanol CIT Formate SED7P GLC XYLOSE Glycerol e RI5P Format E4P Xylitol 2 FAD Lactate Acetoin NADH G6P 6PG GAP ATP Hexp QH2
NADH NADPH NAD A RIBU5P XYLU5P cetate AcAld CO2 F6P NADPH PEP NAD NADH ATP NADH CO2 OAA 2K3D6P ATP ATP CIT aKG CO2 NADPH MAL FUM Suc SucCoA Formate ATP NADPH Anaerobic Respirat NADH
Hexp QH2
ion NADPH ATP 2 AcCoA Ethanol CIT Formate SED7P GLC XYLOSE Glycerol e RI5P Format E4P Xylitol FADH 2 FAD Lactate Acetoin NADH C D G6P 6PG PYR GAP ATP Hexp QH2
NADH NADPH NAD RIBU5P XYLU5P Acetate AcAld CO2 F6P NADPH PEP NAD NADH ATP NADH CO2 OAA 2K3D6P ATP ATP CIT aKG CO2 NADPH MAL FUM Suc SucCoA Formate
ATP Hexp QH2 NADPH Anaerobic Respiration NADH NADPH ATP 2 AcCoA Ethanol CIT Formate SED7P GLC XYLOSE Glycerol Formate RI5P E4P Xylitol FADH2 FAD LactateAcetoin NADH G6P 6PG PYR GAP ATP Hexp QH2
NADH NADPH NAD RIBU5P XYLU5P Acetate AcAld CO2 F6P NADPH PEP NAD NADH ATP NADH CO2 OAA 2K3D6P ATP ATP CIT aKG CO2 NADPH MAL FUM Suc SucCoA Formate
Microbial Cell Factories 2007, 6:8 http://www.microbialcellfactories.com/content/6/1/8
Page 13 of 23 (page number not for citation purposes) case of glucose or xylose, respectively, uptake. Sensitivity
analysis indicates that this decrease is due only to the sto-ichiometric connectivity of the network.
4. The deletion of uqr-r44 and/or atpase-r46 genes in res-piration leads to 12.6% decrease in the maximum bio-mass yield, when glucose is the substrate; it has no impact in the case of xylose substrate, because these two reactions are not used then for cell respiration. Specifically, after these gene deletions in the case of glucose substrate, the cell could respire through multiple equivalent alternative routes, some of which are indicatively discussed here, because they lead to byproduct formation: (i) use of r47(trans) with the simultaneous production of 0.24 mole ethanol; of note, this is the only single gene deletion case, which was observed to lead to ethanol production, (ii) use of r47(trans) with the simultaneous production of 0.24 mole lactate, or (iii) use of r47(trans), r41(ndh1) and r43 (fdhase) with the simultaneous production of 0.2 mole succinate per mole of glucose. Clearly, which of the LP solutions is indeed active in vivo can only be deter-mined through comparison with in vivo Z. mobilis cell cul-ture data.
B.6.3 Effect of double deletions on ethanol yield
In Table 5, the double deletions are divided into four cat-egories depending on the extent to which the maximum ethanol yield is decreased with respect to the original
net-work, for both glucose and xylose substrate cases. Based on the color-code of the single deletions as indicated in Table 4 and Figures 6A–B, Table 5 also shows the single-deletion category of the genes that comprise the double deletions. In the following paragraphs, the double dele-tions that are mainly discussed lead to greater change in the objective function than the single deletions of the involved genes individually:
1. As indicated in B.6.1, in the case that glucose is used as the sole substrate, deletion of any gene in the glycerol bio-synthesis pathway (tpi-r36, gpsA-r37 and r38) decreases the network's ethanol-producing capability to only 11.8% of the original network's. Ethanol production is fully pro-hibited, if these single deletions are combined with either (a) the deletion of the xylitol biosynthesis gene (xyld-r39), which does not cause any change in the network's ethanol producing capability if applied alone, or (b) the deletion of any of the PPP genes (namely pria-r15, rpe-r16, tklb-r17 and r19 and tal-r18) and/or gnd-r14 or pgi-r11, the latter two reactions connecting the PP to the E.D. and EMP pathway, respectively; individual deletion of these genes leads to 11.8% decrease in the maximum eth-anol yield (see B.6.1).
2. In the case of xylose catabolism, the simultaneous dele-tion of gnd-r14, which leads to moderate decrease in the maximum ethanol yield if applied alone (Figure 6), with The % decrease in the maximum biomass yield after the depicted gene's deletion with respect to the original network's for the glucose and xylose substrate cases
Figure 7
The % decrease in the maximum biomass yield after the depicted gene's deletion with respect to the original network's for the glucose and xylose substrate cases.
0% 10% 20% 30% 40% 50% 60% 70% 80% 90% 100%
r2,r 3
r4,r 5
r6-r 9
r10r11r14r15r16 r17,
r19r18r20r21r22r23 r24,
r25 r26,
r27r28 r29,
r30 r3
1-r34r35 r3
6-r38r39r40 r41,r
42 r43r44r45r46r47
%
d
e
c
re
ase
i
n
m
axi
m
u
m
g
ro
w
th
Glc
Microbial Cell Factories 2007, 6:8 http://www.microbialcellfactories.com/content/6/1/8
Page 14 of 23 (page number not for citation purposes) either (a) any of the E.M.P genes (namely gap-r6, pgk-r7,
pgm-r8, eno-r9, pyk-r10), or (b) any of the E.D. genes (namely edd-r4 and eda-r5), all of the above causing sig-nificant decrease in the maximum ethanol yield if applied individually (Figures 5, 6B), or (c) the PPP rpe-r16, which is of moderate effect as single deletion (Figures 5, 6B), prohibits ethanol production. The same holds true for the combination of a E.D. gene deletion with either (a) a E.M.P. gene deletion, or (b) the PPP rpe-r16 deletion, or (c) the xyld-r39 deletion.
3. E.M.P. gene deletion could prohibit ethanol production in the case of xylose substrate, if also combined with the respiration's uqr-r44 and/or atpase-r46 gene deletion, the latter two being of no effect to ethanol yield if applied individually (see Figure 5). In the case of glucose catabo-lism, these double deletions decrease the maximum etha-nol yield to 12% of the original network's, while leading to the simultaneous production of 1 mole xylitol per mole glucose to satisfy the equal to zero ATP balance constraint.
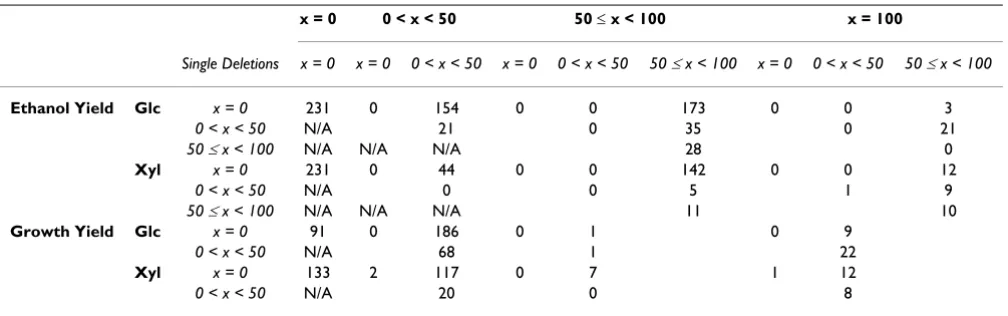
B.6.4. Effect of double deletions on cell growth
In Table 5, the double deletions are divided into four cat-egories depending on the extent to which the maximum growth is decreased with respect to the original network, for both glucose and xylose substrate cases. Based on the color-code of the single deletions as indicated in Table 4 and Figures 6C–D, Table 5 also shows the single-deletion category of the two genes that comprise the double tions. In the following paragraphs, only the double dele-tions that lead to greater change in the objective function than the single deletions of the two involved genes indi-vidually are further discussed:
1. Some combinations of gene deletions are lethal as they destroy the alternative routes that the network possesses to produce a biosynthetic precursor; such cases are:(a) the
combined deletions of glta-r28 with any of aldh-r24 or cite-r25 or dcp-r20 for both substrate cases, as the biosyn-thetic precursor αKG cannot be produced; (b) the simul-taneous deletion of pfl-r40 with (pdhB, pdhC, lpd)-r22 for both substrate cases, as the cell loses the capability to produce the biosynthetic precursor AcCoA, and (c) the combined deletion of tal-r18 and pria-r15, in the case of glucose consumption (in the case of xylose catabolism, the deletion of any of the two genes is by itself lethal), as there is no other route for the production of RI5P.
2. In the case of glucose catabolism, the simultaneous deletion of any of the E.D. genes (namely edd-r4 and eda-r5) with any of the pyk-r10, pgi-r11, gnd-r14, pria-r15, rpe-r16 or tal-r18 is lethal for the cell. In the case of xylose catabolism, this is true if any of the E.D. pathway genes is deleted simultaneously with pyk-r10, gnd-r14 or rpe-r16. Obviously, when the network loses the ability to cat-abolize the substrate through the ED pathway, EMP and PP pathways are indispensable for it to grow. Moreover, the simultaneous deletion of gnd-r14, which connects the E.D with the PP pathway, with either pyk-r10 or rpe-r16 in the case of xylose consumption, or with either tal-r18 or pgi-r11 in the case of glucose consumption, are also lethal for the cell. In the case of glucose catabolism, lethal is also the combined deletion of pgi-r11 with either pria-r15 or tal-r18 or rpe-r16 of the PPP.
3. In the case of glucose catabolism, lethal for the cell is the combined deletion of PPP pria-r15 with xyld-r39 of xylitol biosynthesis. In the case of xylose catabolism, lethal due to the network's specific interconnectivity is the double deletion of pyk-r10 with any of tpi-r36, gpsa-r37 or r38 of the glycerol biosynthesis pathway.
4. Lethal for the cell is also the simultaneous deletion of any of the E.D. genes with any of the respiration
atpase-Table 5: Number of double deletions leading to x% decrease in the maximum ethanol or growth yield
x = 0 0 < x < 50 50 ≤ x < 100 x = 100
Single Deletions x = 0 x = 0 0 < x < 50 x = 0 0 < x < 50 50 ≤ x < 100 x = 0 0 < x < 50 50 ≤ x < 100
Ethanol Yield Glc x = 0 231 0 154 0 0 173 0 0 3
0 < x < 50 N/A 21 0 35 0 21
50 ≤ x < 100 N/A N/A N/A 28 0
Xyl x = 0 231 0 44 0 0 142 0 0 12
0 < x < 50 N/A 0 0 5 1 9
50 ≤ x < 100 N/A N/A N/A 11 10
Growth Yield Glc x = 0 91 0 186 0 1 0 9
0 < x < 50 N/A 68 1 22
Xyl x = 0 133 2 117 0 7 1 12
0 < x < 50 N/A 20 0 8
Microbial Cell Factories 2007, 6:8 http://www.microbialcellfactories.com/content/6/1/8
Page 15 of 23 (page number not for citation purposes) r46, uqr-r44 or trans-r47 genes, in the case of glucose
sub-strate. For the xylose catabolism case, only the combined deletion of any of the E.D. pathway genes with the trans-r47 genes is lethal, whereas with any of the uqr-r44 or atpase-r46 genes it leads to 86% decrease in the maximum cell growth. For all these double deletions in both sub-strate cases, the very high decrease in the objective value originates from the fact that the network loses its capabil-ity to convert the produced NADPH/NADH to ATP, in combination with the already considerable decrease that the single deletion of any of the E.D. genes causes to max-imum growth (see section B.6.2). This justification is sup-ported by the positive NADH/NADPH dual prices in the two non-lethal deletion cases; in the case of the lethal deletions, the corresponding L.P.'s have no feasible solu-tion.
5. The combined deletion of gnd-r14 and trans-r47, the former of no and the latter of moderate effect as single deletions (see Figures 6C–D, 7), leads to 55% and 64% decrease in the maximum biomass yield, in the case of glucose and xylose substrate, respectively. In this case, the network loses two main NADPH-producing reactions (it can only produce NADPH through r2), which explains the negative NADPH dual price (-58) for both substrate cases.
6. In the case of xylose catabolism, the combined deletion of pyk-r10 (of moderate effect as single deletion; see Fig-ures 6D and 7) and ndh1-r41 (of no effect as single dele-tion) leads to 50% decrease in the maximum biomass yield. In this case, the network loses the capability to pro-duce ATP through the EMP pathway. In addition, it has to carry flux through r42(ndh2) instead of r41(ndh1), pro-ducing thus two protons less and increasing consequently the NADH amount that has to be oxidized for the produc-tion of 1 mole ATP. The double deleproduc-tions of pyk-r10 with any of atpase-r46, trans-r47, uqr-r44 in the case of xylose substrate, or with atpase-r46 or uqr-r44 in the case of glu-cose consumption, are lethal, because they decrease even further the ability of the network to produce ATP.
7. The combined deletion of rpe-r16 and uqr-r44 (of moderate and no effect, respectively, as single deletions) in the case of xylose as the sole substrate results in 58% decrease in the maximum biomass yield. In addition, the cell has to produce 0.53 mole of xylitol per mole sub-strate, due to the decrease in the flexibility of the network to consume NADH/NADPH, as indicated from the sensi-tivity analysis.
8. When xylose is the sole substrate, the simultaneous deletion of trans-r47 and PPP rpe-r16, the latter being of moderate effect on the optimal objective value as single deletions, is lethal as the cell can not produce the required amount of NADPH for the synthesis of biomass
precur-sors. In fact, carrying out the same LP allowing for the NADPH consumption rate to be smaller than its produc-tion rate, the maximum biomass yield was 88% of the original network's with NADPH net excretion rate being equal to 0.003 mole per mole of xylose.
9. For the glucose substrate case, the maximum growth rate decreases by 51% after the simultaneous deletion of trans-r47 and rpe-r16. In this case the ATP/NADH dual prices are equal to zero, whereas this of NADPH is nega-tive and equal to -62.12. In this case, the cell has to oxidize the NADH surplus that cannot convert to NADPH through r47 by producing ethanol and/or other by-prod-ucts in various feasible ratios that are observed as alterna-tive solutions of the L.P. According to these, the cell could potentially produce up to 1 mole ethanol (in this case no other by-product is synthesized). This is a significant result in the context of the analysis for the identification of the most suitable targets for genetic modification towards optimization of ethanol production. It needs fur-ther validation through comparison with in vivo physio-logical data. Ethanol production, although small, is also part of the optimal solution(s), in the case of the simulta-neous deletion of rpe-r16 with uqr-r44 or atpase-r46, when glucose is the sole substrate; as one of the multiple optimal solutions, the cell could produce 0.09 or 0.16 mole ethanol per mole glucose, respectively, while the maximum biomass yield of the network is decreased only by 12.7% of the original's. These results are among the sig-nificant indications of the strong relationship between ethanol production and anaerobic respiration.
Conclusion
Microbial Cell Factories 2007, 6:8 http://www.microbialcellfactories.com/content/6/1/8
Page 16 of 23 (page number not for citation purposes) maximization of growth could be potentially
accompa-nied by ethanol production, sometimes in considerable amount; it was observed that these cases involve the dele-tion of genes that catalyze reacdele-tions of the anaerobic res-piration. In general, the results of this study indicated that ethanol and biomass production depend directly on the anaerobic respiration's stoichiometry and activity; thus enhanced understanding and improved means for analyz-ing anaerobic respiration and redox potential in vivo are needed to yield further conclusions for potential genetic targets that may lead to optimized Z. mobilis strains. This has indeed been the case in the context of ethanol produc-tion from the engineered, to ferment xylose, S. cerevisiae [4,15,48]. Taking into consideration that LP is the first level of metabolic network modeling based on stoichio-metric connectivity only, the results of the presented study provide significant insight towards the design of experi-ments, whose data, combined and compared with the simulations, could enhance our understanding of the in vivo Z. mobilis ethanol production regulation.
Materials and methods
L. P. Model of Z. mobilisA short general description of the LP analysis of metabolic networks is provided in Appendix 1C. Based on this defi-nition, the LP problems addressed in this study were defined as follows.
A. Maximization of a metabolite's production rate (biosynthetic requirements are excluded)
The stoichiometric model on which this analysis is based comprises reactions 1–60 in Appendix 1A, involving 60 net fluxes and 59 metabolites. The LP problem to be solved is the following (all reaction and metabolite num-bers refer to their listing in Appendices 1A and 1B, respec-tively):
Maximize
subject to:
(1a)
(1c)
(1d)
(1f)
(1g)
(vj = 0 in the case that the gene which encodes the enzyme that catalyzes reaction j is deleted)
where:
ZA the objective function
k the Appendix 1B number of metabolite whose produc-tion rate is to be optimized
the net excretion rate of the i-th metabolite
the 59(|# of metabolites) × 60(# of reactions)
stoichio-metric matrix of the metabolic network (in this case, each reaction is represented by the stoichiometry of the direc-tion in which it is depicted in Appendix 1A, i.e. this has been selected as the default direction of its net flux)
the 60 × 1 metabolic net flux vector (see comment
above about the default direction of a reaction's net flux – if the LP optimal solution corresponds to a negative value for the j-th net flux, this indicates that its direction is opposite than the default)
(1α) Metabolite balance constraints
(1b) The non-negative constraint on the net fluxes of the irreversible reactions
(1c), (1d) The three examined substrate cases were: a = 1 and b = 0, a = 0 and b = 1, a = 0.5 and b = 0.5. Due to the linearity of problem, the solution of the latter case is an interpolation of the first two. Similarly, for any values of a and b, the solution of the problem will be the weighted interpolation of the solutions of the first two cases (i.e. glucose or xylose, as sole substrates).
(1e) Regarding the net excretion rate of ATP, two cases
were examined: (a) , and (b) no
con-straint on the ATP net excretion rate was imposed. ZA =rkoutput−rkinput
Sv=routput−rinput
v
j
j=
≥ = − − −
− − − −
0 1 4 10 12 14 20 24 26 28 35 39 42 44 46 48 49 51 60
, , , , , , ,
, , ,
∈ ∈
( )
R otherwise
b 1
r47output−r47input = −a, a∈R+
r48output−r48input = −b, b∈R+
r49output−r49input =0or∈R
( )
1er50output−r50input ∈R
rqoutput−rqinput ∈R+ for q=51 59−
rqoutput−rqinput =0 for q= −1 46
( )
1hrioutput−riinput
S
v
Microbial Cell Factories 2007, 6:8 http://www.microbialcellfactories.com/content/6/1/8
Page 17 of 23 (page number not for citation purposes) (1f) No constraint was imposed on the CO2 net excretion
rate.
(1g) The net excretion rates of all potential products are considered as nonnegative
(1h) The net excretion rates of all intracellular metabolites are considered equal to 0
B. Maximization of cellular growth rate
The stoichiometric model on which this analysis is based comprises reactions 1–79 in Appendix 1A, involving 79 net fluxes and 77 metabolites. The LP problem to be solved is the following:
Maximize Zb = v79
subject to:
(2a)
(2b)
(2c)
(2d)
(2e)
(2f)
(2g)
(2h)
where:
the 77(|# of metabolites) × 79(# of reactions)
stoichio-metric matrix of the metabolic network
All other symbols are defined as in the L.P. described in section A [L.P. (1)].
Constraints (2a)-(2d), (2f)-(2h) are defined as in L.P (1). Constraint (2e) describes the assumption that the ATP
produced from the network is at least as much as the ATP consumed.
C. Maximization of a metabolite's production rate taking into consideration the biosynthetic requirements
The stoichiometric model is the same as in section B [LP(2)]. The L.P. problem to be solved is the following:
Maximize
subject to:
(3a)
(3b)
(3c)
(3d)
(3e)
(3f)
(3g)
(3h)
v79 = β(max ZB) 0 < β < 1 (3i)
(vj = 0 in the case that the gene which encodes for the enzyme that catalyzes reaction j is deleted)
All symbols are defined as in section B. Constraints (3a)-(3h) are the same as in LP(2). Constraint (3i) describes the case in which the growth rate is constrained to be equal to a fraction β of the theoretical maximum (i.e. the solution of LP(2)).
All LP problems of this study were solved using the Solver tool of Microsoft Excel (Microsoft Office 2003).
• The dual price of metabolite i represents the change in the optimal value of the cellular objective function due to the by 1 unit increase in the net excretion rate of metabo-lite i [36,37,49-51];
Sv=routput−rinput
v
j
j =
≥ = − − −
− − − −
0 1 4 10 12 14 20 24 26 28 35 39 42 44 46 48 49 51 79
, , , , , , ,
, , ,
∈ ∈
R otherwise
r47output−r47input = −a, a∈R+
r48output−r48input = −b, b∈R+
r49output−r49input ∈R+
r50output−r50input ∈R
rqoutput−rqinput ∈R+ for q=51 59−
rqoutput−rqinput =0 for q= −1 46 60 77, −
S
Zc =rkoutput−rkinput
Sv=routput−rinput
v
j
j =
≥ = − − −
− − − −
0 1 4 10 12 14 20 24 26 28 35 39 42 44 46 48 49 51 79
, , , , , , ,
, , ,
∈ ∈
R otherwise
r47output−r47input = −a, a∈R+
r48output−r48input = −b, b∈R+
r49output−r49input ∈R+
r50output−r50input ∈R
rqoutput−rqinput ∈R+ for q=51 59−
Microbial Cell Factories 2007, 6:8 http://www.microbialcellfactories.com/content/6/1/8
Page 18 of 23 (page number not for citation purposes) • When the capability of the network to produce any of
the biosynthetic precursors is being determined, the C conversion for each precursor is also estimated. C conver-sion is defined as follows [36]:
and
represents the capability to convert the C atoms of the substrate to the C atoms of the desired precursor.
• C conversion in combination with the ATP dual price indicates whether stoichoiometry or energy requirements limit the full conversion of the substrate into any of the precursors [36]. In the case that the ATP dual price is zero and the C conversion is smaller than 100%, it is con-cluded that a higher precursor yield is constrained only by the stoichiometry of the network. In the case that the ATP dual price is negative then a higher precursor yield is con-strained by the energy requirements. In the case that the ATP dual price is positive, then a higher precursor yield is constrained by the fact that the network lacks flexibility to consume the ATP surplus. If C conversion remains smaller than 100% even in the case that the ATP balance con-straint is not taken into consideration in the LP problem, then for a nonzero ATP dual price a higher precursor yield is constrained also by the stoichiometry of the network.
• The dual price of a precursor cannot indicate if this pre-cursor is indeed among the most significant for growth, because the dual price might be related with other needs of the cell. In this case, the indicator is the scaled dual price σ of biomass precursors and of NADPH/NADH, which is estimated as follows [37]:
where:
the maximum yield of the precursor (solution
of the corresponding L.P.(1))
the dual price of the precursor in the solution of the
L.P for the maximization of the cellular growth rate [L.P.(2)].
the maximum cellular growth rate, i.e. the
solution of [L.P.(2)]
The closer to unity a dual price σ is the closer to its maxi-mum yield is the metabolite produced when the cell aims at achieving maximum growth.
Authors' contributions
ICT reconstructed along with MIK the metabolic network, applied LP analysis for all examined cases and drafted the manuscript. MNK provided his valuable expertise in the in vivo physiology of Z. mobilis cell cultures along with his knowledge in ethanol production from plant biomass. MIK conceptualized the described work, participated in the reconstruction of the metabolic network, supervised the application of LP analysis by ICT, coordinated the work of all authors towards completion, helped signifi-cantly in drafting and finalized the manuscript. All authors have read and accepted the manuscript.
Appendix 1A
The reconstructed metabolic network of the engineered Z. mobilis (C25). All network reactions are depicted in the following format: [Reaction Number]. [Reaction For-mula]. [(I) or (R), I: if the reaction is considered irreversi-ble or reversiirreversi-ble, respectively]. [EC Number of the enzyme that catalyzes the particular reaction]. [Name of the gene that encodes the enzyme that catalyzes the particular reac-tion]. [Main literature source from which the provided information has been recovered: 1:[43],2:[22], 3:[21]. All stoichiometric coefficients refer to mole requirements; only the coefficient of biomass refers to mass (g) require-ments.
Entner-Doudoroff (E.D) pathway
1. Glc + ATP → G6P + ADP (I) E.C: 2.7.1.2 (glc) (1)
2. G6P + NADP → glucono1,5lactone6P + NADPH (I) E.C:1.1.1.49 (zwf) (1)
3. Glucono1,5lactone6P + H2O → 6PG (I) E.C:3.1.1.31 (pgl) (1)
4. 6PG → 2K3D6P + H2O (I)E.C:4.2.1.12 (edd) (1)
5. 2K3D6P → PYR + GAP (R) E.C:4.1.2.14 (eda) (1)
Part of Embden-Meyerhof-Parnas pathway (E.M.P) 6.GAP+ NAD+ → 1,3BPG+ NADH (R) E.C:1.2.1.12 (gap)
(1)
7. 1,3BPG+ADP → G3P+ATP (R) EC: 2.7.2.3 (pgk) (1)
8. G3P → 2PG (R) E.C:5.4.2.1 (pgm) (1)
9. 2PG → PEP+ H2O (R) E.C:4.2.1.11 (eno) (1)
10. PEP + ADP → PYR + ATP (I) E.C:2.7.1.40 (pyk) (1) Cconversion (#)C atoms of the precursor
(#)C atoms of the s
=
u
ubstrate ×yield
σ =
× ∂∂
M substrate
X M X
substrate .
M substrate
∂ ∂
X M