R E S E A R C H A R T I C L E
Open Access
Repeat HIV-testing is associated with an
increase in behavioral risk among men who
have sex with men: a cohort study
Martin Hoenigl
1,2,3*, Christy M. Anderson
1, Nella Green
1, Sanjay R. Mehta
1,4, Davey M. Smith
1,4and Susan J. Little
1*Abstract
Background:The Center for Disease Control and Prevention recommends that high-risk groups, like sexually active men who have sex with men (MSM), receive HIV testing and counseling at least annually. The objective of this study was to investigate the relationship between voluntary repeat HIV testing and sexual risk behavior in MSM receiving rapid serologic and nucleic acid amplification testing.
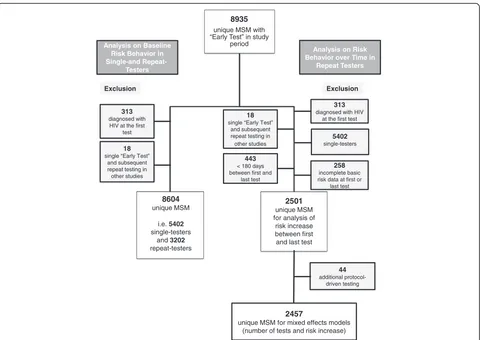
Methods:We performed a cohort study to analyze reported risk behavior among MSM receiving the“Early Test”, a community-based, confidential acute and early HIV infection screening program in San Diego, California, between April 2008 and July 2014. The study included 8,935 MSM receiving 17,333“Early Tests”. A previously published risk behavior score for HIV acquisition in MSM (i.e. Menza score) was chosen as an outcome to assess associations between risk behaviors and number of repeated tests.
Results:At baseline, repeat-testers (n = 3,202) reported more male partners and more condomless receptive anal intercourse (CRAI) when compared to single-testers (n = 5,405, allP<0.001). In 2,457 repeat testers there was a strong association observed between repeated HIV tests obtained and increased risk behavior, with number of male partners, CRAI with high risk persons, non-injection stimulant drug use, and sexually transmitted infections all increasing between the first and last test. There was also a linear increase of risk (i.e. high Menza scores) with number of tests up to the 17th test. In the multivariable mixed effects model, more HIV tests (OR = 1.18 for each doubling of the number of tests,P<0.001) and younger age (OR = 0.95 per 5-year increase,P= 0.006) had significant associations with high Menza scores.
Conclusions:This study found that the highest risk individuals for acquiring HIV (e.g. candidates for antiretroviral pre-exposure prophylaxis) can be identified by their testing patterns. Future studies should delineate causation versus association to improve prevention messages delivered to repeat testers during HIV testing and counseling sessions.
Keywords:Acute and early HIV, MSM, Risk behavior, NAT screening, Repeat testing
Background
Men who have sex with men (MSM) bear the greatest burden of HIV infection in California and the United
States [1–5]. The Center for Disease Control and
Prevention recommends that high-risk groups, like sexu-ally active MSM, receive HIV testing and counseling at
least annually [6]. To address this recommendation, community-based, confidential HIV screening programs that include screening for acute HIV (i.e. detect HIV
antigen in antibody negative persons), like the “Early
Test” in San Diego, California [7], have been
imple-mented in many US metropolitan areas. Higher rates of repeat testing and counseling have been reported in persons with more behavioral risks for HIV acquisition
[8–10], though most of these studies were conducted
either in resource limited settings or more than 10 years ago (i.e. before the era of rapid HIV antibody or acute
HIV infection screening) [11–13].
* Correspondence:[email protected];[email protected]
Original data of this manuscript have been presented in part at CROI 2015 in Seattle, USA (Poster Control IDs 2086188 and 2082732).
1AntiViral Research Center, Division of Infectious Diseases, Department of Medicine, University of California, San Diego, 200 West Arbor Drive #8208, San Diego, CA 92103, USA
Full list of author information is available at the end of the article
HIV testing and counseling typically includes an as-sessment of recent behavioral risks, pre-test counseling (in some settings), and rapid provision of HIV test re-sults. Detection of HIV infection is often associated with at least transiently reduced risk behaviors and thus a decreased risk of HIV transmission [14, 15]. When test results are negative, however, the client could in-terpret this as positive reinforcement that ongoing risk behaviors are not sufficiently risky to result in HIV infection [16]. In other words, reported risk be-haviors without significant consequences may foster greater risk in the future [17]. Thus, repeated nega-tive HIV test results over time may provide an unin-tentionally reassuring message that may ultimately contribute to higher HIV-acquisition rates among re-peat testers. In particular, acute infection screening (i.e. nucleic acid amplification testing) provides HIV status information related to very recent risk behav-iors as well as greater certainty about a negative HIV test result [18]. We investigated the relationship be-tween voluntary repeat HIV testing and sexual risk behavior in MSM receiving rapid serologic testing and nucleic-acid testing (NAT).
Methods
In this retrospective analysis of a prospective cohort study, we analyzed risk behavior reported for the
previ-ous 12 months in individuals who enrolled in the“Early
Test” HIV screening program between April 2008 and
July 2014. The “Early Test” [19] is a community-based,
voluntary, confidential acute and early HIV infection (AEH) screening program that provides point of care rapid HIV serologic testing followed by routine reflex to individual donation HIV NAT (NAT results are provided in a second visit or, if negative, also with automated voice mail or online) in all antibody-negative persons
[7, 20, 21]. With the “Early Test” program
approxi-mately 4000 individuals per month are screened free of charge at five regular plus additional mobile testing sites (including sites targeting MSM at the Lesbian, Gay,
Bisexual, Transgender Center and the Gay Men’s Health
Clinic; the San Diego County Health Department; the AntiViral Research Center (AVRC); substance abuse treatment centers; and special community event venues) in San Diego, United States. Similar to other settings in the United States, MSM bear by far the greatest burden
of HIV infection in San Diego, as reflected in the “Early
Test”, where 72 % of tests overall, 85 % of repeat testing
encounters, and 88 % of HIV diagnoses are made to
MSM. Since the “Early Test” does not routinely keep
track of individuals who repeatedly test over time, tests were considered linked to the same individual if the birth date and soundex of last-name and first-name matched.
Pre-test counseling was provided at each Early Test visit throughout the study period and utilized a client-centered harm reduction model offering personalized risk reduction options. Risk behavior was collected by using a risk assessment form with 19 detailed survey questions (focusing primarily on sexual risk behavior, substance use, sexually transmitted infection (STI)
diagnoses –all reported for the prior 12 months –and
demographics). Survey questions were assessed and the form filled out by the testing staff before each HIV test-ing encounter, and data was later entered into the data system (always in duplicate to minimize data entry errors). After testing, clients were recommended to come back 6 months later for the next testing encounter. Males and female-to-male transsexual persons who re-ported sexual contact with one or more male partners during the previous 12 months were included in the analysis. We excluded (1) those who were diagnosed with HIV (irrespective of HIV stage) at the first test since these participants did not have the opportunity to become repeat testers, and (2) those with only one
“Early Test” who had repeat tests required as part of
their participation in another study (Fig. 1). AEH was characterized using previously published criteria for serologic and virologic test results [22]. We evaluated the predictive potential (for AEH versus HIV negatives) of a previously published risk behavior score for HIV ac-quisition in MSM repeat testers [23] as an outcome measure to assess changes in risk behavior. The shorter version of this score (i.e. the Menza score), included four variables: diagnosis or history of STI, use of metham-phetamine or inhaled nitrites (i.e. poppers) in the prior 6 months, 10 or more male sex partners in the prior year, and unprotected anal intercourse with someone who is HIV positive in the prior year [23]. Two modi-fications were necessary for our study: (1) diagnosis or history of STI was modified to self-reported diagnosis of STI within the last 12 months, and (2) time period of methamphetamine or inhaled nitrite use was in-creased to last 12 months (as we did not have data available for last 6 months). Performance of the Menza score in our cohort was evaluated using receiver oper-ating characteristics (ROC) analysis and area under the curve (AUC) value, including 95 % confidence interval (CI) displayed.
Our main analyses focused on: (1) baseline risk behav-ior in single- and repeat- testers, and (2) risk behavbehav-ior over time in repeat testers.
Baseline risk behavior in single and repeat testers
testers, we compared the baseline risk-taking behaviors
in the 12 months prior to testing using χ2 and Mann
Whitney U test. To identify baseline characteristics
that were associated with repeat testing, we used Cox proportional-hazards regression, modeling the time from initial test to (1) second test for repeat testers or (2) end of follow-up period for single testers. Univariate
analyses were performed, and variables with P <0.20
were included in the multivariable model. Variables in the final model were selected with a forward stepwise procedure. Hazard ratios (HR) including 95 % CI were displayed.
Risk behavior at first and last test in repeat testers
For the comparison of risk behavior reported at the first and last test in repeat testers, those with incomplete basic risk data at their first or last test (i.e. number of male partners, STI and drug use), and those who had their first and last test less than 180 days apart were additionally excluded (as analysis focused on risk behav-ior reported for the prbehav-ior 12 months, Fig. 1). Analyses of changes in risk behaviors between the first and the most
recent “Early Test” used the McNemar test and
Wil-coxon signed rank test.
Risk behavior and number of tests in repeat testers
Further, individuals with repeat “Early Test” visits who
received additional protocol-driven interval tests as part of co-enrollment in another study (n = 44) were ex-cluded from the analyses to evaluate risk behavior over time in repeat testers (Fig. 1). Analyses of changes in risk
behaviors between the first and the most recent “Early
Test” was performed separately for those with 2 to 3, 4
to 5, and 6 or more tests as described above.
Risk behavior at each Early Test visit was further char-acterized with the previously published Menza score [23]. Since scores clustered around awarded points based on four specific risk behaviors (i.e. weighted scores for risk behavior vary between 1 and 11), and therefore did not follow a discrete-count distribution, we dichoto-mized scores based on the median: high risk (above the
mean of individuals’ median scores) or low risk (below
the mean). At each time point, the cumulative number of HIV tests was used as the primary predictor and the 8935
unique MSM with “Early Test” in study
period
8604 unique MSM
i.e. 5402
single-testers and 3202
repeat-testers
Analysis on Baseline Risk Behavior in Single-and
Repeat-Testers
Analysis on Risk Behavior over Time in
Repeat Testers
313 diagnosed with
HIV at the first test Exclusion
18 single “Early Test”
and subsequent repeat testing in other studies
313 diagnosed with HIV
at the first test Exclusion
5402 single-testers
258 incomplete basic risk data at first or
last test
2501 unique MSM for analysis of risk increase between first and last test
44 additional
protocol-driven testing
2457
unique MSM for mixed effects models (number of tests and risk increase)
18 single “Early Test”
and subsequent repeat testing in other studies
443 < 180 days between first and
last test
effect of the number of tests was investigated while con-trolling for follow-up time and age. Percentage of high (i.e. above the mean) HIV behavioral risk scores by num-ber of HIV tests was calculated for repeat testers using local regression (Loess), a smoothing technique that al-lows one to see a pattern without assuming a particular distribution. Visual and Loess fitting suggested that there
was a linear relationship between the number of HIV tests and the risk-behavior score up to approximately the 17th test. As subsequent tests (from 18th test on-ward) did not correspond to the same increase in higher scores, numbers of tests were log-transformed to achieve a linear relationship between number of tests and the logit of high-risk scores.
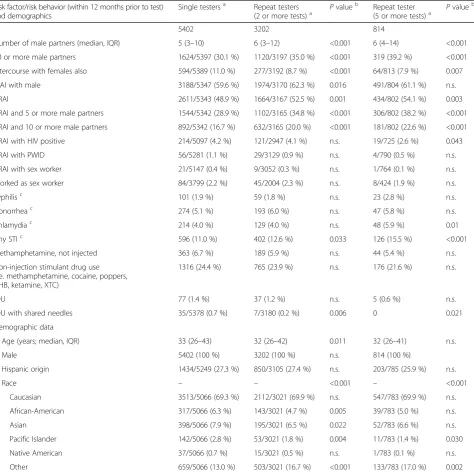
Table 1Comparison demographics and risk behavior at baseline. Reported by individuals with a single HIV test during the study period versus those with repeated HIV tests (those with two or more tests, and the subpopulation with five or more tests)
Risk factor/risk behavior (within 12 months prior to test) and demographics
Single testersa Repeat testers
(2 or more tests)a Pvalue b
Repeat tester
(5 or more tests)a Pvalue b
N 5402 3202 814
Number of male partners (median, IQR) 5 (3–10) 6 (3–12) <0.001 6 (4–14) <0.001
10 or more male partners 1624/5397 (30.1 %) 1120/3197 (35.0 %) <0.001 319 (39.2 %) <0.001 Intercourse with females also 594/5389 (11.0 %) 277/3192 (8.7 %) <0.001 64/813 (7.9 %) 0.007
CIAI with male 3188/5347 (59.6 %) 1974/3170 (62.3 %) 0.016 491/804 (61.1 %) n.s.
CRAI 2611/5343 (48.9 %) 1664/3167 (52.5 %) 0.001 434/802 (54.1 %) 0.003
CRAI and 5 or more male partners 1544/5342 (28.9 %) 1102/3165 (34.8 %) <0.001 306/802 (38.2 %) <0.001 CRAI and 10 or more male partners 892/5342 (16.7 %) 632/3165 (20.0 %) <0.001 181/802 (22.6 %) <0.001
CRAI with HIV positive 214/5097 (4.2 %) 121/2947 (4.1 %) n.s. 19/725 (2.6 %) 0.043
CRAI with PWID 56/5281 (1.1 %) 29/3129 (0.9 %) n.s. 4/790 (0.5 %) n.s.
CRAI with sex worker 21/5147 (0.4 %) 9/3052 (0.3 %) n.s. 1/764 (0.1 %) n.s.
Worked as sex worker 84/3799 (2.2 %) 45/2004 (2.3 %) n.s. 8/424 (1.9 %) n.s.
Syphilisc 101 (1.9 %) 59 (1.8 %) n.s. 23 (2.8 %) n.s.
Gonorrheac 274 (5.1 %) 193 (6.0 %) n.s. 47 (5.8 %) n.s.
Chlamydiac 214 (4.0 %) 129 (4.0 %) n.s. 48 (5.9 %) 0.01
Any STIc 596 (11.0 %) 402 (12.6 %) 0.033 126 (15.5 %) <0.001
Methamphetamine, not injected 363 (6.7 %) 189 (5.9 %) n.s. 44 (5.4 %) n.s.
Non-injection stimulant drug use (i.e. methamphetamine, cocaine, poppers, GHB, ketamine, XTC)
1316 (24.4 %) 765 (23.9 %) n.s. 176 (21.6 %) n.s.
IDU 77 (1.4 %) 37 (1.2 %) n.s. 5 (0.6 %) n.s.
IDU with shared needles 35/5378 (0.7 %) 7/3180 (0.2 %) 0.006 0 0.021
Demographic data
Age (years; median, IQR) 33 (26–43) 32 (26–42) 0.011 32 (26–41) n.s.
Male 5402 (100 %) 3202 (100 %) n.s. 814 (100 %)
Hispanic origin 1434/5249 (27.3 %) 850/3105 (27.4 %) n.s. 203/785 (25.9 %) n.s.
Race – – <0.001 – <0.001
Caucasian 3513/5066 (69.3 %) 2112/3021 (69.9 %) n.s. 547/783 (69.9 %) n.s.
African-American 317/5066 (6.3 %) 143/3021 (4.7 %) 0.005 39/783 (5.0 %) n.s.
Asian 398/5066 (7.9 %) 195/3021 (6.5 %) 0.022 52/783 (6.6 %) n.s.
Pacific Islander 142/5066 (2.8 %) 53/3021 (1.8 %) 0.004 11/783 (1.4 %) 0.030
Native American 37/5066 (0.7 %) 15/3021 (0.5 %) n.s. 1/783 (0.1 %) n.s.
Other 659/5066 (13.0 %) 503/3021 (16.7 %) <0.001 133/783 (17.0 %) 0.002
CIAI, Condomless insertive anal intercourse; CRAI, Condomless receptive anal intercourse; GHB, Gamma hydroxybutyrate; IDU, Injection drug use; IQR, Inter-quartile range; MSM, Men who have sex with men; n.s., Not significant; PWID, Person who injects drugs; STI, Sexually transmitted infection; XTC, Ecstasy
a
Data available from all individuals if denominator not depicted
b
Calculated usingχ2
or Mann–WhitneyU-test
c
Univariable and multivariable mixed-effects logistic re-gression models were performed for number of tests, time since first HIV test and age, and odds ratios (OR) including 95 % CI were displayed. In addition,
associa-tions between the number of tests (log2) and individual
known risk behaviors for HIV that were not included in the Menza score were assessed by univariable mixed-effects logistic regression models.
For statistical analysis SPSS 21 (SPSS Inc., Chicago, IL, USA) and SAS 9.4 (SAS Institute, Cary, NC) were used.
The UCSD Human Research Protections Program ap-proved the study protocol, consent, and all study related procedures. All study participants provided voluntary, written informed consent before any study procedures were undertaken.
Results
A large population (n = 14,612 unique clients)
under-went HIV screening using the“Early Test”between April
2008 and July 2014, including 8,935 (61 %) unique MSM (with 17,333 voluntary HIV tests). Notably, 10 % (n = 892) of MSM participants reported sex with women in the past year. Overall, 419 of 8,935 MSM (4.69 %) were newly diagnosed with HIV infection, 219 (2.45 %) with chronic HIV infection, and 200 (2.24 %)
with AEH (125/200 (63 %) at their first “Early Test”,
75/200 (37 %) at a repeated visit). Incidence rate among MSM repeat testers was 1.783 per 100 person years. The Menza score [23] for HIV infection among MSM was significantly higher in those with AEH than in
those without HIV (median 3 points, interquartile range
(IQR) 0–11 versus median 0 point, IQR 0–4,P<0.001) and
displayed a moderate AUC value of 0.636 (95 % CI, 0.594–
0.677) for prediction of AEH.
Baseline risk behavior in single and repeat testers
A comparison of baseline risk behaviors in the 12 months prior to testing and demographics between single and repeat testers is shown in Table 1. A total of 5,402 (63 %) single and 3,202 (37 %) repeat testers (Fig. 1) were included in the analysis. Repeat testers had up to 30 HIV tests during a mean period of follow-up of 104 weeks (standard deviation 84 weeks). Approximately 50 % of repeat testers had 2 or 3 tests and another 25 % (n = 814) had 5 or more tests. At baseline, repeat testers reported significantly more male partners and more con-domless receptive anal intercourse (CRAI), and fewer reported sexual contacts with females when compared to single testers (allP<0.001).
In the multivariable analysis, CRAI (HR, 1.089; 95 % CI,
1.01–1.173; P = 0.026), 10 or more male partners (HR,
1.189; 95 % CI, 1.1–1.285;P<0.001), and not having sexual
contact with females also (HR, 0.824; 95 % CI, 0.725–
0.936;P= 0.003) were associated with repeat testing (also
included in the model: injection drug use, CRAI with a HIV positive male, and STI).
Risk behavior at first and last test in repeat testers
Risk behaviors reported at the first and last test are sum-marized in Table 2 for 2,501 repeat testers (Fig. 1) with
Table 2Risk behavior at the first and last test in 2,501 individuals undergoing repeat HIV testinga
Risk factor/risk behavior (within 12 months prior to test) First test Last test Individuals
reporting risk
Percentage Individuals reporting risk
Percentage Pvalue using McNemar test
10 or more male partners 871/2501 34.83 % 970/2501 38.78 % <0.001
CRAI 1308/2474 52.87 % 1323/2490 53.13 % n.s.
CRAI and 5 or more male partners 859/2483 34.60 % 915/2495 36.67 % 0.028
CRAI and 10 or more male partners 488/2483 19.65 % 580/2495 23.25 % <0.001
CRAI with HIV positive male 76/2288 3.32 % 161/2422 6.65 % <0.001
CRAI with sex worker 7/2436 0.29 % 12/2467 0.49 % n.s.
CRAI with PWID 14/2437 0.57 % 40/2464 1.62 % 0.002
Gonorrheab 141/2501 5.64 % 189/2501 7.56 % 0.004
Syphilisb 50/2501 2.00 % 47/2501 1.88 % n.s.
Any STIb 317/2501 12.67 % 348/2501 13.91 % n.s.
IDU with shared needles 9/2495 0.36 % 19/2501 0.76 % n.s.
IDU 26/2501 1.04 % 28/2501 1.12 % ns
Non-injection stimulant drug use (i.e. methamphetamine, cocaine, poppers, GHB, ketamine, XTC)
562/2501 22.47 % 759/2501 30.35 % <0.001
CRAI, Condomless receptive anal intercourse; GHB, Gamma hydroxybutyrate; IQR, Interquartile range; IDU, Injection drug use; n.s., Not significant; PWID, Person who injects drugs; STI, Sexually transmitted infection; XTC, Ecstasy
a
Median time between first and last test 714 days (IQR, 396–1191); individuals with <180 days between tests were excluded
b
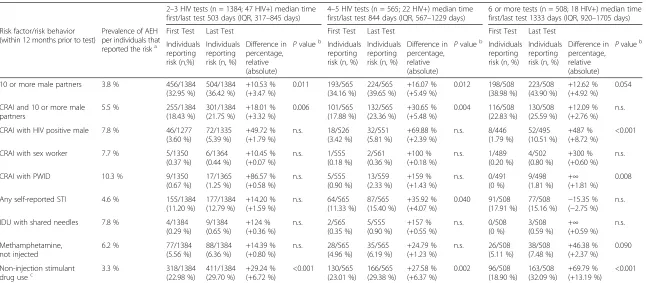
Table 3Risk behavior reported at the first and last test in individuals undergoing repeat HIV testing: individuals with <180 days between tests were excluded
2–3 HIV tests (n = 1384; 47 HIV+) median time first/last test 503 days (IQR, 317–845 days)
4–5 HIV tests (n = 565; 22 HIV+) median time first/last test 844 days (IQR, 567–1229 days)
6 or more tests (n = 508; 18 HIV+) median time first/last test 1333 days (IQR, 920–1705 days)
Risk factor/risk behavior (within 12 months prior to test)
Prevalence of AEH per individuals that reported the riska
First Test Last Test First Test Last Test First Test Last Test
Individuals reporting risk (n,%)
Individuals reporting risk (n, %)
Difference in percentage, relative (absolute)
Pvalueb Individuals
reporting risk (n, %)
Individuals reporting risk (n, %)
Difference in percentage, relative (absolute)
Pvalueb Individuals
reporting risk (n, %)
Individuals reporting risk (n, %)
Difference in percentage, relative (absolute)
Pvalueb
10 or more male partners 3.8 % 456/1384
(32.95 %) 504/1384 (36.42 %) +10.53 % (+3.47 %) 0.011 193/565 (34.16 %) 224/565 (39.65 %) +16.07 % (+5.49 %) 0.012 198/508 (38.98 %) 223/508 (43.90 %) +12.62 % (+4.92 %) 0.054
CRAI and 10 or more male partners
5.5 % 255/1384
(18.43 %) 301/1384 (21.75 %) +18.01 % (+3.32 %) 0.006 101/565 (17.88 %) 132/565 (23.36 %) +30.65 % (+5.48 %) 0.004 116/508 (22.83 %) 130/508 (25.59 %) +12.09 % (+2.76 %) n.s.
CRAI with HIV positive male 7.8 % 46/1277 (3.60 %) 72/1335 (5.39 %) +49.72 % (+1.79 %) n.s. 18/526 (3.42 %) 32/551 (5.81 %) +69.88 % (+2.39 %) n.s. 8/446 (1.79 %) 52/495 (10.51 %) +487 % (+8.72 %) <0.001
CRAI with sex worker 7.7 % 5/1350
(0.37 %) 6/1364 (0.44 %) +10.45 % (+0.07 %) n.s. 1/555 (0.18 %) 2/561 (0.36 %) +100 % (+0.18 %) n.s. 1/489 (0.20 %) 4/502 (0.80 %) +300 % (+0.60 %) n.s.
CRAI with PWID 10.3 % 9/1350
(0.67 %) 17/1365 (1.25 %) +86.57 % (+0.58 %) n.s. 5/555 (0.90 %) 13/559 (2.33 %) +159 % (+1.43 %) n.s. 0/491 (0 %) 9/498 (1.81 %) +∞ (+1.81 %) 0.008
Any self-reported STI 4.6 % 155/1384
(11.20 %) 177/1384 (12.79 %) +14.20 % (+1.59 %) n.s. 64/565 (11.33 %) 87/565 (15.40 %) +35.92 % (+4.07 %) 0.040 91/508 (17.91 %) 77/508 (15.16 %)
−15.35 % (−2.75 %)
n.s.
IDU with shared needles 7.8 % 4/1384
(0.29 %) 9/1384 (0.65 %) +124 % (+0.36 %) n.s. 2/565 (0.35 %) 5/555 (0.90 %) +157 % (+0.55 %) n.s. 0/508 (0 %) 3/508 (0.59 %) +∞ (+0.59 %) n.s. Methamphetamine, not injected
6.2 % 77/1384
(5.56 %) 88/1384 (6.36 %) +14.39 % (+0.80 %) n.s. 28/565 (4.96 %) 35/565 (6.19 %) +24.79 % (+1.23 %) n.s. 26/508 (5.11 %) 38/508 (7.48 %) +46.38 % (+2.37 %) 0.090 Non-injection stimulant drug usec
3.3 % 318/1384
(22.98 %) 411/1384 (29.70 %) +29.24 % (+6.72 %) <0.001 130/565 (23.01 %) 166/565 (29.38 %) +27.58 % (+6.37 %) 0.002 96/508 (18.90 %) 163/508 (32.09 %) +69.79 % (+13.19 %) <0.001
AEH, Acute and early HIV infection; CRAI, Condomless receptive anal intercourse; IQR, Interquartile range; IDU, Injection drug use; n.s., Not significant; PWID, Person who injects drugs; STI, Sexually transmitted infection;
a
Among whole MSM study population after exclusion of those with newly diagnosed chronic HIV infection
b
Calculated using McNemara test;Pvalue displayed when below 0.1
c
i.e. Methamphetamine, cocaine, poppers, Gamma hydroxybutyrate, ketamine, ecstasy
more than 180 days between their first and last test (median time between first and last test 714 days, IQR,
396–1191). Demographic characteristics of the evaluable
2,501 repeat testers reflected those observed for repeat
testers in Table 1. Using Wilcoxon’s signed rank sum
test, repeat testers reported significantly more male
part-ners (P= 0.001) and fewer female partners (P<0.001) at
the last test when compared to the first. Further, the proportions of individuals reporting 10 or more male partners alone or in combination with CRAI, CRAI with an HIV-positive male, CRAI with a person who injects drugs (PWID), gonorrhea, and non-injection stimulant drug use (i.e. methamphetamine, cocaine, poppers, gamma hydroxybutyrate, ketamine, ecstasy) were signifi-cantly higher at the last test when compared to the first (Table 2).
Risk behavior and number of tests in repeat testers
We also investigated risk increase between first and last test by number of tests by dividing the study cohort in three groups: those with 2 to 3 HIV tests (n = 1,384), those with 4 to 5 tests (n = 565), and those with 6 or more tests (n = 508). There was a positive association between number of tests and CRAI with an HIV-positive male, CRAI with a PWID, and non-injection stimulant drug use (Table 3).
To investigate if there was an independent correlation between number of tests over time and change in risk
behavior, we performed analyses using the Menza score at every single test as the outcome [23]. All tests with complete data on the variables of the Menza score
(10,114 “Early tests” in 2,457 repeat testers) were
in-cluded. In these 2,457 repeat testers, there was a signifi-cant increase of the score between baseline (median, 0;
IQR, 0–3) and final test (median, 3; IQR, 0–5;P<0.001).
The relationship between the number of tests and the
logit of high scores (i.e.≥5; at 28 % of visits subjects
re-ported scores above this cutoff ) demonstrates that there was a linear increase of the risk score with log number of tests up to the 17th test (Fig. 2). Univariable mixed-effects logistic regression models (Table 4) showed that more HIV tests (OR = 1.16 for each doubling of the
number of tests, P <0.001), longer time since first HIV
test (OR = 1.08 per year, P <0.001), and younger age
(OR = 0.96 per 5 year increase of age, P = 0.048) were
all individually associated with high risk scores (i.e.≥5).
In the multivariable mixed effects model, number of
tests (OR = 1.18 for each log2 of the number of
tests, P <0.001) and age (OR = 0.95 per 5-year
in-crease, P = 0.006) had significant associations with
high risk (i.e. ≥5 points), while time was no longer
significant (time and number of tests were highly correlated (r = 0.67)).
A significant association between the number of tests and high risk behavior was demonstrated also for risk behaviors not included in the Menza score, i.e. the
combination of CRAI and 10 or more male partners, CRAI with a PWID, and non-injection stimulant drug use (Table 5).
Discussion
This is the largest modern study investigating the rela-tionship between HIV risk behavior and HIV testing among MSM in the United States. Analysis of risk be-havior in subjects participating in an AEH screening
program (“Early Test”) over the past 6 years identified
two major findings. First, MSM who screened repeatedly for HIV reported higher sexual risk behavior at baseline than MSM who only screened once. Second, repeat HIV testing was associated with an increase of risk behavior.
This is the first study to compare baseline risk behav-ior in single versus repeat testers in an era where sero-logic test results are available immediately and AEH can be diagnosed by NAT screening. Prior to the era of NAT screening, a handful of studies evaluated risk behaviors in repeat and single testers. In a study by Fernyak [8], the most frequent testers from 1995 to 1997 were those who practiced the highest risk behaviors, and demon-strated the highest incidence of HIV. In another study by MacKellar [24], repeat testers from 1994 to 1998 were more likely to report recent sexual risk behavior and acquire HIV when compared to first-time testers. We found that MSM in San Diego who repeatedly screened for HIV with combined serologic and NAT, practice higher sexual risk behavior at baseline than single
testers, but there were no differences identified between these groups for most recreational drugs or recent STI.
This represents the biggest study to date analyzing the associations between repeat testing and risk behavior in repeat testers. In 2007, repeat testers accounted for more than 80 % of HIV tests performed annually in the United States [1], and when analyzing our program since 2008, repeat tests accounted for 48 % (8,396/17,333) of volun-tary HIV tests among MSM. Our main finding was that repeat acute infection screening (i.e. rapid serologic test-ing plus NAT) was independently associated with an increase of risk behaviors between the baseline and the last test. Rates of 10 or more male partners, CRAI with an HIV-positive partner, CRAI with a PWID, non-injection stimulant drug use, and self-reported STIs all increased in line with testing frequency.
To assess change in risk over time we selected a previ-ously validated score for prediction of HIV acquisition among MSM repeat testers as the outcome [23]. When evaluating that Menza risk behavior score at every single
“Early test”visit, there was an increase of the proportion
of individuals with high scores (i.e. ≥5 points) and the
number of tests observed. In the study by Menza, this 5-point cut-off was associated with a cumulative 1-year HIV seroconversion incidence of 3.6 % (derivation co-hort) and 4.4 % (validation coco-hort) [23]. This increase of risk behavior witnessed in our study is unlikely to simply reflect the nation-wide increases in risk behaviors in
MSM over time [25], as number of tests–in contrast to
Table 5Associations of number of HIV tests with other risk factors: calculated by univariate mixed effects model by log2increase of tests (i.e. between first, second, fourth, eight, etc.)
Risk factor Number of
individuals
Number of visits
OR for risk factor per log2increase of number of tests
OR (95 % CI) Pvalue
CRAI 2457 10,185 0.99 (0.94–1.04) n.s.
CRAI and 10 or more male partners 2457 10,223 1.11 (1.05–1.18) <0.001
CRAI with PWID 2455 10,098 1.35 (1.12–1.64) 0.002
CRAI with sex worker 2456 10,093 1.20 (0.88–1.64) n.s.
Non-injection stimulant drug use (i.e. methamphetamine, cocaine, poppers, GHB, ketamine, XTC)
2457 10,251 1.37 (1.30–1.45) <0.001
IDU 2457 10,251 0.91 (0.74–1.13) n.s.
IDU with Shared needles 2455 10,209 0.95 (0.60–1.50) n.s.
CRAI, Condomless receptive anal intercourse; GHB, Gamma hydroxybutyrate; IDU, Injection drug use; n.s., Not significant; OR, Odds ratio; PWID, Person who injects drugs; XTC, Ecstasy
Table 4Mixed effects model on factors associated with high-risk behavior: (i.e.≥5 Menza-score points)
Variables included in the mixed effects model Univariable Multivariable
N Number of visits OR (95 % CI) Pvalue OR (95 % CI) Pvalue
Number of HIV tests (log2) 2457 10,114 1.16 (1.10–1.23) <0.0001 1.18 (1.11–1.24) <0.0001
Years since first test 2457 10,114 1.08 (1.04–1.13) <0.0001 – n.s.
time between first and last test–remained an independ-ent predictor of increased risk-behavior in the mixed ef-fects model. This finding may support a hypothesis that provision of negative AEH screening results, which pro-vide HIV status information related to very recent risk behaviors, is independently associated with an increase of risk behaviors between the baseline and the last test. In other words, when a high-risk individual receives a negative HIV result, they may rationalize prior risk be-havior as relatively safe, potentially justifying an escal-ation in subsequent risk [25]. However, although we describe a strong relationship between testing and risk behavior, we are not able to conclude causality, and also the opposite may be true (i.e. clients increased risk be-havior is the cause and not the result of repeat testing). Nevertheless, our study provides provocative data that warrants further testing of causation in future studies.
Our study has several additional limitations including its single-center and retrospective design. Further, though ptest counseling offering personalized risk
re-duction options was provided at every single “Early
Test”, it is likely that the intensity of the counseling may
have been reduced at some of the repeated visits. We hypothesized that the frequency of repeat testing is asso-ciated with increased risk behavior, but we cannot rule out that repeated tests are not a cause but just a result of increased risk behavior (i.e. our cohort increased their HIV testing as a response to their increased risk behavior). Additionally, testing in primary care settings and even home testing has become more normative during the study period and individuals may have
tested outside the “Early Test” or associated studies,
which may have led to an underestimation of the pro-portion of repeat testers. Further, some slight modifi-cations of the previously validated Menza risk score were necessary to fit our available data and analyses. Finally, we cannot completely rule out that subjects reported risk behaviors more honestly with time and repeat testing.
Conclusions
In conclusion, this study demonstrates that the highest risk individuals for acquiring HIV (e.g. candidates for antiretroviral pre-exposure prophylaxis, referral for add-itional behavioral counseling, STI screening) that are usually identified by risk scores [26], may also be identi-fied by their testing patterns. Strikingly, we found that repeat HIV testing itself might be associated with an in-crease in risk behavior. Although we were not able to conclude causality, this finding may support a hypothesis that rapid or immediate feedback of negative test results may reinforce high-risk behavior. To compensate for this reinforcement, intensified ptest counseling among re-peat testers may be necessary, particularly if increasing
risk behavior is documented [27]. This might be true es-pecially in the setting of acute infection screening, which provides HIV status information related to very recent risk behaviors. Future studies that assess different inten-sities and/or types of pre-test counseling (e.g. controlled trial randomizing intervention in high-risk repeat testers to reduce risk-taking behaviors) are needed to assess causality. Such information will be crucial to better understand the dynamics of risk-taking behavior and frame HIV test counseling messages. If true, then new prevention efforts should be developed and evaluated for MSM who repeatedly screen for HIV.
Abbreviations
AEH:Acute and early HIV infection; AUC: Area under the curve; CI: Confidence interval; CRAI: Condomless receptive anal intercourse; IQR: Inter-quartile range; MSM: Men who have sex with men; n.s.: not significant; NAT: Nucleic acid amplification testing; OR: Odds ratio; PWID: Person who injects drugs; ROC: Receiver operating characteristics; STI: Sexually transmitted infections.
Competing interests
Dr. Hoenigl served on the speakers’bureau of Merck. Dr. Smith reported receiving grant funding from ViiV Healthcare and having served as a consultant for Genprobe and Testing Talent Services. Dr. Little reported grant funding from Gilead Sciences, Inc. All other authors declare no competing interests.
Authors’contributions
MH was the principal investigator, and designed the study together with SJL, analyzed the data, and drafted the manuscript. CMA provided the data, helped with data analysis and performed part of the statistical analysis, as well as helping drafting the manuscript. NG helped in analyzing the data and drafting the manuscript. SRM helped by designing the study, providing ideas and content critical to this manuscript, and participated in the drafting of the manuscript. DMS provided guidance in analyzing the data and drafting of the manuscript. SJL contributed in designing the study, coordinated and supervised data analysis, and helped drafting of the manuscript. All authors revised the manuscript critically for important intellectual content and approved the final manuscript.
Acknowledgements
This work was supported by funds from the Max Kade Foundation, New York (Max Kade Postdoctoral Research grant), the International Research Fellowship in NeuroAIDS (R25-MH081482), the Department of Veterans Affairs and grants from the National Institutes of Health (AI43638, AI074621, AI093163, AI100665, DA034978, AI036214, AI106039), CFAR, and the James B. Pendleton Charitable Trust. The funders had no role in study design, data collection and analysis, decision to publish, or preparation of the manuscript. The authors wish to thank David A. Rodriguez, testing manager at the antiviral Research Center (AVRC), for his valuable advice and input.
Author details 1
AntiViral Research Center, Division of Infectious Diseases, Department of Medicine, University of California, San Diego, 200 West Arbor Drive #8208, San Diego, CA 92103, USA.2Section of Infectious Diseases and Tropical Medicine, Department of Internal Medicine, Medical University of Graz, Graz, Austria.3Division of Pulmonology, Department of Internal Medicine, Medical University of Graz, Graz, Austria.4Veterans Affairs Healthcare System, San Diego, CA, USA.
Received: 29 June 2015 Accepted: 19 August 2015
References
2. Xia Q, Nonoyama A, Molitor F, Webb D, Osmond D. Recent decline in the incidence of human immunodeficiency virus infection among California men who have sex with men. Am J Epidemiol. 2011;174:203–10. 3. Xia Q, Osmond DH, Tholandi M, Pollack LM, Zhou W, Ruiz JD, et al. HIV
prevalence and sexual risk behaviors among men who have sex with men: results from a statewide population-based survey in California. J Acquir Immune Defic Syndr. 2006;41:238–45.
4. Scott HM, Vittinghoff E, Irvin R, Sachdev D, Liu A, Gurwith M, et al. Age, race/ethnicity, and behavioral risk factors associated with per contact risk of HIV infection among men who have sex with men in the United States. J Acquir Immune Defic Syndr. 2014;65:115–21.
5. Mannheimer SB, Wang L, Wilton L, Van Tieu H, Del Rio C, Buchbinder S, et al. Infrequent HIV testing and late HIV diagnosis are common among a cohort of black men who have sex with men in 6 US cities. J Acquir Immune Defic Syndr. 2014;67:438–45.
6. Branson BM, Handsfield HH, Lampe MA, Janssen RS, Taylor AW, Lyss SB, et al. Revised recommendations for HIV testing of adults, adolescents, and pregnant women in health-care settings. MMWR Recomm Rep. 2006;55:1–17. quiz CE1-4.
7. Morris SR, Little SJ, Cunningham T, Garfein RS, Richman DD, Smith DM. Evaluation of an HIV nucleic acid testing program with automated Internet and voicemail systems to deliver results. Ann Intern Med. 2010;152:778–85. 8. Fernyak SE, Page-Shafer K, Kellogg TA, McFarland W, Katz MH. Risk behaviors
and HIV incidence among repeat testers at publicly funded HIV testing sites in San Francisco. J Acquir Immune Defic Syndr. 2002;31:63–70.
9. Norton J, Elford J, Sherr L, Miller R, Johnson MA. Repeat HIV testers at a London same-day testing clinic. AIDS. 1997;11:773–81.
10. Phillips KA, Paul J, Kegeles S, Stall R, Hoff C, Coates TJ. Predictors of repeat HIV testing among gay and bisexual men. AIDS. 1995;9:769–75. 11. McNairy ML, El-Sadr WM. A paradigm shift: focus on the HIV prevention
continuum. Clin Infect Dis. 2014;59:S12–5.
12. Fiorillo SP, Landman KZ, Tribble AC, Mtalo A, Itemba DK, Ostermann J, et al. Changes in HIV risk behavior and seroincidence among clients presenting for repeat HIV counseling and testing in Moshi, Tanzania. AIDS Care. 2012;24:1264–71.
13. Jayaraman GC, Bush KR, Lee B, Singh AE, Preiksaitis JK. Magnitude and determinants of first-time and repeat testing among individuals with newly diagnosed HIV infection between 2000 and 2001 in Alberta, Canada: results from population-based laboratory surveillance. J Acquir Immune Defic Syndr. 2004;37:1651–6.
14. Khanna AS, Goodreau SM, Gorbach PM, Daar E, Little SJ. Modeling the impact of post-diagnosis behavior change on HIV prevalence in Southern California men who have sex with men (MSM). AIDS Behav. 2014;18:1523–31. 15. Granich RM, Gilks CF, Dye C, De Cock KM, Williams BG. Universal voluntary
HIV testing with immediate antiretroviral therapy as a strategy for elimination of HIV transmission: a mathematical model. Lancet. 2009;373:48–57.
16. Mustanski B, Rendina HJ, Greene GJ, Sullivan PS, Parsons JT. Testing negative means I’m lucky, making good choices, or immune: diverse reactions to HIV test results are associated with risk behaviors. Ann Behav Med. 2014;48:371–83.
17. Thaler RH, Johnson E. Gambling with the house money and trying to break even: the effects of prior outcomes on risky choices. Manage Sci. 1990;36:643–60.
18. Cohen MS, Gay CL, Busch MP, Hecht FM. The detection of acute HIV infection. J Infect Dis. 2010;202:S270–7.
19. The Early Test. https://theearlytest.ucsd.edu. Accessed May, 27th2015 20. Hoenigl M, Green N, Mehta SR, Little SJ. Risk factors for acute and early HIV
infection among men who have sex with men (MSM) in San Diego, 2008 to 2014: a cohort study. Medicine (Baltimore). 2015;94:e1242.
21. Karris MY, Anderson CM, Morris SR, Smith DM, Little SJ. Cost savings associated with testing of antibodies, antigens, and nucleic acids for diagnosis of acute HIV infection. J Clin Microbiol. 2012;50:1874–8. 22. Le T, Wright EJ, Smith DM, He W, Catano G, Okulicz JF, et al. Enhanced
CD4+ T-cell recovery with earlier HIV-1 antiretroviral therapy. N Engl J Med. 2013;368:218–30.
23. Menza TW, Hughes JP, Celum CL, Golden MR. Prediction of HIV acquisition among men who have sex with men. Sex Transm Dis. 2009;36:547–55. 24. MacKellar DA, Valleroy LA, Secura GM, Bartholow BN, McFarland W, Shehan D,
et al. Repeat HIV testing, risk behaviors, and HIV seroconversion among young men who have sex with men: a call to monitor and improve the practice of prevention. J Acquir Immune Defic Syndr. 2002;29:76–85.
25. Centers for Disease Control and Prevention (CDC). HIV testing and risk behaviors among gay, bisexual, and other men who have sex with men– United States. MMWR Morb Mortal Wkly Rep. 2013;62:958–62.
26. Hoenigl M, Weibel N, Mehta SR, Anderson CM, Jenks J, Green N, et al. Development and validation of the San Diego Early Test (SDET) score to predict acute and early HIV infection risk in men who have sex with men. Clin Infect Dis. 2015;61:468–75.
27. Marrazzo JM, del Rio C, Holtgrave DR, Cohen MS, Kalichman SC, Mayer KH, et al. HIV prevention in clinical care settings: 2014 recommendations of the International Antiviral Society-USA Panel. JAMA. 2014;312:390–409.
Submit your next manuscript to BioMed Central and take full advantage of:
• Convenient online submission
• Thorough peer review
• No space constraints or color figure charges
• Immediate publication on acceptance
• Inclusion in PubMed, CAS, Scopus and Google Scholar
• Research which is freely available for redistribution

![Fig. 2 Percentage of high (i.e. ≥5 Menza-score points) HIV behavioral risk scores as modified from [23], by number of HIV tests in repeat testers.The bubble size reflects the denominator used to calculate the percentage of high scores](https://thumb-us.123doks.com/thumbv2/123dok_us/8919379.1840773/7.595.58.539.447.685/percentage-behavioral-modified-testers-reflects-denominator-calculate-percentage.webp)

