Emperor International Journal of Finance and Management Research [EIJFMR] Page 117
COMPARATIVE EFFECT OF
DIFFERENT INTENSITY OF PHYSICAL
FITNESS EXERCISES ON MUSCULAR
STRENGTH AND ANAEROBIC
POWEROF OBESE SCHOOL BOYS
Mr. K. CHANDRASEKAR
Ph.D. Scholar, Department of Physical Education,
Manonmaniam Sundaranar University, Tirunelveli, Tamilnadu
Dr. D. JIM REEVES SILENT NIGHT
Director of Physical Education (SG),
Aditanar College of Arts and Science,Tiruchendur , Tamilnadu
ABSTRACT
The prevalence of obesity in children
and adolescents are increasing rapidly worldwide.
A rising rate of obesity in epidemic proportions
also brings about economic consequences and
substantial healthcare costs. Regular physical
activity positively affects the blood lipid and
lipoprotein profile. The scientific understanding is
that physical activity or planned exercise positively
alters blood triglyceride levels. The study was to
find out the Comparative effect of different
intensities of physical fitness exercises on muscular
strength and anaerobic power among obese school
boys. Only 90 obese school boys were selected
randomly as subjects from the selected Schools of
Thoothukudi District. To identify the obese boys,
the body mass index as suggested by World Health
Organization (WHO) was used. The age of the
subjects was restricted into 13 to 15 years. The
selected subjects were divided into two
experimental groups and a control group. No step
was taken to equate the group in any manner.
Group I underwent moderate intensity physical
fitness exercise, Group II underwent high intensity
physical fitness exercise, on three alternate days in
a week for a period of twelve weeks and Group III
acted as Control.The dependent variables selected
for this study were muscular strength and anaerobic
power. All the subjects were tested prior to and
immediately after the experimentation on skill
performance. The collected data from the three
groups prior to and immediately after the training
programme on selected criterion variables were
statistically analyzed with dependent ‘t’ test and
analysis of covariance (ANCOVA). Whenever the ‘F’ ratio for adjusted test was found to be significant, the Scheffe’s test was applied as
post-hoc test to find out paired mean difference. In all
the cases 0.05 level of significant was fixed. The
result of the study also revealed that there was a
significant improvement on muscular strength and
anaerobic power after the moderate and high
intensity physical training groups and significant
difference was found between the training groups
Emperor International Journal of Finance and Management Research [EIJFMR] Page 118
favour of high intensity physical exercise training
groups.
Key Words: moderate intensity physical exercise,
high intensity physical fitness exercise, Muscular
Strength, Anaerobic Power and Obese.
Introduction
Childhood obesity and its related
metabolic complications are associated with
insufficient physical activity, excessive sedentary
time, unhealthy eating behaviors, these factors all
constituting an unhealthy lifestyle. Primary
prevention programs, often based on interventions
in schools, promote the positive effects of physical
activity and healthy eating behaviors. These
interventions targeting the general population are
effective for the prevention of excessive body fat
accumulation, and better physical fitness in
children and adolescents.
Human body is a complex organism
composed of a variety of tissues that change as the
body develops, matures and ages. It is important to
recognize how these body compartments may be
affected by age, gender and ethnicity. An
understanding or basic knowledge of body
composition is relevant to many disciplines,
including health and medicine, nutrition, exercise
science, human performance, and other biological
sciences. Nutritional status assessment, charting the
course of diseases from diagnosis to recovery,
growth and development, aging
andconditionsofphysicalworkareafewexamplesofsit
uationsand for which measurements of body
composition can add to the understanding of
physiological processes and aid in the treatment of
diseases like obesity and anorexia.
Childhood, adolescence may last almost a
decade and is a bridge between childhood and
adulthood. Adolescence includes puberty and the
years that follow until sexual maturation is
complete. During this period, adult body
composition characteristics and patterns of adipose
tissue distribution are developing. Chronological
ages cannot be used as precise points of
demarcation for these developmental periods.
Nevertheless, chronological age is important, since
there are numerous major differences between
values and in the rates at which these values
change.
Exercise is a key component in the
prevention of obesity. This is a condition in which
energy intake, in the form of food, exceeds the
energy expenditure of daily living and the excess
energy is stored in the form of adipose tissue, made
up of fat cells. Two factors facilitate the onset and
progressive nature of obesity.
Participation in moderate-intensity
physical activity on a daily basis produces
significant health benefits, even if fitness levels do
not increase. Improvements in health benefits
depend on the volume (i.e., combination of
frequency, intensity, and duration) of physical
activity. HDL increases in response to endurance
training. This response appears to be related to the
exercise training dose and is less dramatic in
women than in men. Moderate-intensity (60% of
heart rate reserve) walking program is as effective
as a high intensity (80% of heart rate reserve)
program improving the HDL profile of women as
long as the total training volume is
similar.Increasing daily physical activity and
planned exercise contributes to health in many
ways. Daily physical activity also increases the body’s capacity to do work, which increases the body’s ability to meet daily physical needs and the
unexpected demands of life and reduces strain to
many body systems and organs, including the heart.
Independent Variables:
Physical Exercises with Moderate
Intensity
Emperor International Journal of Finance and Management Research [EIJFMR] Page 119 Dependent Variables:
Muscular Strength
Anaerobic Power
Methodology:
The purpose of the study was to find out
the Comparative effect of different intensities of
physical fitness exercises on muscular strength and
anaerobic power among obese school boys. Only
90 obese school boys were selected randomly as
subjects from the selected Schools of Thoothukudi
District. To identify the obese boys, the body mass
index as suggested by World Health Organization
(WHO) was used. The age of the subjects was
restricted into 13 to 15 years. The selected subjects
were divided into two experimental groups and a
control group. No step was taken to equate the
group in any manner. Group I underwent moderate
intensity physical fitness exercise, Group II
underwent high intensity physical fitness exercise,
on three alternate days in a week for a period of
twelve weeks and Group III acted as Control. The
dependent variables selected for this study were
muscular strength and anaerobic power. All the
subjects were tested prior to and immediately after
the experimentation on skill performance. The
collected data from the three groups prior to and
immediately after the training programme on
selected criterion variables were statistically analyzed with dependent ‘t’ test and analysis of covariance (ANCOVA). Whenever the ‘F’ ratio for
adjusted test was found to be significant, the Scheffe’s test was applied as post-hoc test to find
out paired mean difference. In all the cases 0.05
level of significant was fixed.
Results and findings
1. Muscular Strength
The analysis of pre and post test means, standard deviations and dependent ‘t’ test values on
Muscular Strength of the subjects of experimental
groups and control groups has been presented in
Table-1
Table – 1
MEAN, STANDARD DEVIATION AND DEPENDENT ‘t’ TEST VALUES ON MUSCULAR
STRENGTH OF EXPERIMENTAL AND CONTROL GROUPS
Tests Moderate Intensity
Physical Training Group
High Intensity Physical
Training Group
Control Group
Mean SD Mean SD Mean SD
Pre test 18.90 3.68 18.53 3.01 18.40 4.12
Post test 21.60 5.13 23.67 4.46 18.33 3.41
T-Test 7.72* 8.96* 0.18
*Significant at .05 level. The table value required at 0.05 level with df 29 is 2.05.
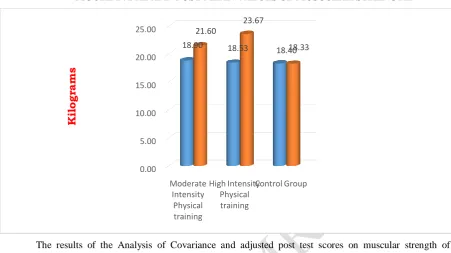
Table – 1, shows that the obtained t-test
value of moderate and high intensity physical
training groups are 7.72 and 8.96 respectively
which are greater than the tabulated t-value of 2.05
with df 29 at .05 level of confidence. This means
that the moderate and high intensity physical
training groups had registered significant
improvement in muscular strength. However,
control group did not show any significant improvement on participants’ muscular strength
because they did not underwent any special
training.
Figure I illustrate the pre and post test
means of moderate and high intensity physical
training groups and control group on muscular
Emperor International Journal of Finance and Management Research [EIJFMR] Page 120 FIGURE I : PRE AND POST MEAN VALUES OF MUSCULAR STRENGTH
The results of the Analysis of Covariance and adjusted post test scores on muscular strength of
experimental groups and control group were presented in Table – 2.
Table – 2
RESULTS OF ANALYSIS OF COVARIANCE ON MUSCULAR STRENGTH AMONG
EXPERIMENTAL AND CONTROL GROUPS
Adjusted Post Test Means Sources
of Variance
Sum of
Square
df Mean
Squares
F-ratio
Moderate
Intensity
Physical
Training
Group
High
Intensity
Physical
Training
Group
Control
Group
21.31 23.75 18.55 Between 405.895 2 202.947 33.85*
Within 515.593 86 5.995
*Significant at 0.05 level. The table value required at 0.05 level with df 2 & 86 is 3.105.
The above table-2 shows that the obtained
F-ratio value is 33.85, which is higher than the
table value 3.105 with df 2 and 86 required for
significance at 0.05 level. Since the value of F-ratio
is higher than the table value, it indicates that there
was significant difference among the adjusted
post-test means moderate and high intensity physical
training groups and control group on Muscular
Strength. To find out which of the three paired means had a significant difference, the Scheffe’s
post-hoc test was applied and the results are
presented in Table-3.
0.00 5.00 10.00 15.00 20.00 25.00
Moderate Intensity
Physical training
High Intensity Physical training
Control Group
18.90 18.53 18.40
21.60
23.67
18.33
K
il
o
g
ra
Emperor International Journal of Finance and Management Research [EIJFMR] Page 121 21.31
23.75
18.55
0 5 10 15 20 25
Moderate Intensity Physical
Training High Intensity Physical Training Control Group Table – 3
SCHEFFE’S TEST FOR THE DIFFERENCES BETWEEN THE ADJUSTED POST TEST PAIRED
MEANS OF MUSCULAR STRENGTH
Adjusted Post Test Mean Mean
Differences
Confidence Interval Moderate
Intensity Physical Training Group
High Intensity Physical Training
Group
Control Group
21.31 23.75 2.44* 1.58
21.31 18.55 2.76*
23.75 18.55 5.20*
*Significant at 0.05 level.
Table-3 shows that the adjusted post test mean differences on muscular strength between moderate and
high intensity physical training groups; moderate intensity physical training and control groups; and high
intensity physical training and control groups, 2.44, 2.76 and 5.20 which are greater than the confidence interval
value 1.58, which shows significant difference at 0.05 level of confidence. It may be concluded from the results
of the study that there was a significant difference on muscular strength between moderate and high intensity
physical training groups; moderate intensity physical training and control groups; and high intensity physical
training and control groups.
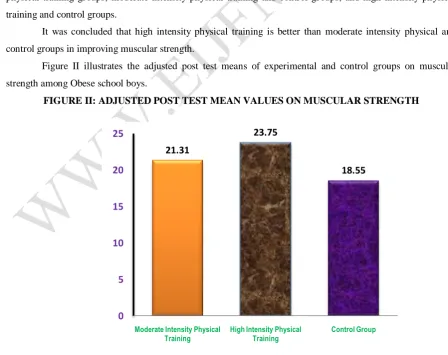
It was concluded that high intensity physical training is better than moderate intensity physical and
control groups in improving muscular strength.
Figure II illustrates the adjusted post test means of experimental and control groups on muscular
strength among Obese school boys.
Emperor International Journal of Finance and Management Research [EIJFMR] Page 122 2. Anaerobic Power
The analysis of pre and post test means, standard deviations and dependent ‘t’ test values on Anaerobic
Power of the subjects of experimental groups and control groups has been presented in Table-4
Table – 4
MEAN, STANDARD DEVIATION AND DEPENDENT ‘t’ TEST VALUES ON ANAEROBIC POWER
OF EXPERIMENTAL AND CONTROL GROUPS
Tests Moderate Intensity
Physical Training Group
High Intensity Physical
Training Group
Control Group
Mean SD Mean SD Mean SD
Pre test 155.74 20.87 162.57 21.90 161.28 20.54
Post test 171.58 25.53 176.11 23.42 162.38 20.83
T-Test 4.33* 2.78* 0.98
*Significant at .05 level. The table value required at 0.05 level with df 29 is 2.05.
Table – 4, shows that the obtained t-test
value of moderate and high intensity physical
training groups are 4.33 and 2.78 respectively
which are greater than the tabulated t-value of 2.05
with df 29 at 0.05 level of confidence. This means
that the moderate and high intensity physical
training groups had registered significant
improvement in Anaerobic Power. However,
control group did not show any significant improvement on participants’ Anaerobic Power because they did not underwent any special
training.
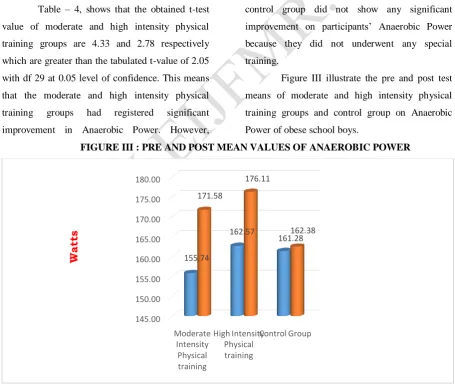
Figure III illustrate the pre and post test
means of moderate and high intensity physical
training groups and control group on Anaerobic
Power of obese school boys.
FIGURE III : PRE AND POST MEAN VALUES OF ANAEROBIC POWER
The results of the Analysis of Covariance and adjusted post test scores on Anaerobic Power of
experimental groups and control group were presented in Table – 5.
145.00 150.00 155.00 160.00 165.00 170.00 175.00 180.00
Moderate Intensity Physical training
High Intensity Physical training
Control Group
155.74
162.57
161.28 171.58
176.11
162.38
W
a
tt
Emperor International Journal of Finance and Management Research [EIJFMR] Page 123 Table – 5
RESULTS OF ANALYSIS OF COVARIANCE ON ANAEROBIC POWER AMONG EXPERIMENTAL
AND CONTROL GROUPS
Adjusted Post Test Means Sources
of
Variance
Sum of
Square
df Mean
Squares
F-ratio
Moderate Intensity
Physical Training
Group
High Intensity
Physical Training
Group
Control
Group
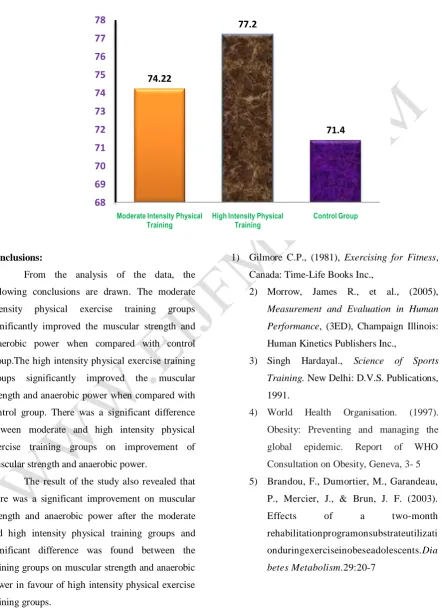
74.22 77.20 71.40 Between 352.415 2 176.208 19.71*
Within 768.822 86 8.940
*Significant at 0.05 level. The table value required at 0.05 level with df 2 & 86 is 3.105.
The above table-5 shows that the obtained
F-ratio value is 19.71, which is higher than the
table value 3.105 with df 2 and 86 required for
significance at 0.05 level. Since the value of F-ratio
is higher than the table value, it indicates that there
was significant difference among the adjusted
post-test means moderate and high intensity physical
training groups and control group on Anaerobic
Power. To find out which of the three paired means had a significant difference, the Scheffe’s post-hoc
test was applied and the results are presented in
Table-6.
Table – 6
SCHEFFE’S TEST FOR THE DIFFERENCES BETWEEN THE ADJUSTED POST TEST PAIRED
MEANS OF ANAEROBIC POWER
Adjusted Post Test Mean Mean
Differences
Confidence
Interval Moderate
Intensity Physical
Training Group
High Intensity
Physical Training
Group
Control
Group
74.22 77.20 2.98* 1.92
74.22 71.40 2.82*
77.20 71.40 5.80*
*Significant at 0.05 level.
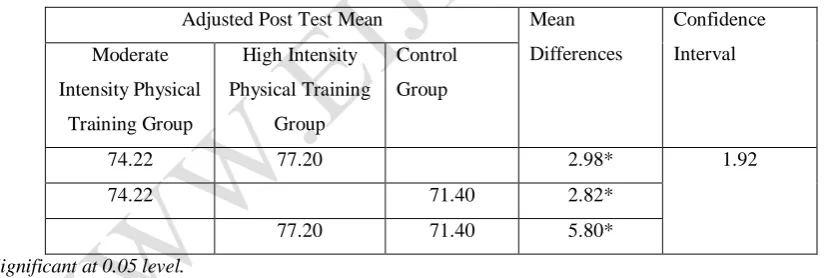
Table-6 shows that the adjusted post test
mean differences on Anaerobic Power between
moderate and high intensity physical training
groups; moderate intensity physical training and
control groups; and high intensity physical training
and control groups, 2.98, 2.82 and 5.80 which are
greater than the confidence interval value 1.92,
which shows significant difference at 0.05 level of
confidence. It may be concluded from the results of
the study that there was a significant difference on
anaerobic power between moderate and high
intensity physical training groups; moderate
intensity physical training and control groups; and
high intensity physical training and control groups.
It was concluded that high intensity
physical training is better than moderate intensity
physical and control groups in improving anaerobic
Emperor International Journal of Finance and Management Research [EIJFMR] Page 124 74.22
77.2
71.4
68 69 70 71 72 73 74 75 76 77 78
Moderate Intensity Physical
Training High Intensity Physical Training Control Group
Figure IV illustrates the adjusted post test
means of experimental and control groups on
Anaerobic Power among Obese school boys.
FIGURE II: ADJUSTED POST TEST MEAN VALUES ON ANAEROBIC POWER
Conclusions:
From the analysis of the data, the
following conclusions are drawn. The moderate
intensity physical exercise training groups
significantly improved the muscular strength and
anaerobic power when compared with control
group.The high intensity physical exercise training
groups significantly improved the muscular
strength and anaerobic power when compared with
control group. There was a significant difference
between moderate and high intensity physical
exercise training groups on improvement of
muscular strength and anaerobic power.
The result of the study also revealed that
there was a significant improvement on muscular
strength and anaerobic power after the moderate
and high intensity physical training groups and
significant difference was found between the
training groups on muscular strength and anaerobic
power in favour of high intensity physical exercise
training groups.
References
1) Gilmore C.P., (1981), Exercising for Fitness, Canada: Time-Life Books Inc.,
2) Morrow, James R., et al., (2005),
Measurement and Evaluation in Human Performance, (3ED), Champaign Illinois: Human Kinetics Publishers Inc.,
3) Singh Hardayal., Science of Sports Training. New Delhi: D.V.S. Publications, 1991.
4) World Health Organisation. (1997).
Obesity: Preventing and managing the
global epidemic. Report of WHO
Consultation on Obesity, Geneva, 3- 5
5) Brandou, F., Dumortier, M., Garandeau,
P., Mercier, J., & Brun, J. F. (2003).
Effects of a two-month
rehabilitationprogramonsubstrateutilizati