_____________________________________________________________________________________________________
*Corresponding author: E-mail: [email protected];
Study of Variability and Association of Yield
Attributing Traits in Durum Wheat Genotypes
Shree Krishna Adhikari
1*, Nisha Rana
1, Bishnu Raj Ojha
1, Raju Kharel
1,
Swastika Chauhan
2and Dhruba Bahadur Thapa
31Department of Genetics and Plant Breeding, Agriculture and Forestry University, Nepal. 2
Department of Horticulture, Agriculture and Forestry University, Nepal.
3
Agriculture and Botany Division, Nepal Agricultural Research Council, Khumaltar, Lalitpur, Nepal.
Authors’ contributions
This work was carried out in collaboration between all authors. Authors SKA and NR carried out the field experiment and data recording. Author SKA performed the statistical analysis, wrote the first draft of the manuscript. Authors BRO and RK managed the analyses of the study. Author SC managed the literature searches and data recording. Author DBT developed the research design, provided materials for research and helped in data analysis. All authors read and approved the final manuscript.
Article Information
DOI: 10.9734/JAERI/2018/42077 Editor(s): (1)Maria Panitsa, Department of Environmental and Natural Resource Management, University of Patras, Greece.
Reviewers: (1)Santosh Kumari, Indian Agricultural Research Institute, India. (2)Hasan Kiliç, Bingol University, Turkey. Complete Peer review History:http://www.sciencedomain.org/review-history/25095
Received 23rd March 2018 Accepted 5th June 2018 Published 12th June 2018
ABSTRACT
Twenty advanced line durum genotypes were tested to assess the presence of significant variability for grain yield and yield attributing traits by using randomized complete block design with three replications for two years at research farm of Agriculture and Forestry University, Chitwan, Nepal. Mean sum of squares revealed highly significant differences among durum wheat genotypes for all traits investigated, suggesting the possibility of improving durum wheat for these traits. High heritability associated with high genetic gain was found on some traits namely; flag leaf area, 1000-kernel weight and days to heading indicates the presence of additive gene action in controlling these traits. Grain yield (GYLD), harvest index (HI), test weight (TW), days to maturity (DTM), spike length (SPKL) and peduncle length (PDNL) showed low genetic gain associated with high heritability indicates the presence of non-additive gene action in controlling related traits. Grain filling rate (GFR), harvest index, grain number per spike (GNPS), test weight, plant height (HT) and peduncle
length were found significantly correlated with grain yield at both genotypic and phenotypic levels. Among these traits, grain filling rate, grain number per spike and test weight, had the maximum direct positive effect on grain yield, which can be used as effective traits for selection of superior genotypes.
Keywords: Triticum turgidum ssp. durum Desf.; heritability; genotypic-phenotypic correlation; path analysis; yield; genotype × year interaction.
1. INTRODUCTION
Durum (Triticum turgidum ssp. durum Desf), also commonly known as bulghur and pasta or macaroni wheat, is originated and diversified
from Mediterranean basin. It is a
monocotyledonous tetraploid (2n = 4x=28) plant of Poaceae family of Triticeae tribe and belongs to the genus Triticum. It is an exotic crop for Nepal. Due to food habit change and urbanization, the demand of durum product and consumption in Nepal is soaring in alarming rate [1]. Wheat is the third most cultivated crop in Nepal. Almost all portion of wheat cultivation is represented by bread wheat. There is no production record of durum wheat at commercial scale till the date in Nepal due to lack of proper knowledge on it and suitable germplasm to be grown [2]. In 2007/08, Agriculture Botany Division (ABD) of Nepal Agricultural Research Council (NARC) has conducted feasibility and adaptive screening trial at Regional Agriculture and Research Station (RARS), Nepalgunj, Banke [3,4]. Thereupon, Regional Agriculture Research Station-NARC is carrying several “Durum Wheat Advanced Varietal Trial” for selection of genotypes in the mid-western region of Nepal. In addition, many stakeholders are interested in durum grain production, processing and making end-use products, which are in fact important factors deciding the success of this durum-based industry.
It is believed that durum performs better even under stress condition [5,6]. In South-western part of Nepal, where low rainfall occurs, drought is the major problem in winter. Durum wheat can exploit the existing environment successfully (D. B. Thapa, personal communication, November 22, 2017) better than bread wheat. Durum is becoming the promising crop and an increasingly viable option to cultivate in near future. For better crop improvement, grain yield becomes the priority in breeding programs. Grain yield is the quantitative trait that is governed by polygenes. It is the function of several supporting other quantitative traits. Variation within the quantitative traits are mainly due to their complex inheritance and environmental effects. Thus,
understanding the genetic variability and gene interaction of yield and yield-associated traits are essential [5] which determines the success of crop improvement program. Only the characters governed by genetic constituents are transferred to the progenies. Thus, for successful breeding plan, study of heritability and genetic association of characters has paramount importance [5]. Genotypic correlation study provides the direction and strength of association between the traits beyond the environmental effect. Direct selection of genotypes from few most seemingly important traits sometimes may not give effective results. Indirect selection for grain yield may give better result if the correlation between a yield component and yield is strong and the negative interrelationships of yield components are negligible. High correlated and heritable traits with yield can be selected in early generations. As correlation is affected by different genetic and environmental factors, sometimes correlation value may mislead research results due to over or underestimation of association. Thus, it is good to study the direct and indirect influence of traits to yield which can be studied through a standardized partial regression coefficient called path coefficient [7-9]. Therefore, the objective of the present study was to determine genetic variability, heritability, genetic association of traits and direct-indirect effects of important traits of yield components to yield in subtropical zone of Nepal.
2. MATERIALS AND METHODS
2.1 Materials Studied
Twenty advanced lines of durum wheat genotypes used as treatments (Table 1) were
collected from RARS, Nepalgunj, Nepal which were originated from International Maize
and Wheat Improvement Center (CIMMYT), Mexico.
2.2 Description of Experimental Area, Design and Practices
Forestry University, Chitwan, Nepal in 2015 and 2016. Geographic location is 27°38' 50.92' 'N, 84°20' 49.43' 'E; 27°38'51. 35 ''N, 84°27'51.62''E; 27°38'50.54''N, 84°20'51.99''E and 27°38'50.01''N, 84°20'49.85''. The elevation is 228 meters above sea level. The area is characterized as the subtropical climate with unimodal rainfall pattern. The experimental design was randomized complete block (RCB) design with three replications and twenty treatments (20 durum genotypes). The unit plot was 4 m2 in 2015 and 6 m2 in 2016 in an area with 6 and 8 rows respectively at 25 cm spacing. The twenty genotypes used as treatments were grown under an irrigated condition at normal sowing period in November. 120 kg/ha seed rate was used in the
experiment. The dose of chemical fertilizer applied was 120:60:60 N:P:K kg/ha.
Supplement irrigation was given at crown root initiation stage, anthesis stage and milking stage. All other agronomic management practices were done as recommended for wheat production in Nepal.
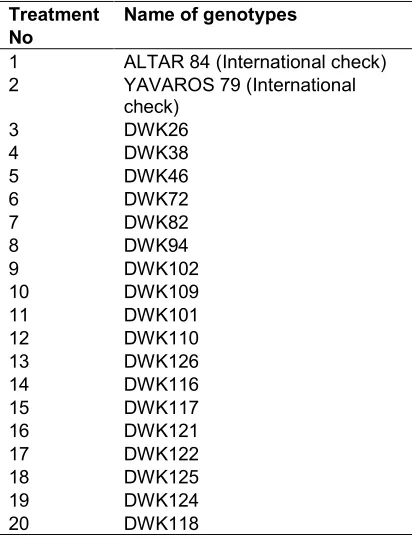
Table 1. Advanced line durum genotypes used as plant materials in this study
Treatment No
Name of genotypes
1 ALTAR 84 (International check)
2 YAVAROS 79 (International
check)
3 DWK26
4 DWK38
5 DWK46
6 DWK72
7 DWK82
8 DWK94
9 DWK102
10 DWK109
11 DWK101
12 DWK110
13 DWK126
14 DWK116
15 DWK117
16 DWK121
17 DWK122
18 DWK125
19 DWK124
20 DWK118
2.3 The Traits Recorded
The data were collected from each plot on 15 quantitative characters, namely grain yield
(GYLD), biological yield (BYLD) flag leaf area (FLA), grain number per spike (GNPS), flag leaf duration (FLD), spike length (SPKL), plant height (HT), peduncle length (PDNL), 1000-kernel weight (TKW), test weight (TW), days to heading (DTH), days to maturity (DTM), harvest index (HI),
grain filling rate (GFR) and chlorophyll content (SPAD).
Calculation of grain yield, 1000-kernel weight and test weight were done in 12% grain moisture basis. Biological yield was recorded by weighing the above-ground mass of the whole plant including spikes after drying infield for three days. Randomly selected ten plants were tagged for the observation of grain number per spike, plant height and peduncle length. Flag leaf area of plant was measured at the time of dough stage. It was measured by using Easy leaf area software that uses digital images scanned by camera [10]. Peduncle length was taken from the point of flag leaf blade extrusion to base of spike. Plant height was taken from the ground level to the top of spike without awn. Days to heading were recorded when 50% of the plants in a plot had spike emerged from boot. Similarly, for days to maturity, the date was recorded when more than 50% of peduncle color were changed to yellow straw color. Harvest index was estimated by dividing the grain yield of the plot by biological
yield of that plot. Grain filling rate was calculated by dividing the grain weight with grain
filling period. SPAD reading was taken at booting stage with a hand-held chlorophyll meter called Soil Plant Analysis and Development (SPAD) meter (model SPAD-502; Minolta Corp., Ramsey, N.J.).
2.4 Weather Conditions
The field received 46.9 mm and 118 mm rainfall in 2015 and 2016 during the period of the experiment, respectively. Maximum temperature was recorded in April (37.36°C in 2015 and 33.3°C in 2016) and minimum in January (8.77°C in 2015 and 3.6°C in 2016). Soil was sandy loam with pH 6.11 and 5.73 in 2015 and 2016 respectively.
2.5 Statistical Procedure
Table 2. Form of variance analysis for RCB design with genotype × year interaction
Source Degree of freedom Mean square F- ratio p-value
Replication y(r-1)
Year (y-1)
Genotype (g-1) M3 M3/M1
Genotype × year (g-1)(y-1) M2 M2/M1
Error y(g-1)(r-1) M1
y, r and g are the number of year, replications and genotypes. M1, M2, and M3 are the observed value of various
mean squares.
Table 3. Estimation of variance components and method of determination
Variance Components Method of determination
Genotype Vg (M3-M2)/yr
Genotype × year Vgy (M2-M1)/r
Error Ve M1
Vg, Vgy and Ve are components of variance for genotypes, genotype × year and error respectively
2.5.1 Genetic variability and heritability
Phenotypic and genotypic variance were calculated as [11] (Table 3).
Phenotypic variances (Vp) was derived as follows:
Vp =Vg+ Vgy/y + Ve/(yr) (1)
where y, g and yr are number of year, genotype and replication.
Phenotypic coefficient of variation (PCV) = Phenotypic variance
Mean value of the trait*100 (2)
Genotypic coefficient of variation (GCV) = Genotypic variance
Mean value of the trait*100 (3)
Heritability (H2) = Genotypic variance
Phenotypic variance*100 [13] (4)
Genetic advance as percentage of mean
(GA%) = K*H2* Phenotypic variance
Mean value of the trait*100 [13] (5)
Where,
K = selection intensity (5%= 2.06) H2 = broad sense heritability
2.5.2 Phenotypic and Genotypic correlation study
Phenotypic and Genotypic correlation study were carried out as described by [14].
rg = Covg 1.2
σ2 g1* σ2g2
(6)
rg = Genotypic correlation coefficient Covg 1.2 = Genotypic covariance of traits 1 & 2 g2 1 = Genotypic variance of trait 1. g2 2 = Genotypic variance of traits 2.
rp = Covp 1.2
σ2 1* σ2 p2
(7)
rp = Phenotypic correlation coefficient
Covp 1.2 = Phenotypic covariance of traits 1 & 2 p2 1 = Phenotypic variance of trait 1.
p2 2 = Phenotypic variance of traits 2.
The significance of correlation of both phenotypic and genotypic was tested with the formula adopted by [15]
t = r
SE (r) (8)
where, SE (r) =
√ (9)
where,
r = correlation coefficient between the variables n = number of genotypes
Then calculated ‘t’ – value was compared with standard t- value table at n-2 degrees of freedom and α levels of probability (where α is 0.05 and 0.01).
2.5.3 Path coefficient analysis
correlation of traits [16]. Sixteen traits were entered as predictor for yield in path analysis that estimated their direct and indirect effect on dependent variable yield.
r10 = P10 + P20r12 + P30r13 +……. + P0ir1i (10)
r20 = P10r21+ P20 + P30r23 +…….. + P0ir2i (11)
: : : :
: : : :
ri0 = P10ri1+ P20ri2 + P30ri3 +…….. + Pi0 (12)
where,
r10, r20, …, ri0 = genotypic correlation of independent variables (1, 2, …. i) with dependent variable (0)
r11, r12, …. rii = genotypic correlation between independent variables (1-1, 1-2, …….i-i ) P10, P20, ……Pi0 = components of direct effects of the independent variable (0) on dependent variables (1, 2, …. i)
Residual was calculated as,
R = 1- (P102+P202 +…. + Pi02) – 2[P10*P20*r12+ P10*P30*r13+………+P(i-1)0*Pi0*r(i-1)i] (13)
3. RESULTS
Significance of variance analysis of genotypes and genotype × year interactions are presented in Tables 4 and 5. All the traits revealed high significant difference among the genotypes in the mean value. Variances due to genotype × year interaction were found non-significant for grain
yield, biological yield, harvest index, flag leaf area, test weight, spike length, plant height and peduncle length, and value of variance due to genotype × year in these traits were found very small compared to genotypic variance (Table 6).
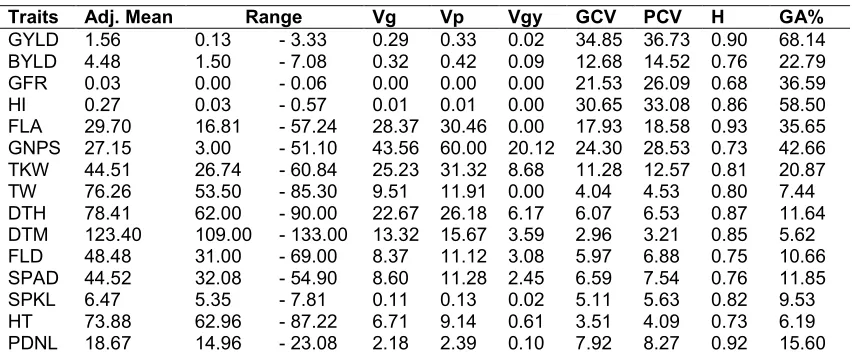
Coefficient of variation was found high in grain filling rate (24.34%), grain yield (24.25%), grain number per spike (22.78%) and harvest index (22.14%). Similar pattern was seen in genotypic and phenotypic coefficient of variation. Phenotypic coefficient of variations were found higher than genotypic coefficient of variations in all traits with narrow difference. Highest genotypic and phenotypic variance was obtained for grain yield that was followed by harvest index. Lowest genotypic and phenotypic variance was obtained for days to maturity. All the investigated traits showed more than 50% of variation because of genetic variation due to which heritability were found high in all traits. Highest heritability was obtained for flag leaf area (0.93) which was followed by peduncle length (0.92), grain yield (0.90), days to heading (0.87), harvest index (0.86), days to maturity (0.85), spike length (0.82) and 1000 kernel weight (0.81). Grain yield, harvest index and flag leaf area showed high heritability with high genetic advance. Similarly, grain number per spike, grain filling rate, 1000 kernels weight and biological yield had moderate heritability associated with high genetic advance. On the other hand, test weight, days to heading, days to maturity, spike length, peduncle length, chlorophyll content, flag leaf duration and plant height revealed the high heritability with low genetic advance.
Table 4. Analysis of variance for studied traits of durum genotypes
Traits
GYLD BYLD GFR HI FLA GNPS TKW TW
Genotype significance (P value) 0.000 0.003 0.016 0.000 0.000 0.000 0.001 0.001 G×Y significance (P value) 0.322 0.115 0.021 0.061 1.000 0.002 0.000 1.000
CV% 24.25 13.48 24.34 22.14 13.15 22.78 7.44 5.19
G = genotype, Y= year, CV= coefficient of variation, GYLD= grain yield, BYLD= biological yield, GFR= grain filling rate, HI= harvest index, FLA= flag leaf area, GNPS= grain number per spike, TKW= thousand kernels weight,
TW= test weight
Table 5. Analysis of variance for studied traits of durum genotypes
Traits
DTH DTM FLD SPAD SPKL HT PDNL
Genotype significance (P value) 0.000 0.000 0.003 0.000 0.000 0.000 0.000
G×Y significance (P value) 0.000 0.000 0.015 0.050 0.105 0.395 0.424
CV% 2.11 1.52 5.57 6.82 4.41 5.00 5.12
G = genotype, Y= year, CV= coefficient of variation, DTH= days to heading, DTM= days to maturity, FLD= flag leaf duration, SPAD= chlorophyll content of flag leaf, SPKL= spike length, HT= plant height, PDNL= peduncle
Table 6. Estimates of genetic parameters for 15 traits of durum genotypes
Traits Adj. Mean Range Vg Vp Vgy GCV PCV H GA%
GYLD 1.56 0.13 - 3.33 0.29 0.33 0.02 34.85 36.73 0.90 68.14
BYLD 4.48 1.50 - 7.08 0.32 0.42 0.09 12.68 14.52 0.76 22.79
GFR 0.03 0.00 - 0.06 0.00 0.00 0.00 21.53 26.09 0.68 36.59
HI 0.27 0.03 - 0.57 0.01 0.01 0.00 30.65 33.08 0.86 58.50
FLA 29.70 16.81 - 57.24 28.37 30.46 0.00 17.93 18.58 0.93 35.65
GNPS 27.15 3.00 - 51.10 43.56 60.00 20.12 24.30 28.53 0.73 42.66
TKW 44.51 26.74 - 60.84 25.23 31.32 8.68 11.28 12.57 0.81 20.87
TW 76.26 53.50 - 85.30 9.51 11.91 0.00 4.04 4.53 0.80 7.44
DTH 78.41 62.00 - 90.00 22.67 26.18 6.17 6.07 6.53 0.87 11.64
DTM 123.40 109.00 - 133.00 13.32 15.67 3.59 2.96 3.21 0.85 5.62
FLD 48.48 31.00 - 69.00 8.37 11.12 3.08 5.97 6.88 0.75 10.66
SPAD 44.52 32.08 - 54.90 8.60 11.28 2.45 6.59 7.54 0.76 11.85
SPKL 6.47 5.35 - 7.81 0.11 0.13 0.02 5.11 5.63 0.82 9.53
HT 73.88 62.96 - 87.22 6.71 9.14 0.61 3.51 4.09 0.73 6.19
PDNL 18.67 14.96 - 23.08 2.18 2.39 0.10 7.92 8.27 0.92 15.60
Adj= adjusted, Vg= genotypic variance, Vp= phenotypic variance, Vgy= genotype × year variance, GCV= genotypic coefficient of variation, PCV= phenotypic coefficient of variation, H= broad sense heritability, GA%=
genetic advance as % of mean
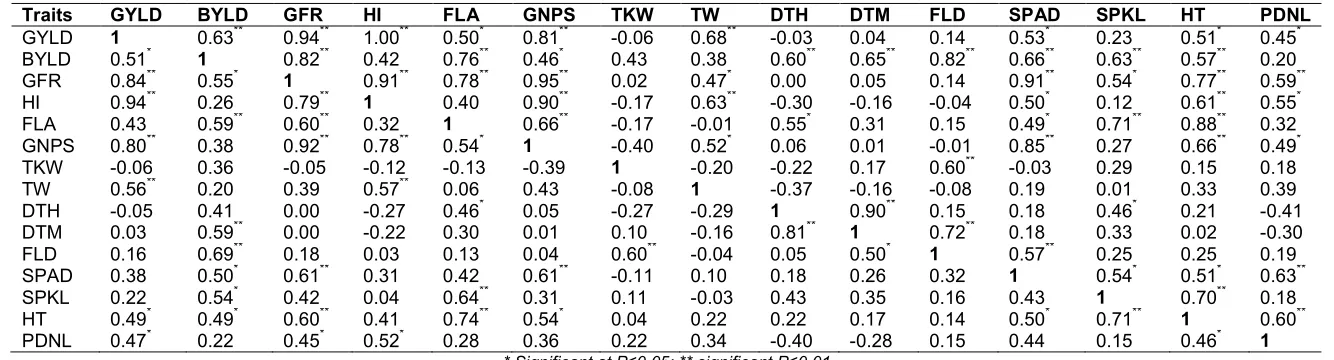
The results of genotypic and phenotypic correlation among studied traits are shown in Table 7. Among fourteen studied yield components, nine traits showed positive significant genotypic and seven traits showed phenotypic correlation with grain yield. Harvest index, grain filling rate and grain number per spike showed highest genotypic correlation with grain yield that were followed by test weight, biological yield, chlorophyll content of flag leaf, plant height, flag leaf area and peduncle length. Flag leaf area and chlorophyll content of flag leaf though had significant correlation with grain yield in genotypic level had non-significant association with yield in phenotypic level. Days to maturity and flag leaf duration had positive and significant correlation with biological yield but non-significant correlation with grain yield. Similarly, grain filling rate and grain number per spike were found highly correlated with chlorophyll content of the flag leaf, plant height and flag leaf area at both levels.
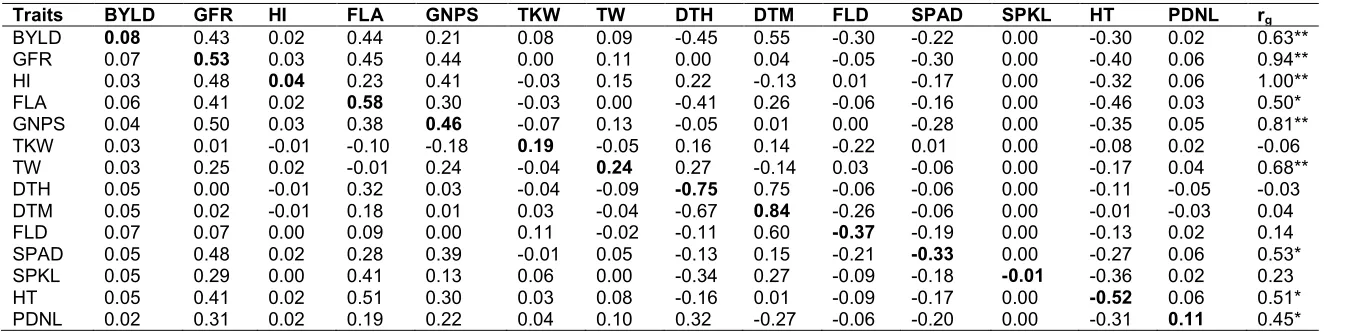
The direct and indirect effect of the yield component on grain yield is presented in Table 8. The residual effect was found 0.0117. In the results of path coefficient analysis, days to maturity (0.84) followed by flag leaf area (0.58), grain filling rate (0.53) and grain number per spike (0.46) had highest direct effect on grain yield. Among which, days to maturity had non-significant correlation with grain yield. The maximum positive direct effect of days to maturity on grain yield was counter balanced by the indirect effects via days to heading and flag leaf duration rendering weak genotypic
7
Table 7. Genotypic (above the diagonal) and phenotypic (below the diagonal) correlation coefficients among grain yield and yield attributing traits of durum wheat
Traits GYLD BYLD GFR HI FLA GNPS TKW TW DTH DTM FLD SPAD SPKL HT PDNL
GYLD 1 0.63** 0.94** 1.00** 0.50* 0.81** -0.06 0.68** -0.03 0.04 0.14 0.53* 0.23 0.51* 0.45*
BYLD 0.51* 1 0.82** 0.42 0.76** 0.46* 0.43 0.38 0.60** 0.65** 0.82** 0.66** 0.63** 0.57** 0.20
GFR 0.84** 0.55* 1 0.91** 0.78** 0.95** 0.02 0.47* 0.00 0.05 0.14 0.91** 0.54* 0.77** 0.59**
HI 0.94** 0.26 0.79** 1 0.40 0.90** -0.17 0.63** -0.30 -0.16 -0.04 0.50* 0.12 0.61** 0.55*
FLA 0.43 0.59** 0.60** 0.32 1 0.66** -0.17 -0.01 0.55* 0.31 0.15 0.49* 0.71** 0.88** 0.32
GNPS 0.80** 0.38 0.92** 0.78** 0.54* 1 -0.40 0.52* 0.06 0.01 -0.01 0.85** 0.27 0.66** 0.49*
TKW -0.06 0.36 -0.05 -0.12 -0.13 -0.39 1 -0.20 -0.22 0.17 0.60** -0.03 0.29 0.15 0.18
TW 0.56** 0.20 0.39 0.57** 0.06 0.43 -0.08 1 -0.37 -0.16 -0.08 0.19 0.01 0.33 0.39
DTH -0.05 0.41 0.00 -0.27 0.46* 0.05 -0.27 -0.29 1 0.90** 0.15 0.18 0.46* 0.21 -0.41
DTM 0.03 0.59** 0.00 -0.22 0.30 0.01 0.10 -0.16 0.81** 1 0.72** 0.18 0.33 0.02 -0.30
FLD 0.16 0.69** 0.18 0.03 0.13 0.04 0.60** -0.04 0.05 0.50* 1 0.57** 0.25 0.25 0.19
SPAD 0.38 0.50* 0.61** 0.31 0.42 0.61** -0.11 0.10 0.18 0.26 0.32 1 0.54* 0.51* 0.63**
SPKL 0.22 0.54* 0.42 0.04 0.64** 0.31 0.11 -0.03 0.43 0.35 0.16 0.43 1 0.70** 0.18
HT 0.49* 0.49* 0.60** 0.41 0.74** 0.54* 0.04 0.22 0.22 0.17 0.14 0.50* 0.71** 1 0.60**
PDNL 0.47* 0.22 0.45* 0.52* 0.28 0.36 0.22 0.34 -0.40 -0.28 0.15 0.44 0.15 0.46* 1
8
Table 8. Estimates of genotypic path coefficient (direct effect - bolded diagonal and indirect effect- off diagonal) of different characters on grain yield of durum wheat
Traits BYLD GFR HI FLA GNPS TKW TW DTH DTM FLD SPAD SPKL HT PDNL rg
BYLD 0.08 0.43 0.02 0.44 0.21 0.08 0.09 -0.45 0.55 -0.30 -0.22 0.00 -0.30 0.02 0.63**
GFR 0.07 0.53 0.03 0.45 0.44 0.00 0.11 0.00 0.04 -0.05 -0.30 0.00 -0.40 0.06 0.94**
HI 0.03 0.48 0.04 0.23 0.41 -0.03 0.15 0.22 -0.13 0.01 -0.17 0.00 -0.32 0.06 1.00**
FLA 0.06 0.41 0.02 0.58 0.30 -0.03 0.00 -0.41 0.26 -0.06 -0.16 0.00 -0.46 0.03 0.50*
GNPS 0.04 0.50 0.03 0.38 0.46 -0.07 0.13 -0.05 0.01 0.00 -0.28 0.00 -0.35 0.05 0.81**
TKW 0.03 0.01 -0.01 -0.10 -0.18 0.19 -0.05 0.16 0.14 -0.22 0.01 0.00 -0.08 0.02 -0.06
TW 0.03 0.25 0.02 -0.01 0.24 -0.04 0.24 0.27 -0.14 0.03 -0.06 0.00 -0.17 0.04 0.68**
DTH 0.05 0.00 -0.01 0.32 0.03 -0.04 -0.09 -0.75 0.75 -0.06 -0.06 0.00 -0.11 -0.05 -0.03
DTM 0.05 0.02 -0.01 0.18 0.01 0.03 -0.04 -0.67 0.84 -0.26 -0.06 0.00 -0.01 -0.03 0.04
FLD 0.07 0.07 0.00 0.09 0.00 0.11 -0.02 -0.11 0.60 -0.37 -0.19 0.00 -0.13 0.02 0.14
SPAD 0.05 0.48 0.02 0.28 0.39 -0.01 0.05 -0.13 0.15 -0.21 -0.33 0.00 -0.27 0.06 0.53*
SPKL 0.05 0.29 0.00 0.41 0.13 0.06 0.00 -0.34 0.27 -0.09 -0.18 -0.01 -0.36 0.02 0.23
HT 0.05 0.41 0.02 0.51 0.30 0.03 0.08 -0.16 0.01 -0.09 -0.17 0.00 -0.52 0.06 0.51*
PDNL 0.02 0.31 0.02 0.19 0.22 0.04 0.10 0.32 -0.27 -0.06 -0.20 0.00 -0.31 0.11 0.45*
4. DISCUSSION
For the crop improvement, it is desired to have high variation in the crop resources that enables plant breeders to create novel plant gene combinations which help to select more suited crop varieties to the needs of diverse agricultural systems [17]. All the traits, in this study, revealed large variation. Variation due to genotype was found very high as compare to variance due to genotype × year effect in most of the traits. For adaptability and stability of traits over a period of time, assessment of genotypic and genotype × year variance is suitable [18]. In the present investigation, grain yield, biological yield, harvest index, flag leaf area, test weight, spike length, plant height and peduncle length revealed significantly no differences in genotype × year interaction and very low variation due to it. This implies that these traits were consistence in performance for both years which is of great importance in a breeding program. For other traits, it seems that further study is required to ascertain the stability of performances.
The coefficient of phenotypic variation was found slightly higher than the coefficient of genotypic variation. The narrow difference between the coefficient of genotypic and phenotypic variation was also found in other studies [18-20]. This indicates the less influence of environmental effect in expression of phenotype of traits. This means that these traits have immense inherent variability that remains unaltered by environmental conditions, which is of great value for exploitation in selection and hybridization programs [21]. Although these coefficients of variation revealed the extent of genetic and phenotypic variability present in the traits, these do not provide the full scope to assess the variation that is heritable. Thus, selection efficiency is related to the magnitude of heritability and genetic advance [22]. In this study, high heritability (>80%) were obtained for grain yield, harvest index, 1000 kernels weight, test weight, flag leaf area, days to heading, days to maturity, spike length and peduncle length. [19] also found high heritability in days to heading, test weight and thousand kernels weight. [18] found high heritability in spike length. [23] also obtained the similar results for spike length and 1000 kernels weight. High broad sense heritability gives an idea of total variation ascribable to genotypic effects, which are exploitable portion of variation. This means that selection of these characters would be more effective as compare to others.
However, heritability along doesn’t indicate high genetic gain. Knowledge of heritability together with genetic advance is necessary to consider the selection of traits [18]. High heritability associated with high genetic advance of traits indicates the influence of additive gene [24]. Grain yield, harvest index, flag leaf area, grain number per spike, grain filling rate, 1000 kernels weight and biological yield had considerably high heritability coupled with high genetic advance. Transgressive segregants may be looked for these traits while selecting for high yielding genotypes in early segregating generations. On the other hand, traits with high heritability and low genetic advance indicate the effect of dominance and epistatic gene action [18]. Therefore, for test weight, days to heading, days to maturity, spike length, peduncle length, chlorophyll content, flag leaf duration and plant height early selection is not judicious. Similar results for grain number per spike and spike length was found in a study of [18]. [24] also reported the similar results for plant height, grain number per spike and 1000 kernel weight.
positive and significant correlation of peduncle length with grain yield and [30] in bread wheat found non-significant but positive correlation at both levels which also supported the finding of this study. Days to maturity and flag leaf duration had positive and significant correlation with biological yield but the non-significant correlation with grain yield. This indicates that late maturity genotypes with long stay green at normal condition only increases the biomass of plant but not to the grain yield. Similarly, grain filling rate and grain number per spike were found highly correlated with chlorophyll content of the flag leaf, plant height and flag leaf area at both levels. It was surprising that 1000 kernels weight was found non-significantly correlated with grain yield in durum which was also found in some other studies [19,31,32]. This could be because of source-sink balance. The crops might have passed through source limited condition at late grain filling period due to which spike with low grain number might have high grain weight and vice-versa. To ascertain the causes further study is required.
The path coefficient analysis provides information about the contribution of various yield components to grain yield in the genotypes under study. It is an effective way to partition the relative contribution of components of yield via standardized partial regression coefficients [33, 34]. This provides an effective way of finding out direct and indirect effect on correlation of the traits. In the results, days to maturity revealed highest path coefficient though had non-significant correlation with grain yield. This agrees with the findings of [23] and [35]. Days to heading and flag leaf duration were the cause to render weak correlation of days to maturity with grain yield. Behind days to maturity, flag leaf area, grain filling rate and grain number per spike showed high direct effect with high genetic correlation on grain yield. In path coefficient study, it was found that grain filling rate, flag leaf area and grain number per spike had indirect support for each other to provide high direct effect on and genotypic correlation with grain yield. For other traits which were found significant and positively correlated at genotypic level with negative or small direct effects like chlorophyll content of flag leaf, plant height, harvest index and biological yield were also indirectly influenced by flag leaf area, grain filling rate and grain number per spike. So, it is better to select these three important traits which had high positive correlation with grain yield that indirectly exert the performance of harvest index,
biological yield, chlorophyll content of flag leaf and plant height.
5. CONCLUSION
All the traits observed in the study revealed the existence of considerable variations among durum wheat genotypes that can be utilized in effective selection for breeding plan. Variation due to genotype × year was found considerably very small as compared to genotypic variation. Therefore, heritability estimates of traits were found high. The high heritability with low variation due to genotype × year interaction in most of the important traits implies that traits are inherited quantitatively. In this study, grain filling rate, grain number per spike and flag leaf area showed high heritability coupled with high genetic advance as percentage of mean, significant positive genotypic correlation and high positive direct effect. These traits are, therefore, the key contributors to grain yield and should be focused on crop improvement program for increasing grain yield.
ACKNOWLEDGEMENTS
The authors express the gratitude towards Agriculture and Forestry University for providing fund with research field and Regional Agriculture Research Station, Khajura, Nepal for the
provision of durum genotypes. Agriculture and Botany Division, NARC is acknowledged for providing technical aspects for research workout.
COMPETING INTERESTS
Authors have declared that no competing interests exist.
REFERENCES
1. United Nations Statistics Division; 2017. Available:http://data.un.org/Data.aspx?d=C omTrade&f=_l1Code%3a11
[Cited 2017 May 25]
2. NARC. Kathmandu, Nepal: Agricultural Botany Division, Nepal Agricultural Research Council; 2014.
3. NARC. Kathmandu, Nepal: Agricultural Botany Division, Nepal Agricultural Research Council; 2011.
Winter Crops Workshop June 11-12, 2014.; RARS, NARC Lumle, Nepal. 2014. 5. Cantrell RG. Breeding and genetics of
durum wheat. In: Janick J, editor. Plant Breeding Reviews: John Wiley & Sons, Inc. 1987;11-40.
6. Marti J, Slafer GA. Bread and durum wheat yields under a wide range of environmental conditions. Field Crops Research. 2014; 156:258-71.
7. Dewey DR, Lu KH. A correlation and path-coefficient analysis of components of crested wheatgrass seed production. Agronomy Journal. 1959;51(9):515-8. 8. Sabit Z, Yadav B, Rai P. Genetic
variability, correlation and path analysis for yield and its components in f5 generation of bread wheat (Triticum aestivum L.). Journal of Pharmacognosy and Phyto-chemistry. 2017;6(4):680-7.
9. Tukey JW. Causation, segregation and path analysis of causal path. Biometrics. 1954;15:236-58.
10. Easlon HM, Bloom AJ. Easy Leaf Area: Automated digital image analysis for rapid and accurate measurement of leaf area. Applications in plant sciences. 2014; 2(7):1400033.
11. Toker C. Estimate of heritabilities and genotype by environment interactions for 100-seed weight, days to flowering and plant height in kabuli chickpeas (Cicer arietinum L.). Turkish J Field Crops. 1998;3:16-20.
12. Rasmusson D, Lambert J. Variety x environment interactions in barley variety tests. Crop Science. 1960;1:261-2.
13. Falconer DS, Mackey TFC. Introduction to quantitative genetics. U.K.: Longman Essex;1996.
14. Sing M, El‐Bizri KS. Phenotypic correlation: Its estimation and testing significance. Biometrical Journal. 1992; 34(2):165-71.
15. Sharma J. Statistical and biometrical techniques in plant breeding: New Age International Pvt Limited; 1998.
16. Bondari K. Path analysis in agricultural research; 1990.
17. Bhandari HR, Bhanu AN, Srivastava K, Singh MN, Shreya, Hemantaranjan A. Assessment of genetic diversity in crop plants - an overview. Advances in Plants & Agriculture Research. 2017;7(3):1-8. 18. Başçıftçi ZB, Kınacı G, Kınacı E. Genetic
variability and heritability association with spike yield and related characters in durum
wheat (Triticum durum (L.) Desf.). Journal of Food, Agriculture & Environment. 2013; 11(3&4):781-4.
19. Abinasa M, Ayana A, Bultosa G. Genetic variability, heritability and trait associations in durum wheat (Triticum turgidum L. var. durum) genotypes. African Journal of Agricultural Research. 2011;6(17):3972-9. 20. Al-Tabbal JA, Al-Fraihat AH. Heritability
studies of yield and yield associated traits in wheat genotypes. Journal of Agricultural Science. 2012;4(4):11-22.
21. Osman KA, Mustafa AM, Ali F, Yonglain Z, Fazhan Q. Genetic variability for yield and related attributes of upland rice genotypes in semi arid zone (Sudan). African Journal of Agricultural Research. 2012;7(33):4613-9.
22. Singh BD. Plant breeding: Principles and methods: Kalyani publishers; 2015. 23. Gashaw A, Mohammed H, Singh H.
Genotypic variability, heritability, genetic
advance and associations among
characters in Ethiopian durum wheat (Triticum durum desf.) accessions. East African Journal of Science. 2010;4(1):27-33.
24. Gupta S, Verma S. Variability, heritability and genetic advance under normal and rainfed conditions in durum wheat (Triticum durum Desf.). Indian Journal of Agricultural Research. 2000;34(2):122-5.
25. Falconer DS. Introduction to quantitative genetics: Pearson Education India; 1975. 26. Singh A, Singh S, Yasave S. Correlation
and path analysis in early generation. Indian J Genet. 1998;58(3):260-4.
27. Gashaw A, Mohammed H, Singh H. Selection criterion for improved grain yields in Ethiopian durum wheat genotypes. African Crop Science Journal. 2007;15(1). 28. Wolde T, Eticha F, Alamerew S, Assefa E,
Dutamo D, Mecha B. Trait associations in some durum wheat (Triticum durum L.) accessions among yield and yield related traits at Kulumsa, South Eastern Ethiopia.
Advances in Crop Science and
Technology. 2016;2016.
29. Azimi AM, Marker S, Bhattacharjee I. Genotypic and phenotypic variability and correlation analysis for yield and its components in late sown wheat (Triticum aestivum L.). Journal of Pharmacognosy and Phytochemistry. 2017;6(4):167-73. 30. Gelalcha S, Hanchinal RR. Correlation and
(Triticum aestivum L.) genotypes under irrigated condition in Southern India. African Journal of Agricultural Research. 2013;8(24):3186-92.
31. Mohammadi M, Sharifi P, Karimizadeh R, Shefazadeh MK. Relationships between
grain yield and yield components in bread wheat under different water
availability (dryland and supplemental irrigation conditions). Notulae Botanicae Horti Agrobotanici Cluj-Napoca. 2012; 40(1):195.
32. Van Ginkel M, Calhoun DS, Gebeyehu G, Miranda A, Tian-You C, Lara RP, et al.
Plant traits related to yield of wheat in early, late, or continuous drought conditions. Euphytica. 1998;100(1-3):109-21.
33. Li CC. Path analysis-a primer. The Boxwood Press; 1975.
34. Williams WA, Demment MW, Jones MB. A concise table for path analysis statistics. Agronomy Journal. 1990;82(5):1022-4. 35. Joshi BK, Mudwari A, Thapa DB.
Correlation and path coefficients among quantitative traits in wheat (Triticum aestivum L.). Nepal Journal of Science and Technology. 2008;9:1-5.
_________________________________________________________________________________
© 2018 Adhikari et al.; This is an Open Access article distributed under the terms of the Creative Commons Attribution License (http://creativecommons.org/licenses/by/4.0), which permits unrestricted use, distribution, and reproduction in any medium, provided the original work is properly cited.
Peer-review history: