R E S E A R C H
Open Access
Error and bias in under-5 mortality estimates
derived from birth histories with small sample
sizes
Laura Dwyer-Lindgren
*, Emmanuela Gakidou, Abraham Flaxman and Haidong Wang
Abstract
Background: Estimates of under-5 mortality at the national level for countries without high-quality vital registration systems are routinely derived from birth history data in censuses and surveys. Subnational or stratified analyses of under-5 mortality could also be valuable, but the usefulness of under-5 mortality estimates derived from birth histories from relatively small samples of women is not known. We aim to assess the magnitude and direction of error that can be expected for estimates derived from birth histories with small samples of women using various analysis methods.
Methods: We perform a data-based simulation study using Demographic and Health Surveys. Surveys are treated as populations with known under-5 mortality, and samples of women are drawn from each population to mimic surveys with small sample sizes. A variety of methods for analyzing complete birth histories and one method for analyzing summary birth histories are used on these samples, and the results are compared to corresponding true under-5 mortality. We quantify the expected magnitude and direction of error by calculating the mean error, mean relative error, mean absolute error, and mean absolute relative error.
Results: All methods are prone to high levels of error at the smallest sample size with no method performing better than 73% error on average when the sample contains 10 women. There is a high degree of variation in performance between the methods at each sample size, with methods that contain considerable pooling of information generally performing better overall. Additional stratified analyses suggest that performance varies for most methods according to the true level of mortality and the time prior to survey. This is particularly true of the summary birth history method as well as complete birth history methods that contain considerable pooling of information across time.
Conclusions: Performance of all birth history analysis methods is extremely poor when used on very small samples of women, both in terms of magnitude of expected error and bias in the estimates. Even with larger samples there is no clear best method to choose for analyzing birth history data. The methods that perform best overall are the same methods where performance is noticeably different at different levels of mortality and lengths of time prior to survey. At the same time, methods that perform more uniformly across levels of mortality and lengths of time prior to survey also tend to be among the worst performing overall.
Background
Under-5 mortality, the probability of death before age 5
(denoted 5q0), is an important overall indicator of child
health. In countries without functioning systems to con-tinuously register births and deaths, estimates of under-5 mortality are generally derived from survey and/or census data, particularly in the form of birth histories where
*Correspondence: [email protected]
Institute for Health Metrics and Evaluation, University of Washington, Seattle, WA, USA
women are asked for information about the survival of their children.
Birth history data are routinely used for estimating mor-tality at the national level. It is often of interest, however, to estimate under-5 mortality at a subnational level or to stratify by some other characteristic (e.g., income or maternal education). Subnational or stratified analyses with survey data are complicated by small sample sizes: in the case of surveys in particular, the sample size for a given subnational unit or stratum is often quite small,
and it is not apparent if the estimates derived from these limited data are useful. While a number of subnational analyses with birth history data have been undertaken using census data [1-3] where small sample sizes are less of a concern, existing subnational mortality estimates using survey data tend to be at a relatively coarse level (often provinces or regions) to avoid small samples [2,4].
Two different types of birth histories are routinely col-lected. In a complete birth history (CBH), women are asked for information about the date of birth and, if appli-cable, the age at death of each child they have given birth to. Because complete birth histories contain infor-mation about dates and ages for individual children they allow for direct calculation of under-5 mortality. In a sum-mary birth history (SBH), women are asked only about the total number of children they have given birth to and the number of these children who are still alive. Sum-mary birth histories lack information about dates and ages for individual children and demographic models must be employed to estimate under-5 mortality from these data. Although complete birth histories are more straightfor-ward to analyze they are less frequently undertaken than summary birth histories, which are far less labor-intensive and time-consuming to collect.
In this paper, we aimed to determine how much error and/or bias can be expected in under-5 mortality esti-mates derived from both types of birth histories at various small sample sizes. To this end, we carried out a data-based simulation study using Demographic and Health Survey (DHS) data wherein we treated each survey as a population with known mortality and sampled from this population to mimic surveys with small sample sizes. We examined how estimates derived from summary birth his-tory data and complete birth hishis-tory data (analyzed using several alternative methods) compared in terms of error and bias at increasingly small sample sizes. Further, we performed stratified analyses to explore in more detail how the performance of each method relates to the under-lying true level of mortality and the time prior to data collection.
Methods
Data
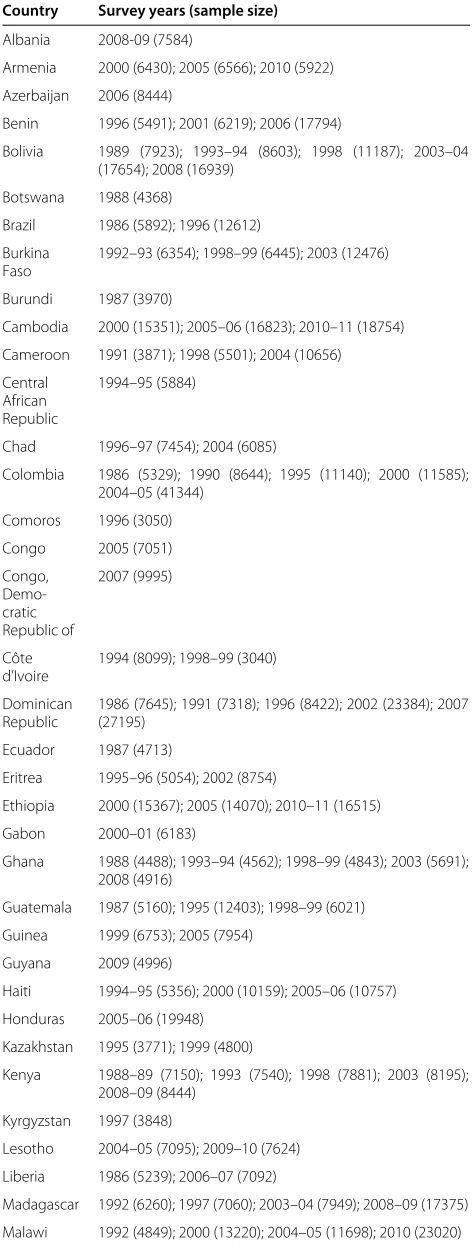
This analysis made use of all DHS [5] publicly avail-able as of May 2012 that contain birth histories for all women, regardless of marital status, a total of 152 surveys in 62 countries. Table 1 provides a full listing of all DHS included in this analysis.
Birth history methods Summary birth history method
We analyzed summary birth history data using updated models and methods described in Rajaratnam, et al. [6,7]. The combined version of the maternal age cohort, time
Table 1 Demographic and health surveys included in this analysis
Country Survey years (sample size)
Albania 2008-09 (7584)
Armenia 2000 (6430); 2005 (6566); 2010 (5922)
Azerbaijan 2006 (8444)
Benin 1996 (5491); 2001 (6219); 2006 (17794)
Bolivia 1989 (7923); 1993–94 (8603); 1998 (11187); 2003–04 (17654); 2008 (16939)
Botswana 1988 (4368)
Brazil 1986 (5892); 1996 (12612)
Burkina Faso
1992–93 (6354); 1998–99 (6445); 2003 (12476)
Burundi 1987 (3970)
Cambodia 2000 (15351); 2005–06 (16823); 2010–11 (18754)
Cameroon 1991 (3871); 1998 (5501); 2004 (10656)
Central African Republic
1994–95 (5884)
Chad 1996–97 (7454); 2004 (6085)
Colombia 1986 (5329); 1990 (8644); 1995 (11140); 2000 (11585); 2004–05 (41344)
Comoros 1996 (3050)
Congo 2005 (7051)
Congo, Demo-cratic Republic of
2007 (9995)
Côte d’Ivoire
1994 (8099); 1998–99 (3040)
Dominican Republic
1986 (7645); 1991 (7318); 1996 (8422); 2002 (23384); 2007 (27195)
Ecuador 1987 (4713)
Eritrea 1995–96 (5054); 2002 (8754)
Ethiopia 2000 (15367); 2005 (14070); 2010–11 (16515)
Gabon 2000–01 (6183)
Ghana 1988 (4488); 1993–94 (4562); 1998–99 (4843); 2003 (5691); 2008 (4916)
Guatemala 1987 (5160); 1995 (12403); 1998–99 (6021)
Guinea 1999 (6753); 2005 (7954)
Guyana 2009 (4996)
Haiti 1994–95 (5356); 2000 (10159); 2005–06 (10757)
Honduras 2005–06 (19948)
Kazakhstan 1995 (3771); 1999 (4800)
Kenya 1988–89 (7150); 1993 (7540); 1998 (7881); 2003 (8195); 2008–09 (8444)
Kyrgyzstan 1997 (3848)
Lesotho 2004–05 (7095); 2009–10 (7624)
Liberia 1986 (5239); 2006–07 (7092)
Madagascar 1992 (6260); 1997 (7060); 2003–04 (7949); 2008–09 (17375)
Table 1 Demographic and health surveys included in this
analysis(Continued..)
Mali 1987 (3200); 1995–96 (9704); 2001 (12849); 2006 (14583)
Mauritania 2000–01 (7728)
Moldova 2005 (7440)
Mozambique 1997 (8779); 2003 (12418)
Namibia 1992 (5421); 2000 (6755); 2006–07 (9804)
Nicaragua 1997–98 (13634); 2001 (13060)
Niger 1992 (6503); 1998 (7577); 2006 (9223)
Nigeria 1990 (8781); 2003 (7620); 2008 (33385)
Paraguay 1990 (5827)
Peru 1986 (4999); 1991–92 (15882); 1996 (28951); 2000 (27843); 2004–08 (41648)
Philippines 1998 (13983); 2003 (13633); 2008 (13594)
Rwanda 1992 (6551); 2000 (10421); 2005 (11321); 2007–08 (7313); 2010–11 (13671)
Sao Tome and Principe
2008–09 (2615)
Senegal 1986 (4415); 1992–93 (6310); 1997 (8593); 2005 (14602); 2010–11 (15688)
Sierra Leone
2008 (7374)
South Africa
1998 (11735)
Swaziland 2006–07 (4987)
Tanzania, United Republic of
1991–92 (9238); 1996 (8120); 1999 (4029); 2004–05 (10329); 2009–10 (10139)
Timor-Leste
2009–10 (13137)
Togo 1988 (3360); 1998 (8569)
Trinidad and Tobago
1987 (3806)
Uganda 1988–89 (4730); 1995 (7070); 2000–01 (7246); 2006 (8531)
Ukraine 2007 (6841)
Uzbekistan 1996 (4415)
Zambia 1992 (7060); 1996–97 (8021); 2001–02 (7658); 2007 (7146)
Zimbabwe 1988–89 (4201); 1994 (6128); 1999 (5907); 2005–06 (8907); 2010–11 (9171)
since first birth cohort, maternal age period, and time since first birth period methods was used to generate annual estimates for the 25 years preceding each survey.
Standard complete birth history method
To analyze complete birth history data we first expanded the record for each child such that there was a record of each month that a child lived and was observed under age 5: this will be less than the full 60 months if the child died before age 5 or if the mother was surveyed
before the child reached age 5. For each child-month of life we indicated whether the child was alive or dead at the end of the month and then assigned the child-month to the appropriate time period and age group. Time periods were non-overlapping and equally sized and were assigned starting at the time of the most recent survey and moving back in time. The ages considered were 0 months, 1–11 months, 12–23 months, 24–35 months, 36–47 months, and 48–59 months; these age groupings were designed such that mortality is expected to be reasonably constant across the age range. From these data we calculated the monthly probability of survival in each time period for each age group by calculating the proportion of child-months in a given time period and age group that end with the child alive. These monthly probabilities of sur-vival were converted to the probability of surviving the entire age interval under consideration by raising them to a power equal to the number of months in the age interval. Under-5 mortality was then calculated by sub-tracting from one the product of all of the age-specific survival probabilities. This process generated a single esti-mate of under-5 mortality for each time period which was then assigned to the midpoint of the period. Different length periods can be used, with longer periods providing more pooling of information across time but also produc-ing less frequent estimates. For this analysis, we tested periods of length one, two, and five years. It is possible to pool data from multiple surveys in the same country and estimate mortality from the combined data [8]. Except when explicitly stated otherwise, the non-pooled version of the complete birth history method is used throughout this analysis.
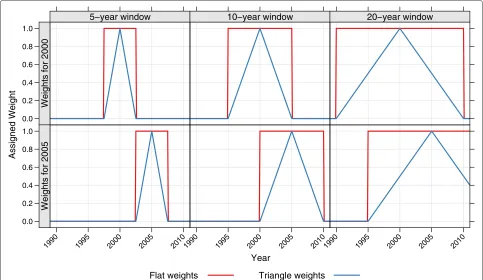
Moving window complete birth history method
As an alternative to the above, the same procedures were carried out except that instead of having non-overlapping time periods and generating one estimate per period, an estimate was generated for each year incorporating all data from a window around that year. This ‘mov-ing window’ method used each observed child-month multiple times and allowed for pooling of information across time while still producing annual estimates. For
each yearT, all child-months were weighted before
find-ing the monthly survival probability for each age group as described in the previous section. Two different kinds of weights were used. In one version, all data within the window were treated equally: for a window of length
x years, all child-months that occurred between x/2
years before time T and x/2 years after time T were
assigned a weight of 1, and all other child-months a weight of 0. We refer to these as ‘flat’ weights. In the second version, the weights decreased linearly with time
as child-months became further away from T, reaching
‘triangle’ weights. Different length windows can be used, with wider windows providing more pooling of infor-mation across time. For this analysis, we tested window lengths of five and 10 years for both variants and 20 years for the triangle-weighted variant. Figure 1 shows the weights that would be applied for estimates in 2000 (top row) and 2005 (bottom row) using a five-year, 10-year, or 20-year window (first, second, and third column, respectively).
Validation methods
We validate these birth history analysis methods using the following procedure:
1. For each survey, we calculated ‘true’ under-5 mortality by applying the standard method described above with two-year periods and then linearly interpolating to produce a continuous time-series. 2. Five hundred samples each of sizes 10, 50, 100, 500,
and 1,000 women were drawn without replacement from each survey, for a total of 2,500 samples from each survey.
3. Estimates of under-5 mortality were derived for each survey in each of the resulting 2,500 samples using
the summary birth history method and each of the complete birth history methods described above. 4. The estimates (5qˆ0) for each of the 2,500 samples
from each method were matched to the true under-5 mortality (5q0) by survey and year and then the error, relative error, absolute error, and absolute relative error were calculated as shown in Table 2 for each sample, method, survey, and year. The mean of each error metric was calculated for every sample size and method across all samples and surveys.
To illustrate this procedure further, Figure 2 shows examples of the birth history estimates generated from subsamples of one survey (Zambia, 2007). For each method and at three sample sizes (10, 100, and 1000) the birth history series derived from five of the sam-ples are shown alongside the ‘true’ mortality level (shown in black) as calculated from the full sample. Each of the error metrics is based on the comparison of the sample curves (in color) to the ‘true’ mortality curve (in black).
The mean error and mean relative error were intended to indicate whether or not estimates from a given method are biased: since over and underestimates cancel in these metrics, if methods are unbiased (that is, if overestimates
Year
Assigned Weight
0.0 0.2 0.4 0.6 0.8 1.0
5−year window
Weights for 2000
10−year window
Weights
for
2000
20−year window
Weights
for
2000
0.0 0.2 0.4 0.6 0.8 1.0
1990 1995 2000 2005 2010 5 year window
Weights for 2005
1990 1995 2000 2005 2010 10 year window
Weights
for
2005
1990 1995 2000 2005 2010 20 year window
Weights
for
2005
Flat weights Triangle weights
Table 2 Error metrics
Metric Formula Interpretation
Error 5q0−5q0 Measure of bias, in absolute terms.
Relative error 5q0−5q0
5q0 Measure of bias, in relative terms.
Absolute error |5q0−5q0| Measure of the magnitude of the difference between the estimates and true mortality, in absolute terms.
Absolute relative error 5q0−5q0 5q0
Measure of the magnitude of the difference between the estimates and true mortality, in relative terms.
and underestimates of the same magnitude are equally likely) the mean error and the mean relative error should be approximately zero. The mean absolute error and mean absolute relative error were intended to capture the extent to which estimates of under-5 mortality can differ from true under-5 mortality; these metrics measure the magni-tude of the error, regardless of the direction.
In addition to this overall analysis, we also carried out two stratified analyses. First, country-years were strati-fied by level of true mortality (<50, 50–100, 100–150, 150–200, >200 deaths per 1,000 births) and the mean of each of the above error metrics was calculated for each method and sample size for each set of country-years. Sec-ond, country-years were stratified by the time prior to the
survey, 0–1, 2–3, 4–5, ..., and 24–25 years prior to the sur-vey, and the mean of each of the above error metrics was calculated for each method and sample size for each set of country-years. These stratified analyses were meant to test if the methods perform consistently well at different levels of mortality and for different lengths of time prior to a survey.
Finally, in order to test how the performance of the complete birth history methods changes when multiple surveys are available and can be pooled, we repeated the above validation procedure on all countries with multi-ple surveys but pooled both across the survey data when calculating ‘true’ under-5 mortality in step 1 and when estimating birth histories from the 2,500 samples of each
Year
Under−5 Mortality (Deaths per 1,000)
0 200 400 600 800
0 200 400 600 800
0 200 400 600 800
198019851990199520002005198019851990199520002005198019851990199520002005198019851990199520002005198019851990199520002005198019851990199520002005198019851990199520002005198019851990199520002005198019851990199520002005
SBH CBH
[1yr]
CBH [2yr]
CBH [5yr]
MW CBH [5yr,F]
MW CBH [10yr,F]
MW CBH [5yr,T]
MW CBH [10yr,T]
MW CBH [20yr,T]
Size: 10 women
Size: 100 women
Size: 1000 women
Figure 2Example birth history estimates derived from samples of the Zambia 2007 survey.Each panel shows the ‘true’ under-5 mortality in Zambia (black line) and the under-5 mortality estimates from five samples from this survey. Each column corresponds to a different birth history method, while the rows correspond to the size of the sample (10, 100, and 1000 women). SBH=summary birth history; CBH=complete birth history; MW=moving window; F=flat weights; T=triangle weights; number in brackets gives period or window length.
survey in step 3. The 2,500 samples were still drawn at the survey level, so for a country with multiple surveys the final number of women is proportional to the number of surveys (e.g., when the sample size for each survey is 10, the total number of women for a given country will be 20 if there are two surveys available, 30 if there are three sur-veys available, and so on). Consequently, when calculating the mean of each error metric, we stratify by the number of surveys.
All analyses were carried out R, version 2.15.2 [9]. Code is available from the authors upon request.
Results
Overall performance
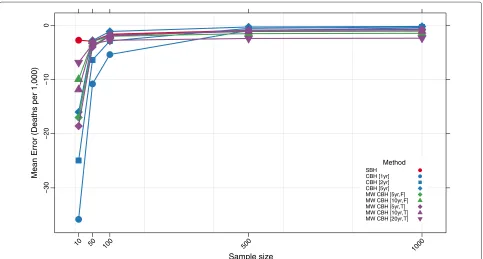
Figures 3, 4, 5, and 6 show the mean error, mean rela-tive error, mean absolute error, and mean absolute relarela-tive error, respectively, observed for each method at each sample size. Additional file 1: Table S1 also gives these values along with the corresponding 2.5th and 97.5th percentiles.
Overall, all methods are close to unbiased at sample sizes of at least 500, as measured by the mean error and mean relative error. At smaller sample sizes, however, the mean error and mean relative error for the standard com-plete birth history method becomes noticeably negative, suggesting that these methods tend to underestimate true mortality when sample sizes are small. This tendency is more pronounced when the period length used is smaller: the downward bias observed is more extreme for the one-year estimates than for the five-one-year estimates, which may reflect the greater pooling of information when longer period lengths are employed. The complete birth his-tory moving window methods follow a similar pattern and are progressively more negatively biased at smaller sample sizes. Similar to the standard methods, for the moving window methods the downward bias is more pro-nounced when window lengths are shorter. Additionally, for the same window length, there is slightly more down-ward bias in the triangle weights version than in the flat weights version. In contrast, the summary birth his-tory method appears to be almost unbaised even at small sample sizes.
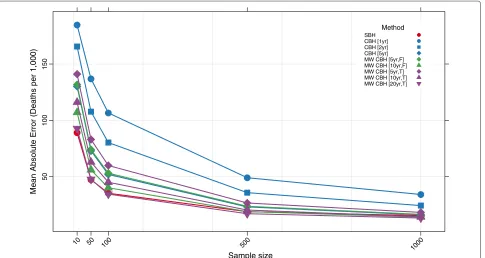
The mean absolute error and mean absolute relative error of all methods increases noticeably as the sample size decreases. No method performs better on average than 73% error at sample size 10, 40% error at sample size 50, or 29% error at sample size 100. Across all sample sizes there is an ordering of performance among the meth-ods, with moving window complete birth history methods and summary birth history methods generally perform-ing better than standard complete birth history methods. Additionally, within each class of methods, methods with more pooling (e.g., longer periods or windows) have lower error at each sample size than methods with less pooling.
Stratified by true mortality
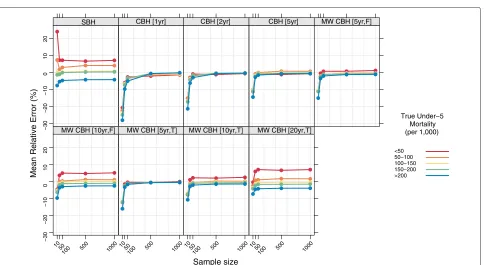
Figures 7, 8, 9, and 10 show the mean error, mean rela-tive error, mean absolute error, and mean absolute relarela-tive error, respectively, observed for each method at each sam-ple size stratified by true mortality level. Additional file 1: Table S2 also gives these values along with the corre-sponding 2.5th and 97.5th percentiles.
For all methods there are some differences in the mean error and mean relative error at different levels of mortal-ity. In general, there is a tendency to underestimate in high mortality settings and to overestimate in low-mortality settings. These differences are most pronounced for the summary birth history method and for the complete birth history methods with long (10- or 20-year) windows. For these methods, the differential is present at all sample sizes and is only slightly attenuated at higher sample sizes compared to the smallest sample sizes. For complete birth history methods with less smoothing, this pattern is less pronounced and is only present at sample sizes smaller than 500.
The magnitude of the error, as measured by the mean absolute error and mean absolute relative error, also varies by level of mortality for all methods. In relative terms (see Figure 10), performance is always poorer when true mortality is lower. This is true for all methods, but the differential is greater in some– notably the standard complete birth history method–than in others and, broadly speaking, increases in magni-tude as the sample size decreases. In non-relative terms (see Figure 9), the magnitude of the error is great-est when true mortality is higher. As with the relative measure, the differential in performance between low-and high-mortality situations is greatest for the stlow-andard complete birth history method and the moving win-dow birth history method with shorter winwin-dows. For all methods, this differential increases as the sample size decreases.
Stratified by time prior to survey
Figures 11, 12, 13, and 14 show the mean error, mean relative error, mean absolute error, and mean absolute relative error, respectively, observed for each method at each sample size stratified by time prior to survey. Addi-tional file 1: Table S3 also gives these values along with the corresponding 2.5th and 97.5th percentiles.
Sample size
Mean Error (Deaths per 1,000)
−30
−20
−10
0
10 50 100 500
1000
Method
SBH CBH [1yr] CBH [2yr] CBH [5yr] MW CBH [5yr,F] MW CBH [10yr,F] MW CBH [5yr,T] MW CBH [10yr,T] MW CBH [20yr,T]
Figure 3Mean error for all methods.Color of marker indicates the birth history method used; shape distinguishes different period or window lengths; SBH=summary birth history; CBH=complete birth history; MW=moving window; F=flat weights; T=triangle weights; number in brackets gives period or window length.
Sample size
Mean Relative Error (%)
−25
−20
−15
−10
−5
0
10 50 100 500
1000
Method
SBH CBH [1yr] CBH [2yr] CBH [5yr] MW CBH [5yr,F] MW CBH [10yr,F] MW CBH [5yr,T] MW CBH [10yr,T] MW CBH [20yr,T]
Sample size
Mean Absolute Error (Deaths per 1,000)
50
100
150
10 50 100 500
1000
Method
SBH CBH [1yr] CBH [2yr] CBH [5yr] MW CBH [5yr,F] MW CBH [10yr,F] MW CBH [5yr,T] MW CBH [10yr,T] MW CBH [20yr,T]
Figure 5Mean absolute error for all methods.Color of marker indicates the birth history method used; shape distinguishes different period or window lengths; SBH=summary birth history; CBH=complete birth history; MW=moving window; F=flat weights; T=triangle weights; number in brackets gives period or window length.
Sample size
Mean Absolute Relative Error (%)
50
100
10 50 100 500
1000
Method
SBH CBH [1yr] CBH [2yr] CBH [5yr] MW CBH [5yr,F] MW CBH [10yr,F] MW CBH [5yr,T] MW CBH [10yr,T] MW CBH [20yr,T]
Sample size
Mean Error (Deaths per 1,000)
−60
−40
−20
0
SBH CBH [1yr] CBH [2yr] CBH [5yr] MW CBH [5yr,F]
−60
−40
−20
0
1050
100 500 1000
MW CBH [10yr,F]
1050
100 500 1000
MW CBH [5yr,T]
1050
100 500 1000
MW CBH [10yr,T]
1050
100 500 1000
MW CBH [20yr,T]
True Under−5 Mortality (per 1,000)
<50 50−100 100−150 150−200 >200
Figure 7Mean error for all methods, stratified by true mortality level.Color indicates level of true mortality; each panel shows results for one particular method; SBH=summary birth history; CBH=complete birth history; MW=moving window; F=flat weights; T=triangle weights; number in brackets gives period or window length.
Sample size
Mean Relative Error (%)
−30
−20
−10
0
1
0
2
0
SBH CBH [1yr] CBH [2yr] CBH [5yr] MW CBH [5yr,F]
−30
−20
−10
0
1
0
2
0
1050
100 500 1000
MW CBH [10yr,F]
1050
100 500 1000
MW CBH [5yr,T]
1050
100 500 1000
MW CBH [10yr,T]
1050
100 500 1000
MW CBH [20yr,T]
True Under−5 Mortality (per 1,000)
<50 50−100 100−150 150−200 >200
Sample size
Mean Absolute Error (Deaths per 1,000)
0
5
0
100
150
200
250
SBH CBH [1yr] CBH [2yr] CBH [5yr] MW CBH [5yr,F]
05
0
100
150
200
250
1050
100 500 1000
MW CBH [10yr,F]
1050
100 500 1000
MW CBH [5yr,T]
1050
100 500 1000
MW CBH [10yr,T]
1050
100 500 1000
MW CBH [20yr,T]
True Under−5 Mortality (per 1,000)
<50 50−100 100−150 150−200 >200
Figure 9Mean absolute error for all methods, stratified by true mortality level.Color indicates level of true mortality; each panel shows results for one particular method; SBH=summary birth history; CBH=complete birth history; MW=moving window; F=flat weights; T=triangle weights; number in brackets gives period or window length.
Sample size
Mean Absolute Relative Error (%)
50
100
150
SBH CBH [1yr] CBH [2yr] CBH [5yr] MW CBH [5yr,F]
50
100
150
1050
100 500 1000
MW CBH [10yr,F]
1050
100 500 1000
MW CBH [5yr,T]
1050
100 500 1000
MW CBH [10yr,T]
1050
100 500 1000
MW CBH [20yr,T]
True Under−5 Mortality (per 1,000)
<50 50−100 100−150 150−200 >200
Sample size
Mean Error (Deaths per 1,000)
−80
−60
−40
−20
0
SBH CBH [1yr] CBH [2yr] CBH [5yr] MW CBH [5yr,F]
−80
−60
−40
−20
0
1050
100 500 1000
MW CBH [10yr,F]
1050
100 500 1000
MW CBH [5yr,T]
1050
100 500 1000
MW CBH [10yr,T]
1050
100 500 1000
MW CBH [20yr,T]
Time Prior to Survey (Years)
0−1 2−3 4−5 6−7 8−9 10−11 12−13 14−15 16−17 18−19 20−21 22−23 24−25
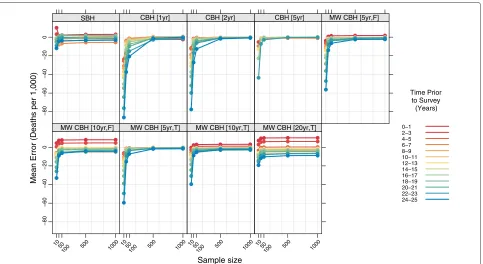
Figure 11Mean error for all methods, stratified by time prior to survey.Color indicates time prior to survey; each panel shows results for one particular method; SBH=summary birth history; CBH=complete birth history; MW=moving window; F=flat weights; T=triangle weights; number in brackets gives period or window length.
Sample size
Mean Relative Error (%)
−40
−20
0
SBH CBH [1yr] CBH [2yr] CBH [5yr] MW CBH [5yr,F]
−40
−20
0
1050
100 500 1000
MW CBH [10yr,F]
1050
100 500 1000
MW CBH [5yr,T]
1050
100 500 1000
MW CBH [10yr,T]
1050
100 500 1000
MW CBH [20yr,T]
Time Prior to Survey (Years)
0−1 2−3 4−5 6−7 8−9 10−11 12−13 14−15 16−17 18−19 20−21 22−23 24−25
Sample size
Mean Absolute Error (Deaths per 1,000)
0
50
100
150
200
SBH CBH [1yr] CBH [2yr] CBH [5yr] MW CBH [5yr,F]
0
5
0
100
150
200
1050
100 500 1000
MW CBH [10yr,F]
1050
100 500 1000
MW CBH [5yr,T]
1050
100 500 1000
MW CBH [10yr,T]
1050
100 500 1000
MW CBH [20yr,T]
Time Prior to Survey (Years)
0−1 2−3 4−5 6−7 8−9 10−11 12−13 14−15 16−17 18−19 20−21 22−23 24−25
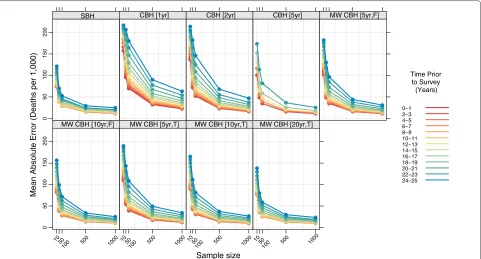
Figure 13Mean absolute error for all methods, stratified by time prior to survey.Color indicates time prior to survey; each panel shows results for one particular method; SBH=summary birth history; CBH=complete birth history; MW=moving window; F=flat weights; T=triangle weights; number in brackets gives period or window length.
Sample size
Mean Absolute Relative Error (%)
50
100
150
SBH CBH [1yr] CBH [2yr] CBH [5yr] MW CBH [5yr,F]
50
100
150
1050
100 500 1000
MW CBH [10yr,F]
1050
100 500 1000
MW CBH [5yr,T]
1050
100 500 1000
MW CBH [10yr,T]
1050
100 500 1000
MW CBH [20yr,T]
Time Prior to Survey (Years)
0−1 2−3 4−5 6−7 8−9 10−11 12−13 14−15 16−17 18−19 20−21 22−23 24−25
birth history methods, but while this pattern is consis-tent across sample sizes, there is not a clear ordering in terms of time periods. In contrast, for complete birth history methods with substantial smoothing (i.e., moving window versions with 10- or 20-year windows), there’s a prominent pattern of over predicting mortality in the most recent period and under predicting mortality in the most distant period. As with the summary birth histo-ries, this pattern is relatively consistent across sample sizes. For the complete birth history methods with less smoothing (i.e., windows and periods of no more than five years) there is little difference in mean error or mean rel-ative error at larger sample sizes, but at smaller sample sizes, the downward bias previously noted in the over-all analysis is increasingly concentrated in earlier time periods.
The magnitude of the error, as measured by mean abso-lute error and mean absoabso-lute relative error, varies by time prior to survey for all methods. In absolute terms, all methods perform better for more recent time periods than for more distant time periods. The difference is great-est for the standard complete birth history methods with one- or two-year periods and, in general, decreases as the amount of smoothing increases. The same general pattern is observed in relative terms for most methods, though the difference between the most recent time periods and time periods in the middle of the range are less obvious. In both cases the gap in magnitude of error between dif-ferent time periods is present at all sample sizes, though it gets somewhat larger as the sample size decreases.
Multiple surveys
Figures 15, 16, 17, and 18 show the mean error, mean rela-tive error, mean absolute error, and mean absolute relarela-tive error, respectively, observed for all methods at each sam-ple size stratified by the number of surveys included. The results shown for a single survey are the same as those shown in Figures 3, 4, 5, and 6 and are included here for comparison. The results shown for multiple surveys are based on complete birth history methods where data are pooled across these multiple surveys within a given coun-try. Additional file 1: Table S4 also gives these values along with the corresponding 2.5th and 97.5th percentiles.
For very small samples, additional surveys appear to alleviate some of the downward bias, as measured by the mean error and mean relative error, exhibited by all of the complete birth history methods. Additionally, there is an obvious decline in the magnitude of the error, as measured by the mean absolute error and the mean abso-lute relative error, as the number of surveys increases: on average, the mean absolute relative error decreases by 22 percentage points at sample size 10, 20 percentage points at sample size 50, and 15 percentage points at sample size 100 when five surveys are available as compared to a single
survey. Both of these effects almost certainly reflect that the overall sample size increases as the number of sur-veys increases. It is not surprising that the effect of adding additional surveys is in some ways similar to the effect of increasing the sample size in a single survey.
Discussion
This analysis suggests that all methods of analyzing birth history data perform poorly at sample sizes of fewer than 100 women, with large expected errors and, for some methods, noticeable downward bias. There are large dif-ferences in performance between models, however, and even at higher sample sizes (500 and 1000 women), the magnitude of the expected error for many methods is still unacceptably high.
Sample size
Mean Error (Deaths per 1,000)
−30
−20
−10
0
SBH CBH [1yr] CBH [2yr] CBH [5yr] MW CBH [5yr,F]
−30
−20
−10
0
10 50
100 500 1000
MW CBH [10yr,F]
10 50
100 500 1000
MW CBH [5yr,T]
10 50
100 500 1000
MW CBH [10yr,T]
10 50
100 500 1000
MW CBH [20yr,T]
Number of Surveys
1 2 3 4 5
Figure 15Mean error for all methods, stratified by the number of pooled surveys.Color indicates number of surveys; each panel shows results for one particular method; SBH=summary birth history; CBH=complete birth history; MW=moving window; F=flat weights; T=triangle weights; number in brackets gives period or window length.
Sample size
Mean Relative Error (%)
−25
−20
−15
−10
−5
0
SBH CBH [1yr] CBH [2yr] CBH [5yr] MW CBH [5yr,F]
−25
−20
−15
−10
−5
0
10 50
100 500 1000
MW CBH [10yr,F]
10 50
100 500 1000
MW CBH [5yr,T]
10 50
100 500 1000
MW CBH [10yr,T]
10 50
100 500 1000
MW CBH [20yr,T]
Number of Surveys
1 2 3 4 5
Sample size
Mean Absolute Error (Deaths per 1,000)
50
100
150
200
SBH CBH [1yr] CBH [2yr] CBH [5yr] MW CBH [5yr,F]
50
100
150
200
10 50
100 500 1000
MW CBH [10yr,F]
10 50
100 500 1000
MW CBH [5yr,T]
10 50
100 500 1000
MW CBH [10yr,T]
10 50
100 500 1000
MW CBH [20yr,T]
Number of Surveys
1 2 3 4 5
Figure 17Mean absolute error for all methods, stratified by the number of pooled surveys.Color indicates number of surveys; each panel shows results for one particular method; SBH=summary birth history; CBH=complete birth history; MW=moving window; F=flat weights; T=triangle weights; number in brackets gives period or window length.
Sample size
Mean Absolute Relative Error (%)
0
5
0
100
SBH CBH [1yr] CBH [2yr] CBH [5yr] MW CBH [5yr,F]
0
5
0
100
10 50
100 500 1000
MW CBH [10yr,F]
10 50
100 500 1000
MW CBH [5yr,T]
10 50
100 500 1000
MW CBH [10yr,T]
10 50
100 500 1000
MW CBH [20yr,T]
Number of Surveys
1 2 3 4 5
in earlier time periods compared to later time periods. The methods with less smoothing (i.e., the complete birth history methods with period or window lengths of no more than five years) are far less problematic with respect to differential bias by level of mortality or time prior to survey, but the magnitude of overall error from these methods is much larger than the other methods.
The results of this analysis suggest that the birth history methods considered are of limited utility for estimating mortality in small samples and, in particular, for mak-ing meanmak-ingful comparisons among geographic units or strata. Given the value of these types of estimates, how-ever, investment in other data sources may be warranted. In particular, sample registration schemes may be a useful alternative to both surveys, with the problems enumerated here, and full vital registration systems, which are expen-sive and technically challenging to maintain. Alternatively, research into adapting existing small area methods fre-quently used in epidemiology and other fields [10,11] for use with birth histories could prove useful. These mod-els explicitly account for unusually high sampling error in estimates derived from small samples and attempt to overcome this challenge by exploiting spatial and tempo-ral relatedness. Sevetempo-ral authors have already used birth history data to inform these models, though the focus of these analyses has generally been on the relationship between other factors and mortality and not on prediction of mortality levels for specific areas or subgroups [12-16]. This analysis has several limitations. The stratified anal-yses by mortality level and time prior to survey do not control for each other, making it difficult to conclusively disentangle the two effects. Further, birth histories, like all survey data, are subject to a number of data errors, including, among others, recall bias and age misreport-ing. We treat the reported population in each survey as truth and don’t consider the additional effect on error or bias that any of these errors could introduce. It is well documented that these types of errors can impact the reli-ability of mortality estimates, but future research could consider specifically how these errors interact with the problems due to sample size explicitly considered here. Microsimulation–where synthetic populations are cre-ated by simulating births and deaths given set mortality and fertility schedules–could provide useful mechanisms for more fully exploring the issues described here.
Nonetheless, this study boasts several strengths. The use of empirical data, rather than simulated populations, ensures that the mortality and fertility relationships are realistic and representative of the types of scenarios where birth history data are most likely to be collected. Addi-tionally, in contrast to previous research [17,18] which has examined errors in birth history estimates and com-pared different methods of analyzing birth history data, we estimate error by comparing to a true gold standard
(in this case the full sample) rather than using statistical techniques such as the Jackknife to estimate error. Finally, this study compares a large number of different methods for analyzing available data and makes explicit the com-parison between these methods at different sample sizes, which should prove useful to analysts deciding between different methods given a particular dataset.
Conclusions
Overall, the results of this analysis suggest that birth histo-ries in all but the largest of surveys are of limited utility for making subnational estimates or estimates across many strata. Censuses may be more useful for this purpose, hav-ing much larger sample sizes, but generally only include summary birth history information if they include birth history information at all. Given the value of subnational and stratified analyses of under-5 mortality and the limita-tions of the methods examined here, further research into methods for using existing data sources and investment in alternative data sources is warranted. In particular, small area methods, which address the issue of small sam-ple sizes by borrowing strength across geographic units, may be useful when analyzing birth history data at a subnational level.
Additional file
Additional file 1: Mean, 2.5th percentile, and 97.5th percentile of the error, relative error, absolute error, and absolute relative error for all methods and sample sizes.Table S1 gives results for the overall analysis; Table S2 gives results for the analysis stratified by mortality level; Table S3 gives results for the analysis stratified by time prior to survey; and Table S4 gives results for the analysis stratified by number of surveys.
Competing interests
The authors declare that they have no competing interests.
Authors’ contributions
LD-L conceived of the study, carried out the analysis, and wrote the first draft of the manuscript. EG, AF, and HW participated in design of the study, participated in interpretation of results, and edited the manuscript. All authors read and approved the final manuscript.
Acknowledgements
This research was supported by core funding from the Bill & Melinda Gates Foundation. An earlier version of this paper was presented at the 2013 Population Association of America Annual Meeting.
Received: 29 October 2012 Accepted: 22 July 2013 Published: 26 July 2013
References
1. Bangha M, Simelane S:Spatial differentials in childhood mortality in South Africa: evidence from the 2001 census.Afr Popul Studies2007, 22(2):3–21.
2. Storeygard A, Balk D, Levy M, Deane G:The global distribution of infant mortality: a subnational spatial view.Popul, Space Place2008, 14(3):209–229.
4. Singh A, Pathak PK, Chauhan RK, Pan W:Infant and child mortality in India in the last two decades: a geospatial analysis.PLoS ONE2011, 6(11):e26856.
5. MEASURE DHS:Demographic and health surveys. Calverton: Macro International, Inc. http://www.measuredhs.com
6. Rajaratnam J, Tran L, Lopez A, Murray C:Measuring under-five mortality: validation of new low-cost methods.PLoS Med2010,7(4):e1000253. 7. Lozano R, Wang H, Foreman K, Rajaratnam J, Naghavi M, Marcus J,
Dwyer-Lindgren L, Lofgren K, Phillips D, Atkinson C, Lopez A, Murray C: Progress towards millennium development goals 4 and 5 on maternal and child mortality: an updated systematic analysis.Lancet 2011,378(9797):1139–1165.
8. Garenne M, Gakusi E:Health transitions in sub-Saharan Africa: overview of mortality trends in children under 5 years old (1950–2000).Bull World Health Organ2006,84(6):470–478.
9. R Development Core Team:R: A Language and Environment for Statistical Computing. Vienna: R Foundation for Statistical Computing; 2012. 10. Banerjee S, Carlin BP, Gelfand AE:Hierarchical Modeling and Analysis for
Spatial DataNo. 101 in Monographs on Statistics and Applied Probability. Boca Raton: Chapman & Hall/CRC; 2004.
11. Cressie N, Wikle CK:Statistics for Spatio-Temporal Data. Hoboken: Wiley; 2011.
12. Gemperli A, Vounatsou P, Kleinschmidt I, Bagayoko M, Lengeler C, Smith T:Spatial patterns of infant mortality in Mali: the effect of malaria endemicity.Am J Epidemiol2004,159:64–72.
13. Adebayo SB, Fahrmeir L, Klasen S:Analyzing infant mortality with geoadditive categorical regression models: a case study for Nigeria. Econ Human Biol2004,2(2):229–244.
14. Kandala NB, Ghilagaber G:A geo-additive Bayesian discrete-time survival model and its application to spatial analysis of childhood mortality in Malawi.Qual Quantity2006,40(6):935–957.
15. Kazembe LN, Appleton CC, Kleinschmidt I:Spatial analysis of the relationship between early childhood mortality and malaria endemicity in Malawi.Geospatial Health2007,2:41–50. 16. Kazembe LN, Mpeketula PMG:Quantifying spatial disparities in
neonatal mortality using a structured additive regression model. PLoS ONE2010,5(6):e11180.
17. Korenromp EL, Arnold F, Williams BG, Nahlen BL, Snow RW:Monitoring trends in under-5 mortality rates through national birth history surveys.Int J Epidemiol2004,33(6):1293–1301.
18. Pedersen J, Liu J:Child mortality estimation: appropriate time periods for child mortality estimates from full birth histories.PLoS Med2012,9(8):e1001289.
doi:10.1186/1478-7954-11-13
Cite this article as:Dwyer-Lindgrenet al.:Error and bias in under-5 mortality estimates derived from birth histories with small sample sizes.Population Health Metrics201311:13.
Submit your next manuscript to BioMed Central and take full advantage of:
• Convenient online submission
• Thorough peer review
• No space constraints or color figure charges
• Immediate publication on acceptance
• Inclusion in PubMed, CAS, Scopus and Google Scholar
• Research which is freely available for redistribution