Jason Matthews
Dissertation presented in for the degree of Doctor of Philosophy in the Faculty of Economic and Management Sciences at Stellenbosch University
Declaration
By submitting this dissertation electronically, I declare that the entirety of the work contained therein is my own, original work, that I am the sole author thereof (save to the extent explicitly otherwise stated), that reproduction and publication thereof by Stellenbosch University will not infringe any third party rights and that I have not previously in its entirety or in part submitted it for obtaining any qualification.
03 June, 2015
Copyright c 2015 Stellenbosch University
All rights reserved
Abstract
An order picking system in a distribution center (DC) owned by Pep Stores Ltd. (PEP) is investigated. Twelve unidirectional picking lines situated in the center of the DC are used to process all piece picking. Each picking line consists of a number of locations situated in a cyclical formation around a central conveyor belt. Pickers walk in a clockwise direction around a conveyor belt picking stock for stores.
The picking lines are managed in waves due to PEPs policy to push stock to stores. For each wave of picking a subset of released stock keeping units (SKUs) is selected and assigned to an available picking line. The physical stock is then brought to the assigned picking line before multiple pickers pick all the store requirements (or orders) defined by the SKUs within that wave. Once all of the orders have been picked a new mutually exclusive set of SKUs, defining a new wave, is brought to the picking line for picking. In this way picking lines function in parallel to and independently of each other.
The order picking system is deconstructed into three decision tiers. Firstly at the start of each day SKUs are assigned to available picking lines which defines the Picking Line Assignment Problem (PLAP). Once a set of SKUs has been assigned to a picking line each SKU is assigned a specific location within the picking line which defines the SKU Location Problem (SLP). Finally once pickers are brought to the picking line the individual orders are sequenced for each picker. This defines the Order Sequencing Problem (OSP). The focus of this dissertation is on the first two subproblems namely, the SLP and PLAP as the OSP has already been solved in a previous study.
This picking line setup considered here has many similarities to carousel systems. Several heuristic approaches for arranging SKUs within carousel systems are adapted for use in this picking line environment. These heuristics are compared to two novel lower bound formulations as well as trivial lower bound to evaluate their performance. Both historical as well as generated problem instances are used to compare the relative performances of each heuristic. An average saving of 2% for large and 6.5% for medium sized problem instances is achieved if the best solution form the four heuristics is selected. Three goals are used when assigning SKUs to picking lines in the PLAP. Firstly walking distance should be reduced, secondly the number of small cartons produced should be minimal and finally the number of pallet movements required to populate any one picking line for a wave of picking should be manageable.
The concept of a maximal cut is used as an estimate for total walking distance and it is shown that by minimising the maximal cut within each picking line the total walking distance is reduced. A greedy phased insertion heuristic is introduced which minimised the maximal cut and therefore walking distance. Although the total walking distance was reduced by on average 22% compared to historical assignments the number of small cartons produced and the number of pallet movements required to populate some picking lines is undesirable.
Four measures using SKU correlations are introduced and used within a phased greedy insertion framework. These measures reduce the number of small cartons produced with a marginal in-crease in total walking distance compared to approaches which minimized the maximal cut only. The total walking distance is reduced by on average 20% compared to historical assignments with the number of small cartons produced within an acceptable range. However, the number of pallet movements required to populate some of the picking lines remains at an undesirable level.
A final picking line segmentation approach is introduced using a sequence of integer program-ming formulations. These formulations include capacity constraints which limit the total volume of stock (and therefore the number of pallet movements) assigned to any one picking line. This approach delivers individual picking lines that have a manageable number of pallet movements to populate all picking lines with stock. A final hybrid approach is also introduced which switches between this segmentation approach and a correlations approached when appropriate. This results in a 15% reduction in walking distance compared to historical assignments while maintaining a good number of small cartons produced and improving on the historical assign-ments in terms of the number of pallet moveassign-ments required to populate any one picking line with stock.
The managers within the DC are responsible for doing both the SKU to picking line assignments as well as the SKU arrangements within each picking line. A new warehouse management system (WMS) is in the process of design and implementation. A proof of concept interface which illustrated how the approaches to both the SLP and PLAP can be implemented in the new WMS while still allowing for managerial flexibility is therefore proposed.
Opsomming
’n Bestellinguitsoekstelsel in ’n distribusiesentrum wat deur Pep Stores Bpk. (PEP) besit word, word ondersoek. PEP gebruik twaalf eenrigting uitsoeklyne wat in die distribusie sentrum is om al die items vir bestellings uit te soek. Elke uitsoeklyn bestaan uit ’n aantal vakkies wat rondom voerband gele¨e is. Werkers loop in ’n kloksgewyse rigting om hierdie voerband om items vir winkels te versamel.
Die uitsoeklyne opereer in golwe omdat PEP ’n beleid het om voorraad na die winkels te stuur (eerder as dat winkels voorraad bestel). ’n Subversameling van beskikbare voorraadeenhede (VE’s) word geselekteer en toegewys aan ’n beskikbare uitsoeklyn. Die voorraad word dan na die toegewysde uitsoeklyn gebring voordat ’n aantal werkers al die bestellings (wat deur die VE’s in daardie golf gedefinieer word) vir die winkels gaan versamel. Indien al die bestelling in daardie golf voltooi is, word ’n nuwe onderling uitsluitende versameling VE’s na die uitsoeklyn gebring, wat dan weer ’n nuwe golf vorm. Op hierdie manier kan die uitsoeklyne parallel aan, en onafhanklik van mekaar funksioneer.
Hierdie uitsoekstelsel kan ontbind word in drie vlakke van besluitneming. In die eerste vlak word VE’s aan beskikbare lyne toegwys, wat gedefinieer word as die uitsoeklyntoewysingsprobleem (PLAP). Nadat die VE’s aan die lyn toegewys is, moet elke VE aan ’n spesifieke vakkie binne daardie lyn toegewys word en word gedefinieer as die VE-plasingsprobleem (SLP). In die derde vlak moet die bestellings se volgorde bepaal word vir die opmaak van die bestellings. Dit word as die bestellingvolgordeprobleem (OSP) gedefinieer. Die fokus van hierdie proefskrif is op die eerste twee vlakke van besluitneming, naamlik die PLAP en SLP. Die OSP is reeds in vorige studies opgelos.
Die uitsoekstel wat hier beskou word het baie ooreenkomste met ’n rondomtaliestelsel. ’n Aantal heuristiese benaderings tot die rangskikking van van VE’s in vakkies vir rondomtaliestelsels word aangepas en ondersoek vir hierdie uitsoekstelsel. Hierdie heuristieke word vergelyk met twee nuwe ondergrensformulerings sowel as ’n triviale ondergrens. Historise data en genereerde data word gebruik om die prestasie van elke heuristiek te vergelyk. ’n Gemiddelde besparing van 2% vir groot en 9.5% vir medium opmaaklyne word verkry indien die beste oplossing van die vier heuristieke gekies word. Drie doelwitte word beskou indien VE’s aan opmaaklyne toegewys word (tydens PLAP). Eerstens moet die stapafstand van werkers geminimeer word, tweedens moet die aantal klein kartonne geminimeer word en laastens moet die hoeveelheid werk (vurkhyserbewegings) om die voorraad na ’n enkele lyn te bring binne perke gehou word. Die beginsel van ’n maksimum snit word gebruik om die stapafstand te benader en resultate toon duidelik dat deur die maksimum snit te minimeer word die stapafstand ook verminder. ’n Gulsige gefaseerde invoegingsheuristiek (GP) word voorgestel wat die maksimum snit te min-imeer. Alhoewel die totale stapafstand met 22% verminder teeenoor historiese data vermeerder die aantal klein kartonne en die aantal vurkhyserbewegins na sekere lyne word onaanvaarbaar hoog.
Vier maatstawwe om die korrelasies/verwantskappe tussen VE’s te bereken word vervolgens gebruik in die GP heuristiek om VE’s in lyne toe te wys. Hierdie maatstawwe verbeter die aantal klein kartonne met ’n marginale toename in stapafstand teenoor die metodes wat slegs die maksimum snit minimeer. Die totale stapafstand word nou slegs verminder met 20%, maar die aantal klein kartonne val binne ’n aanvaarbare perk. Die aantal vurkhyserbewegings na sommige lyne is egter steeds te hoog.
’n Segmenteringsbenadering word voorgestel waarin ’n aantal heeltalige programmeringsformu-lerings gebruik word. Hierdie formuprogrammeringsformu-lerings sluit kapasiteitsbeperkings in wat die totale volume voorraad na ’n uitsoeklyn beperk. Hierdie formulerings lewer uitsoeklyne wat ’n aanvaarbare hoeveelheid vurkhyserbewegings benodig. ’n Finale hibriedbenadering word ook voorgestel wat ’n kombinasie van die segmentering- en korrelasiebenadering gebruik. Hierdie metode verskaf ’n 15% verbetering in stapafstand relatief tot historiese oplossings terwyl ’n goeie aantal klien kartonne gehandhaaf en daar verbeter word op die aantal vurhyserbewegings.
Die uitsoeklynbestuurders is verantwoordelik vir die oplossing van die PLAP en die SLP. ’n Nuwe pakhuisbestuurstelsel (WMS) is in die proses van implementering by PEP. ’n Voorstel van hoe hierdie oplossingmetodes in die WMS ingesluit en hoe die gebruikerskoppelvlak moet lyk sodat daar steeds ’n groot mate van vryheid aan die gebruiker oorgelaat word, word ook verskaf.
Acknowledgements
Many people played a significant role in the work leading up to and during the writing of this dissertation. The author hereby wishes to express his deepest gratitude towards:
• Prof SE Visagie for his insight, guidance, enthusiasm and above all his loyal friendship.
• Margarete and Francois Bester for their support and friendship.
• XTranda for providing valuable training and support.
• My family for their financial and emotional support over my entire academic career.
• My wife Irene for marrying and supporting me during the final stages of my PhD
• All of the staff at the Department of Logistics at Stellenbosch University for their support and friendship
• All of the employees at PEP for their friendly and enthusiastic assistance.
The Department of Logistics at Stellenbosch University are hereby thanked for the use of their computing facilities and office space. The financial support of the South African National Research Foundation (NRF), in the form of a part-time doctoral scholarship under grant number 92272, PSP in the form of a bursary towards this research is hereby acknowledged. Any opinions or findings in this dissertation are those of the author and do not necessarily reflect the views of Stellenbosch University,the NRF or PEP.
Table of Contents
List of Figures xiii
List of Tables xix
List of Acronyms xxiii
1 Introduction 1 1.1 Warehousing and DCs . . . 2 1.1.1 Types of DCs . . . 2 1.1.2 DC functions . . . 3 1.2 Order picking . . . 4 1.3 PEP’s operations . . . 7
1.3.1 Receiving, storage and decanting . . . 10
1.3.2 Order picking . . . 10
1.3.3 Dispatch and shipping . . . 14
1.4 Problem description . . . 15
1.4.1 DBN assignment and SKU arrangement . . . 15
1.4.2 Order sequencing . . . 17
1.5 Objectives . . . 19
1.6 Dissertation layout and organisation . . . 21
2 Data and test framework 27 2.1 SLP data . . . 27 2.2 PLAP data . . . 30 2.2.1 Data requirements . . . 30 2.2.2 Data extract . . . 31 2.2.3 Data merging . . . 34 2.2.4 Exclusions . . . 34 ix
2.3 PLAP test framework . . . 39 2.3.1 Data input . . . 39 2.3.2 User input . . . 41 2.3.3 Data output . . . 41 3 SKU arrangement 45 3.1 Introduction . . . 45 3.2 Problem description . . . 47 3.3 Related literature . . . 49 3.4 Heuristics . . . 50 3.5 Lower bounds . . . 53
3.5.1 A travelling salesman approach . . . 53
3.5.2 An assignment approach . . . 56 3.6 Results . . . 58 3.6.1 Problem instances . . . 58 3.6.2 Lower bounds . . . 59 3.6.3 Heuristics . . . 63 3.7 Conclusion . . . 64 4 SKU assignment 69 4.1 Introduction . . . 69 4.2 Literature review . . . 73 4.3 Model . . . 75
4.4 Data and results . . . 79
4.5 Conclusion . . . 83
5 SKU assignment with correlations 87 5.1 Introduction . . . 87
5.2 Literature review . . . 89
5.3 Solution approaches . . . 92
5.4 Results . . . 95
5.5 Conclusion . . . 98
6 A multi-objective approach for SKU assignment 101 6.1 Introduction and background . . . 101
6.2 Literature review . . . 103
xi
6.3 Models and algorithms . . . 106
6.4 Results . . . 109 6.5 Conclusion . . . 113 7 Implementation 117 7.1 Implementation considerations . . . 118 7.2 User interface . . . 119 8 Conclusion 125 8.1 Dissertation summary . . . 125 8.2 Recommendations . . . 126 8.3 Future work . . . 127 8.4 Achievement of objectives . . . 129 8.5 Contribution . . . 130
A Minimising the maximal SKU additional results 133
B Correlation assignments additional results 139
C Capacity constraint assignment additional results 145
List of Figures
1.1 A schematic representation of flows in a supply chain. . . 1
1.2 A schematic representation of a complex logistics channel. . . 2
1.3 A schematic representation of some of the functional areas in a DC. . . 4
1.4 Photographs of parts-to-picker systems. . . 6
1.5 Photographs of a robotic parts-to-picker system. . . 7
1.6 A schematic representation of the supply chain of PEP. . . 8
1.7 A schematic representation the logistical footprint of PEP . . . 8
1.8 A schematic representation the layout of PEP’s DC in Durban. . . 9
1.9 Photographs of the storage areas in PEP’s DC in Durban. . . 10
1.10 Photographs of the high-lifts used in PEP’s DC in Durban. . . 11
1.11 Photographs of pallet moving equipment in PEP’s DC in Durban. . . 11
1.12 A schematic representation of the picking line area in PEP’s DC in Durban. . . . 12
1.13 A photograph of SKU locations in a picking line. . . 13
1.14 Photographs of pickers in active picking lines. . . 13
1.15 A photograph of a dispatch station in PEP’s DC in Durban. . . 14
1.16 A schematic representation decision tiers 1 and 2 in PEP’s order picking operation. 17 1.17 A schematic representation of different possible spans for an order. . . 18
1.18 A schematic representation of an assignment of spans to a set of orders. . . 19
2.1 A graphical representation of the relative size of each set of generated SLP prob-lem instances. . . 29
2.2 A schematic representation of the data flow for the historical data extracts. . . . 34
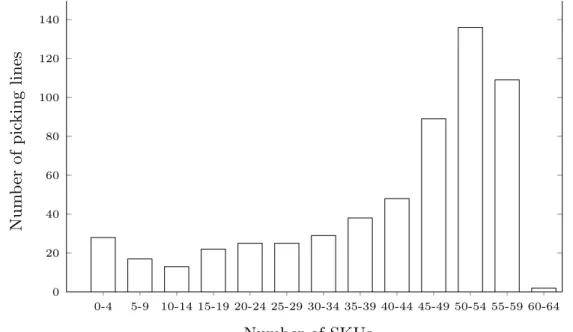
2.3 The number of SKUs assigned to each historical wave after DBN exclusions. . . . 35
2.4 A schematic representation of the lack of location information in the data extract. 36 2.5 A schematic representation of the PLAP test framework’s main modules. . . 39
2.6 A flow diagram of the decision simulation module within the PLAP test framework. 42 3.1 A schematic representation of a picking line. . . 46
3.2 A schematic representation tiers 1 and 2 in PEP’s order picking operation. . . 47
3.3 A schematic representation of an assignment of spans to a set of orders. . . 49
3.4 A schematic representation of the layouts for both the OPA and GS heuristics. . 51
3.5 An illustration of how GA approach to the SLP. . . 52
3.6 A schematic representation of the CD heuristic. . . 53
3.7 A graphical representation of the TSPLB formulation for the SLP. . . 54
3.8 A schematic representation of the ASLB formulation to the SLP. . . 58
3.9 A graphical representation of the relative size of each set of generated SLP prob-lem instances. . . 59
4.1 A schematic representation of the layout of the picking lines in PEP’s DC. . . 70
4.2 A photograph of a functioning picking line. . . 71
4.3 A photograph of a SKU location in a picking line. . . 71
4.4 A photograph of cartons being resized in the dispatch area. . . 72
4.5 A schematic representation of the layout of the zones in an order picking system. 76 4.6 A box-plot representation of cycles traversed for the maximal SKU insertion approaches to the PLAP. . . 81
4.7 A box-plot representation of volume per picking line for the maximal SKU inser-tion approaches to the PLAP. . . 84
5.1 A schematic representation of the layout the picking lines in PEP’s DC. . . 88
5.2 A schematic representation of the slotting phases in PEP’s DC. . . 93
5.3 Comparison of the correlation based approaches to the PLAP in terms of walking distance and number of small orders. . . 98
5.4 A box-plot representation of the volume per picking line for the correlation based approaches to the PLAP. . . 99
6.1 A schematic representation of PEP’s DC. . . 103
6.2 A schematic representation of a picking line. . . 103
6.3 A schematic representation of the segmentation of picking lines into clusters. . . 108
6.4 A flow chart representation of the hybrid assignment approach. . . 110
6.5 A box-plot representation of the volume per picking line for the segmentation and hybrid approaches to the PLAP. . . 113
6.6 The number of problem instances in each volume category for different scenarios. 114 7.1 A screen shot of the main page for the proof of concept interface for the order picking DSS. . . 120
7.2 A screen shot of a controls panel in the proof of concept interface for the order picking DSS. . . 120
List of Figures xv
7.3 A screen shot of the main page of the proof of concept interface for the order picking DSS. . . 121
7.4 A screen shot of the popup menu in the proof of concept interface for the order picking DSS. . . 122
7.5 A screen shot of the popup menu in the main page in the proof of concept interface for the order picking DSS. . . 122
7.6 A screen shot of the picking line window in the proof of concept interface for the order picking DSS. . . 123
7.7 A screen shot of the SKU options popup menu in the proof of concept WMS interface for order picking DSS. . . 123
A.1 A box-plot representation of the number of cycles traversed for the maximal SKU insertion procedures to the PLAP for scenarios with two and three picking lines per problem instance. . . 133
A.2 A box-plot representation of the number of cycles traversed for the maximal SKU insertion procedures to the PLAP for scenarios with four and five picking lines per problem instance. . . 134
A.3 A box-plot representation of the number of cycles traversed for the maximal SKU insertion procedures to the PLAP for scenarios with six and seven picking lines per problem instance. . . 134
A.4 A box-plot representation of the number of cycles traversed for the maximal SKU insertion procedures to the PLAP for scenarios with eight picking lines per problem instance. . . 135
A.5 A box-plot representation of the volume of stock assigned to each picking line for the maximal SKU insertion procedures to the PLAP for scenarios with two and three picking lines per problem instance. . . 135
A.6 A box-plot representation of the volume of stock assigned to each picking line for the maximal SKU insertion procedures to the PLAP for scenarios with four and five picking lines per problem instance. . . 136
A.7 A box-plot representation of the volume of stock assigned to each picking line for the maximal SKU insertion procedures to the PLAP for scenarios with six and seven picking lines per problem instance. . . 136
A.8 A box-plot representation of the volume of stock assigned to each picking line for the maximal SKU insertion procedures to the PLAP for scenarios with eight picking lines per problem instance. . . 137
B.1 A box-plot representation of the number of cycles traversed for the correlation ap-proaches to the PLAP for scenarios with two and three picking lines per problem instance. . . 139
B.2 A box-plot representation of the number of cycles traversed for the correlation approaches to the PLAP for scenarios with four and five picking lines per problem instance. . . 140
B.3 A box-plot representation of the number of cycles traversed for the correlation approaches to the PLAP for scenarios with six and seven picking lines per problem instance. . . 140
B.4 A box-plot representation of the number of cycles traversed for the correlation approaches to the PLAP for scenarios with eight picking lines per problem instance.141
B.5 A box-plot representation of the volume of stock assigned to each picking line for the correlation approaches to the PLAP for scenarios with two and three picking lines per problem instance. . . 141
B.6 A box-plot representation of the volume of stock assigned to each picking line for the correlation approaches to the PLAP for scenarios with four and five picking lines per problem instance. . . 142
B.7 A box-plot representation of the volume of stock assigned to each picking line for the correlation approaches to the PLAP for scenarios with six and seven picking lines per problem instance. . . 142
B.8 A box-plot representation of the volume of stock assigned to each picking line for the correlation approaches to the PLAP for scenarios with eight picking lines per problem instance. . . 143
C.1 A box-plot representation of the number of cycles traversed for the segmentation and hybrid approaches to the PLAP for scenarios with two and three picking lines per problem instance. . . 145
C.2 A box-plot representation of the number of cycles traversed for the segmentation and hybrid approaches to the PLAP for scenarios with four and five picking lines per problem instance. . . 146
C.3 A box-plot representation of the number of cycles traversed for the segmentation and hybrid approaches to the PLAP for scenarios with six and seven picking lines per problem instance. . . 146
C.4 A box-plot representation of the number of cycles traversed for the segmentation and hybrid approaches to the PLAP for scenarios with eight picking lines per problem instance. . . 147
C.5 A box-plot representation of the volume of stock assigned to each picking line for the segmentation and hybrid approaches to the PLAP for scenarios with two and three picking lines per problem instance. . . 147
C.6 A box-plot representation of the volume of stock assigned to each picking line for the segmentation and hybrid approaches to the PLAP for scenarios with four and five picking lines per problem instance. . . 148
C.7 A box-plot representation of the volume of stock assigned to each picking line for the segmentation and hybrid approaches to the PLAP for scenarios with six and seven picking lines per problem instance. . . 148
C.8 A box-plot representation of the volume of stock assigned to each picking line for the segmentation and hybrid approaches to the PLAP for scenarios with eight picking lines per problem instance. . . 149
List of Figures xvii
D.1 A scatter plot comparing the major approaches to the PLAP in terms of the number of cycles traversed and the number of small cartons produced for scenarios with two picking lines per instance. . . 152 D.2 A scatter plot comparing the major approaches to the PLAP in terms of the
number of cycles traversed and the number of small cartons produced for scenarios with three picking lines per instance. . . 152 D.3 A scatter plot comparing the major approaches to the PLAP in terms of the
number of cycles traversed and the number of small cartons produced for scenarios with four picking lines per instance. . . 153 D.4 A scatter plot comparing the major approaches to the PLAP in terms of the
number of cycles traversed and the number of small cartons produced for scenarios with five picking lines per instance. . . 153 D.5 A scatter plot comparing the major approaches to the PLAP in terms of the
number of cycles traversed and the number of small cartons produced for scenarios with six picking lines per instance. . . 154 D.6 A scatter plot comparing the major approaches to the PLAP in terms of the
number of cycles traversed and the number of small cartons produced for scenarios with seven picking lines per instance. . . 154 D.7 A scatter plot comparing the major approaches to the PLAP in terms of the
number of cycles traversed and the number of small cartons produced for scenarios with eight picking lines per instance. . . 155
List of Tables
2.1 A summary of the historical SLP problem instances. . . 28
2.2 A description of the generated SLP problem instances used. . . 29
2.3 The number of locations available on the right for a SKU in the data extract. . . 36
2.4 The number of locations available on the left for a SKU in the data extract. . . . 37
2.5 The total volume of stock and number of SKUs for historical waves. . . 37
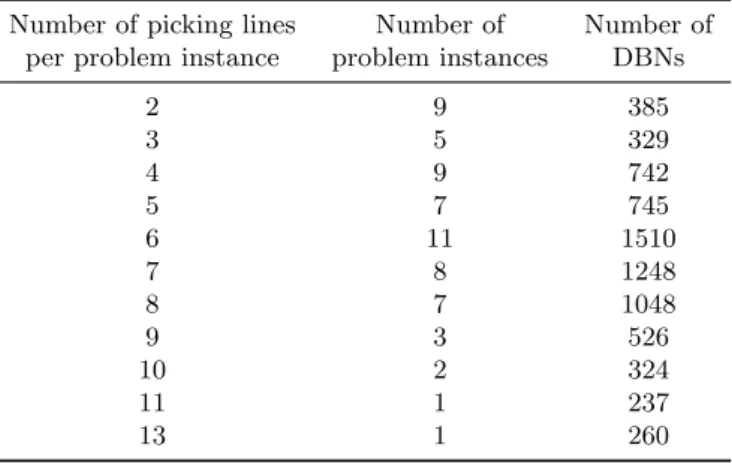
2.6 A summary of the historical problem instances for the PLAP. . . 38
2.7 The composition of the different PLAP scenarios. . . 38
3.1 A comparison between the TSPLB and ASLB formulations for generated problem instances in terms of the value of the maximal cut. . . 60
3.2 A comparison between the TSPLB and ASLB formulations for generated problem instances in terms of computational times. . . 60
3.3 A comparison between the TSPLB and ASLB formulations for historical problem instances in terms of the value of the maximal cut. . . 61 3.4 A comparison between the TSPLB and ASLB formulations for historical problem
instances in terms of computational times. . . 62
3.5 A summary of the range of solution qualities for relaxed SLP instances. . . 63
3.6 A comparison between the heuristic approaches for generated SLP problem in-stances in terms of the value of the maximal cut. . . 64
3.7 A comparison between the heuristic approaches for historical SLP problem in-stances in terms of the value of the maximal cut. . . 65
4.1 The composition of the scenarios from historical data. . . 80
4.2 A comparison of the maximal SKU insertion approaches to the PLAP in terms of distance walked. . . 80
4.3 A comparison of maximal SKU insertion approaches to the PLAP in terms of the size of the maximal SKUs. . . 81
4.4 A comparison of maximal SKU insertion approaches to the PLAP in terms of computation time. . . 82
4.5 A comparison of maximal SKU insertion approaches to the PLAP in terms of number of small orders generated. . . 83
5.1 The composition of the scenarios from historical data. . . 95 5.2 Comparison of the correlation based approaches to the PLAP in terms of walking
distance. . . 96 5.3 Comparison of the correlation based approaches to the PLAP in terms of number
of small orders. . . 96 5.4 Comparison of the correlation based approaches to the PLAP in terms of
com-putation time. . . 97
6.1 The composition of the grouped scenarios taken from historical data. . . 109 6.2 Comparison of the segmentation and hybrid approaches to the PLAP in terms of
walking distance. . . 110 6.3 Comparison of the segmentation and hybrid approaches to the PLAP where
ca-pacity constraints are binding in terms of walking distance. . . 111 6.4 Comparison of the segmentation and hybrid approaches to the PLAP in terms of
computation time. . . 112 6.5 Comparison of the segmentation and hybrid approaches to the PLAP in terms of
List of Algorithms
1 Organ Pipe Heuristic . . . 51 2 Greedy Sequential Heuristic . . . 51 3 Greedy Adjacencies Heuristic . . . 52 4 Classroom Discipline Heuristic . . . 52
5 Greedy insertion of DBNs while minimising the maximal SKU. . . 78 6 A sequential phased insertion of DBNs while minimising the maximum SKU. . . . 79
7 A sequential phased insertion of DBNs using a desirability measure. . . 95
List of Acronyms and Abbreviations
Acronyms Meaning
ADS A correlations measure for a greedy insertion approach to the PLAP ADT A correlations measure for a greedy insertion approach to the PLAP ASLB The assignment lower bound approach for the SLP
CD Classroom discipline heuristic for the SLP
COI Cube per order index
CS Correlated slotting heuristic
DBN Distribution
DC Distribution centre
DSS Decision support system
EXD A generated problem instance type for the SLP GA Greedy adjacencies heuristic for the SLP
GAP Generalised assignment problem
GI Greedy insertion approach to the PLAP
GP Greedy phased insertion approach to the PLAP
GS Greedy heuristic for the SLP
HASC Hybrid assignment algorithm for the PLAP with capacity C
His Historical results
IP Integer programming
IPα Relaxed integer programming formulation for the PLAP with
maxi-mal SKU tolerance ofα
JCS A correlations measure for a greedy insertion approach to the PLAP JCT A correlations measure for a greedy insertion approach to the PLAP
OPA Organ pipe heuristic for the SLP
OSP Order sequencing problem
OXD A generated problem instance type for the SLP
PEP PEP Stores Ltd.
PEPHIS The set of historical results to the PLAP
PEPOSP The historical result to the PLAP where the OSP is solved
PLAP Picking line assignment problem
SD Steepest decent slotting heuristic
SEGC The pure segmentation approach to the PLAP with capacityC
SKU Stock keeping unit
SLP SKU location problem
SSI Shortest spanning interval
TRLB Trivial lower bound for the SLP
TSP Travelling salesman problem
TSPLB The TSP lower bound approach for the SLP UND A generated problem instance type for the SLP UNS A generated problem instance type for the SLP
VRS Voice recognition software
CHAPTER 1
Introduction
Before a product reaches the shelf of a retailer and finally the hands of a consumer it must pass through many value adding processes. Raw materials are sourced, products are manufactured, consumers are informed of products through marketing channels and the goods are delivered. In today’s economy these processes are typically performed by different organisations and business entities. Managing these different processes and the relationships between the different entities is essential to maintain competitiveness and forms the basis for the strategic function known as supply chain management.
The concept of supply chain management first appeared in industry vocabulary in the 1990s [10]. Beamon [8] describes the supply chain as a set of business entities such as suppliers, manufac-turers, distributors and retailers working together in an effort to acquire new raw materials, convert them into final products and deliver these final products to retailers. Supply chain ac-tivities include product development, material sourcing, production and logistics as well as the information systems needed to conduct these activities [22]. Supply chain management typically consists of the management of these different entities with a system wide approach to costing and information.
Coyle et al.[10] describes supply chain management as the effective and efficient flow of prod-ucts, materials, services information and financials from suppliers through various intermediate entities and organisations to the final customer. Figure 1.1 illustrates the interaction between these entities and organisations. The flow of products, services, finance and information runs through the entire chain and requires a system wide management approach.
Vendors Wholesalers Manufacturers Wholesalers Retailers/Customers
Product/Services Information
Finances
Figure 1.1: A schematic representation of the flow of products, materials, services information and financials in a supply chain [10].
One of the challenges of supply chain management is the physical movement of goods between entities. This is done with logistics channels which are integrated within the supply chain framework. Figure 1.2 illustrates a logistic channel where several raw material suppliers send stock to multiple manufacturers. The manufactured goods are sent to warehouses or distribution centers (DCs) where stock is consolidated and shipped to retailers. The focus of this dissertation is on the warehouse or DC connecting hub of a logistics network within a supply chain and is
further discussed in more detail. Raw materials supply point Raw materials supply point Raw materials supply point Raw materials supply point Manufacturer Manufacturer Warehouse Warehouse Retailer Retailer Retailer Retailer Retailer Retailer
Figure 1.2: A schematic representation of a complex logistics channel with multiple raw material suppli-ers, manufactursuppli-ers, warehouses and retailers [10]. The arrows indicate the direction of stock movement.
1.1 Warehousing and DCs
DCs play an important role in the logistics network by adding buffer areas to better match supply with demand. The effects of seasonality on sales can be better managed as stock levels are built up during low sales periods in preparation for high sales periods. In addition buffer areas aid to manage the stochastic lead times associated with the delivery of stock between suppliers and retailers. A further value added by DCs is the consolidation of product. Product received in bulk from multiple suppliers is consolidated into single shipments for individual retail outlets [6].
1.1.1 Types of DCs
Bartholdi & Hackman [6] identified several types of DCs by the types of customers which they serve. A retail distribution center links suppliers to retail outlets. The customers here are retail outlets which typically receive shipments on a regular basis. Orders in this environment would usually consist of hundreds of items covering the entire store catalogue. These DCs have the means to plan ahead because of the regular shipments and early availability of information about orders.
A less predictable environment is a service parts DC which is one of the most difficult types to manage. These DCs hold spare parts for capital intensive equipment such as construction vehicles or medical instruments. Two types of stock are managed in these DCs – stock for standard replacements by dealers and emergency stock usually for emergency repairs. These DCs hold a large variety of items with unpredictable demands because the majority of all parts need to be in stock in case of emergencies.
Some DCs ship items directly to end consumers and are known as catalogue fulfilment or e-commerce DCs. An example of this type of DC is the logistics network of one of the largest online retailers, namely Amazon [3]. Here a large number of customers place orders with only a
1.1. Warehousing and DCs 3
few items and expect immediate shipment. A fast turn around for each order is a major concern for these DCs to ensure customer satisfaction.
DCs which handle perishable items such as food or flowers have several unique challenges. A chain of refrigeration including regulated storage and transportation vehicles is required which comes at a high cost. Managing space efficiently is therefore vital. This becomes more compli-cated with government regulations imposed on the handling of fresh food produce. For example, chicken should not be stored on top of other items. This reduces the chances of potential contam-ination from dripping juices. Inventory management is also a crucial aspect of this environment as the life spans of products are short.
Organisations may also choose to outsource their warehousing needs. A 3PL DC provides services to multiple organisations taking advantage of economies of scale and complimentary seasonality.
Frazelle [16] differentiates warehouses and DCs based on the value added to the logistics chain and to the product handled. At the start of the logistics network raw material warehouses and component warehouses hold raw materials (for example, raw metals for the manufacturing of vehicle chassis) near the point of manufacturing. As part of the manufacturing process partially completed parts or assemblies need to be stored before undergoing further manufacturing or assembly. These parts are held by work-in-progress warehouses before the finished product is stored in finished goods warehouses.
DCs may be viewed as warehouses which consolidate completed products for distribution to customers or stores [16]. In this context customers would receive regular shipments of stock. In some warehouses and DCs further value may be added to product. Possible value added services include in-house assemblies and packaging changes for marketing and repricing. Al-though warehouses and DCs may have different functions, customers and locations in logistics networks, they all require similar internal operations to carry out their function.
1.1.2 DC functions
Frazelle [16] identifies some major functions and activities within DCs including the receiving of goods, put away, pre-packaging, cross docking, order picking, sorting, material handling, pack-aging and shipping. Bartholdi & Hackman [6] groups DC activities into five main categories namely, receiving and put-away – forming the inbound activities – and order picking, checking, packing and shipping – forming the outbound activities. The interactions between these func-tional areas and activities are illustrated in Figure 1.3. All of the activities are connected by the material handling functionality.
The receiving function revolves around the collection and off loading of stock arriving at the DC. Stock will typically arrive at the DC in larger units compared to stock leaving the DC and will require less labour per unit of handling. Once the stock is offloaded it must undergo a quality and quantity control before it can be moved to other functional areas. During the put-away operation stock is moved to storage. Storage and transportation methods depend on the type of stock – its size, weight and handling characteristic. The location of the stock in the DC plays a critical role on DC efficiency in terms of product handling time.
Once the inbound stock has been received and stored it must be processed before leaving for customers. During the order pick operation correct quantities of different stock keeping units (SKUs) are picked for customers. Depending on the type of stock order picking can be done at the pallet, carton or individual item level. In many instances large quantities of stock are
Pallet storage Case picking
Broken case picking
Putaway Material
handling Sortation and accumulation
Receiving Cross docking Shipping
Figure 1.3: A schematic representation of some of the functional areas in a DC and the movement of stock between them [16]. Arrows indicate the movement of stock governed by the material handling functionality.
required to satisfy pending orders. In these cases stock can bypass storage and be directly moved from the receiving to the shipping area. This direct movement of stock from receiving to shipping is known as cross docking.
Once an order has been picked for a customer additional value added activities may be applied. Prices may be changed which typically occurs if customers are in other countries and require different currencies. In addition the basket of picked SKUs can be packed into a single package which reduces later material handling and transportation costs. These picked and packaged orders will typically be held in a holding area before being loaded onto delivery vehicles. The focus of this dissertation is on the order picking operation and its effects on other DC functional areas for a specific DC in industry. A more detailed exposition of order picking systems is therefore provided in the next section.
1.2 Order picking
Order picking is the process of retrieving products from storage or buffer areas in response to customer requests and typically accounts for 55% of total DC costs. It involves the process of clustering and scheduling of orders, assigning stock to the orders, releasing the order to the floor for picking, physical picking and post picking clean-up [12]. Order picking may be seen as the most basic of services provided by a DC to the supply chain with all other value added services functioning around it [16].
According to Bartholdi & Hackman [6] 55% of the total time spent picking orders is associated with physical travel around the DC, 15% is spent searching for goods, 10% on extracting items and 20% for other administration type activities. Not only is physical travel the most time consuming activity, but it is also the most unproductive as no value is added to the order during travel. This activity often forms the main focus within the design and management of order picking systems.
1.2. Order picking 5
differ between DCs. The product characteristics – size, shape and weight; quantities in which products are ordered – pallets, cartons or individual items; number of SKUs in an order and the number of customers can all have an effect on the design and management of an order picking system.
Order picking systems may differ in a number of ways. Due to the advancement in technology the main area in which order picking operations differ is automation. Manual order picking requires human pickers to physically pick stock items. Automated order picking occurs when machines (and not humans) pick SKUs. This is often achieved with a system of robot arms and conveyor belts. Automatic order picking is often used when SKUs are small and uniform in shape such as in the pharmaceutical industry.
In most DCs manual order picking is used [12]. Among these systems two major types occur, namely picker-to-parts and parts-to-pickers systems. In a picker-to-parts system pickers will travel to locations holding required SKUs to pick the required items and in many cases vehicles are used. Vehicles allow pickers to reach multiple levels of storage in a high-level order picking system and increases picker movement speed. In an effort to reduce the travel times of pickers much attention in literature has been given to developing good routing procedures for different warehouse designs [13, 30, 35, 52, 54, 55].
One of the ways in which travel distance is decreased in a picker-to-parts system is to use a forward or fast pick area. A separate area of the DC is assigned as the forward pick area and functions as a mini DC within a DC. The most popular SKUs are stored in smaller quantities in this area. SKUs are therefore stored more densely giving pickers access to a wider variety of SKUs within a smaller walking distance. Pickers therefore move shorter distances to pick orders.
To maintain a dense concentration of different items and avoid stock-outs during picking the forward pick area needs to be restocked by the main DC. This creates a trade off between picking costs and restocking costs. Bartholdi & Hackman [5] addressed the problem of restocking forward pick areas by adjusting the volume assigned to a SKU within the forward pick area while minimising the total number of restocks. Accorsi et al. [2] considered both restocking as well as picker travel times when managing SKUs in a forward pick area. It was shown that overall improvements can be achieved by considering both objectives and in some cases the optimal allocation of stock by Bartholdi & Hackman [5] does not yield the best combined picking and restocking times.
Picker-to-parts systems may have many forms. The two basic variants occur with the presence of order batching and/or zone picking. In an order batching system a picker will pick multiple orders at the same time. Orders with a similar set of SKUs will be batched together. This reduces travel times as pickers walk the same path picking the same SKUs for multiple orders in the batch. Although travel distance is reduced the stock for a batch of orders needs to be picked in bulk and sorted between the orders. This sorting can either be done by the picker in a pick-and-sort operation or the stock for the entire batch can be picked and sorted in a later operation – known as pick-then-sort. Many studies have been conducted to improve picking efficiency by correctly batching orders for a variety of different DC configurations [14, 17, 26, 27, 35, 47, 48, 59, 64].
In zone picking the picking area (forward pick area or storage racks) is divided into zones. Each zone is then serviced by a single picker. This reduces the travel time of pickers as they only pick SKUs from a single zone and do not need to walk picking outlying SKUs in other zones. In addition pick efficiency of individual pickers increases as pickers become accustomed to the
SKUs in, and layout of their zone.
A drawback to zone picking is the re-consolidation of individual orders which span different zones. Orders are either passed sequentially between zones in a progressive zone picking system or orders are partially picked at each zone in parallel and consolidated at the end of all picking in a synchronised zone picking system. In a progressive zone picking system the issue of work balance between zones arises. Pickers stationed at the last zone of the system must wait for work to be passed down from preceding zones. The stochastic nature of picking often results in pickers either waiting for new orders from preceding zones or pickers being swamped with too much work. A similar issue also arises with synchronised zone picking, however, in this case imbalances occur between the picking and consolidation. The consolidation area is either swamped with work, or it becomes full of half completed orders waiting for SKUs from backlogged zones. Grouping SKUs into zones to improve picking efficiency and manage work imbalances has re-ceived attention in litreature [18, 32, 34, 48, 64]. Bartholdi & Eisenstein [4] introduced a self organising system referred to as bucket brigade to address the issue of work balance in a pro-gressive zone order picking system. Here pickers are allowed to take over orders from slower pickers upstream. In this way faster pickers pull work from slower pickers dynamically adjusting the size of the zones in which pickers operate.
Within the framework of parts-to-picker systems equipment is needed to bring stock to pickers. Two widely used systems are automatic storage and retrieval systems (AS/RS) and carousel systems. In an AR/RS system stock is brought down from storage racks and presented to pickers using specialised high-lifts. Examples of such high-lifts may be seen in Figure 1.4(a). A carousel system is a rotatable circuit of shelving which can rotate completely in both directions (bi-directional) or in a single direction (unidirectional). Figure 1.4(b) illustrates an example of a horizontal multidimensional carousel system. Pickers remain stationary as stock is presented in front of them on racks or shelves. Pickers may pick from multiple carousels, and carousels may have multiple levels of storage. There has been much attention given to the optimisation of carousel systems focusing on sequencing SKUs for a single order, sequencing a set of orders as well as arranging SKUs in a carousel [1, 7, 9, 19, 21, 23, 24, 25, 28, 29, 31, 33, 36, 37, 38, 39, 40, 49, 50, 56, 58, 60, 61, 62, 63].
(a) A photograph of an automatic storage and retrieval
system. Source: [11].
(b)A photgraph of a horizontal
multi-dimensional carousel. Source: [53]. Figure 1.4: Photographs of parts-to-picker systems.
Recent developments in the use of robots to move entire shelves through a network of pathways to pickers at picking stations has revolutionised small item parts-to-pickers systems. These robots, referred to as squat machines, are shown in Figure 1.5(a) and use advance routing and
1.3. PEP’s operations 7
scheduling techniques. Pickers remain in a single location while squat machines queue at picking stations with required stock [20]. An example of this queue system is shown in Figure 1.5(b).
(a)A photograph of a KIVA robotic
device. Source: [15].
(b) A photgraph a workstation serviced by KIVA
robotic devices. Source: [15].
Figure 1.5: Photographs of the KIVA systems robotic parts-to-picker devices and work stations.
With the rise in technology, the way in which pickers receive pick instructions for orders has changed for both picker-to-parts and parts-to-pickers order picking systems. The first approach to manual picking was to give pickers physical printed pick slips like a type of shopping list. In this case pickers will need to manually keep track of what items have been picked for each order and search for the correct items using the location IDs on the picking slip. The first semi-automated system introduced was a pick by light system. Here pickers are directed by lights above required SKUs. With advances in voice recognition software pickers began to interact with tracking and routing software directly. Pickers wear headsets and are directed to locations holding SKUs and are provided with the pick quantities audibly.
A unique picker-to-parts order picking system using voice recognition software in a DC owned by PEP Stores Ld (PEP) is considered in this dissertation. A brief background and description of PEP’s order picking system is therefore given in the next section. It is followed by a detailed problem description.
1.3 PEP’s operations
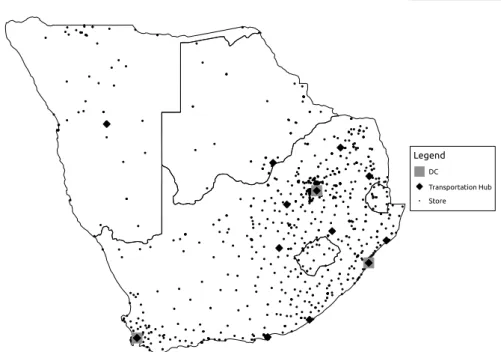
PEP is the largest single brand retailer in South Africa and has been trading since 1965. PEP predominantly sells apparel and footwear, but is growing in the home d´ecor, fast moving con-sumer goods and cellular device markets [51]. PEP’s target market consists primarily of the low income population of Southern Africa. To reach its target market PEP uses a footprint of over 1600 stores located all around Southern Africa including Namibia, Botswana, Swaziland and Lesotho.
PEP strives to in keep prices low by managing an efficient supply chain. With three DCs located in Durban (East coast), Cape Town (West coast) and Johannesburg (Central) together with 13 transportation hubs PEP’s distribution network spans more than 250 000 m3. Figure 1.6 illustrates the framework of PEP’s logistical network. Figure 1.7 illustrates the spread of the logistical footprint of PEP across Southern Africa. PEP’s largest DC is in Durban which holds the largest port in South Africa. This DC receives the most stock as most of PEP’s suppliers are in the far East (China and India).
Suppliers China Suppliers other foreign Suppliers local DC Durban DC Johannesburg DC Cape Town Transportation hubs Transportation hubs Transportation hubs Stores Stores Stores Stores Stores
Figure 1.6: A schematic representation of the supply chain of PEP. There are three DCs distributing to 13 transportation hubs. Each transportation hub serves a mutually exclusive set of stores. The DC in Durban sends stock to the Johannesburg DC for picking. Arrows indicate stock movement and the thickness of the lines gives an indication of the relative volume of stock moved.
DC
Transportation Hub Store Legend
Figure 1.7: A schematic representation the logistical footprint of PEP across Namibia, Botswana, South Africa, Lesotho and Swaziland.
1.3. PEP’s operations 9
management is the distinction between replenishment and seasonal products. Replenishment products are those with a high rate of sale for the entire year and limited seasonality. Examples of these types of products include underwear and nappies. These products are monitored and replenished to stores regularly. Replenishment cycles range from weekly to monthly replenish-ments. The inventory at the DCs are also replenished regularly by suppliers. Seasonal products, for example winter jackets, are only managed for a single season. Future demand for the next season must be forecast and orders placed well in advance allowing for production and shipping. No additional stock for these products will be ordered once the season has started. For seasonal products the DC acts primarily as a stock consolidation facility receiving once off shipments of a SKU and distributing it to stores. In contrast, the DC plays a greater stock buffering role for replenishment products as fluctuations in store sales are absorbed in the DC’s inventory.
Once an order has been placed at manufacturers the lead time until the stock arrives at a DC is typically 10 months. This includes six months production time and four months shipping time. A few weeks before a product is scheduled to be sent to stores the demand at each store is re-evaluated to account for changes during the lead time. Stock is redistributed between stores in an allocation process using more recent sales data. This allocation process is done centrally and creates a push system. Once stock has been allocated and physical stock has arrived at the DC the planning department schedules SKUs to be sent to stores. At this stage the DC can begin to pick SKUs. Each SKU has an associated out-of-DC date and must leave the DC before this date. The picked stock leaves the DC and is transported and consolidated at the transportation hubs before being delivered to stores. The delivery process typically takes 14 days.
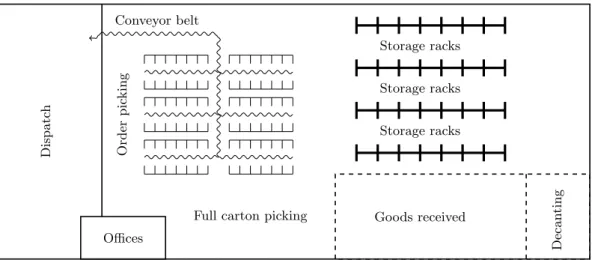
The focus of this study is on PEP’s order picking system. All of PEP’s DCs use the same fundamental order picking framework, however, each has a different layout. The Durban DC will be used as a case study as it is the largest and receives the greatest amount of stock. The DC in Durban spans approximately 62 200 m2 and is illustrated in Figure 1.8. There are several main functional areas in the DC namely receiving, decanting, rack and floor storage, order picking, dispatch and shipping. Each area will be discussed in brief with more focus placed on the order picking area.
Dispatc h Decan ting Goods received Offices Storage racks Storage racks Storage racks Order pic king Conveyor belt
Full carton picking
1.3.1 Receiving, storage and decanting
Stock arrives at the goods received area and is off loaded from one of the 15 loading bays. The stock, which typically arrives in cartons, is packed onto pallets and held in the goods received area until a quality control check has been completed. From here pallets are moved to either floor storage, rack storage, the order picking area or the decanting area.
The decanting area fulfils a similar role to cross docking, however, in this case stock is offloaded from containers and reloaded onto delivery vehicles destined for the Johannesburg DC. This stock will then be picked at the Johannesburg DC before being shipped to stores. Containers are not transported directly to Johannesburg to avoid container storage costs in Johannesburg and the cost of bringing empty containers back to the harbour1. Further transportation costs are saved as containers are often not fully loaded and delivery vehicles can hold more volume by consolidating stock when reloaded.
Figure 1.9 illustrates both the floor and the rack storage areas. The floor storage areas are typically used for stock which will be picked in a carton picking operation. Stock stored in storage racks is usually destined for piece picking. There are 23 aisles of rack storage serviced by five specialised high-lifts illustrated in Figure 1.10. Forklifts and pump trolleys, shown in Figure 1.11, are used to move pallets in and around the floor areas. Pallets destined for storage are queued at one end of the aisle and retrieved pallets are dropped off at the other end creating one direction of stock flow. The high lifts process jobs in batches. A high lift will either process a batch of put-away jobs or a batch of retrieval jobs.
(a) A photograph of the floor storage in PEP’s DC in
Durban.
(b) A photograph of the rack storage in PEP’s DC in
Durban.
Figure 1.9: Photographs of the storage areas in PEP’s DC in Durban.
1.3.2 Order picking
A major influence on PEP’s order picking system is the central inventory planning. SKUs are distributed to all stores in a single operation during the allocation process. This is achieved by collectivity assigning available stock for a SKU to all stores2. This allocation process is done for sets of SKUs or a distribution (DBN) consisting of SKUs of the same product type but different sizes. For example a DBN could consist of three SKUs – white T-shirts size small, medium
1Johannesburg is approximately 500km from Durban inland.
2
1.3. PEP’s operations 11
(a) A photograph of an empty high lift. (b) A photograph of a loaded high-lift lifting a pallet
in the storage racks.
Figure 1.10: Photographs of the high-lifts used to store and retrieve pallets from the storage racks in PEP’s DC in Durban.
(a) A photograph of an empty fork lift. (b)A photograph of a loaded pump trolley.
Figure 1.11: Photographs of pallet moving equipment used to move pallets on the floor space in PEP’s DC in Durban.
and large. Once stock has been allocated the resulting list of store requirements for the DBN are released to the DC. All store requirements for a DBN will be picked in the DC in a single operation. In this way SKUs and not orders are batched together in a single picking operation.
PEP uses 12 unidirectional picking lines to achieve SKU batching. Figure 1.12 illustrates this picking line area. Multiple pickers walk in a clockwise direction picking stock directly into cartons. Each picking line has 56 locations which can hold up to five pallet loads of the same SKU as shown in Figure 1.13. In addition managers often store additional stock on the floor space behind the location in-between picking lines and on the floor space at the ends of the picking lines if needed. Staff can quickly gain access to this stock and keep each location stocked during picking. This eliminates the complication of modelling the restocking of picking lines
SKUs can only be scheduled for picking on a picking line once the store requirements are issued by the planning department and the physical stock has been received by the DC. A batch of approximately 56 SKUs is assigned to an empty picking line and each SKU is assigned to a location. Once SKUs have been assigned to locations the physical stock is brought to the picking line before picking starts. Multiple pickers pick all the store requirements for the specific batch of SKUs before excess stock (if any) is removed and a new mutually exclusive set of SKUs is assigned to the picking line. One cycle of populating, picking and clearing of a picking line is referred to as a wave.
Figure 1.12: A schematic representation of the picking line area with 12 picking lines each with 56 locations. The arrows and dashed lines indicate the walking direction of the pickers. Each picking line has a central conveyor belt conveying cartons to the main conveyor belt.
Pickers are directed around the picking line with voice recognition software (VRS). Figure 1.14(a) illustrates the headset worn by pickers as they issue and receive instructions from the VRS. Be-fore starting an order a picker will prepare an empty carton by placing a unique bar-code identification sticker on the carton and registering it with the VRS. Orders may be split over multiple cartons if required. For the purposes of this study, the term order will from here on refer to the set of store requirements for a single store for all the SKUs in a wave. The VRS assigns an order to a carton and directs the picker to the next location holding a required SKU for the assigned order in a clockwise direction. The VRS keeps track of the last location from which a picker picked stock. All SKUs for an order will therefore be picked in the shortest distance in a clockwise direction from where the order was issued. This implies that a picker will need to walk no longer than one cycle around the picking line to complete an order.
1.3. PEP’s operations 13
Figure 1.13: A photograph of SKU locations in a picking line which is in the process of being populated with stock.
(a) A photograph of a picker with a VRS headset
placing a identification sticker on a new empty car-ton.
(b) A photograph of multiple pickers walking
around an active picking line. Figure 1.14: Photographs of pickers in active picking lines.
Orders are assigned to pickers regardless of the status and number of other pickers in the picking line. Each order must be completed by a single picker and pickers will only pick a single order at a time. In addition pickers may be added and removed from a picking line at any point before the picker starts a new order. In this way pickers can be dynamically shifted between active picking lines in the order picking area.
Pickers are able to pass each other freely while picking because there is enough space between the stock and the conveyor belt. Pickers stack empty cartons onto picking trolleys as shown in Figure 1.14(a). Pickers reuse the empty cartons from suppliers as well as new cartons and have access to empty cartons all around the picking line. The availability of empty cartons therefore does not influence the efficiency of pickers in a picking line. Figure 1.14(b) illustrates a functioning picking line with multiple pickers picking orders. Packed cartons are placed on conveyor belts which convey them to the dispatch area.
1.3.3 Dispatch and shipping
Cartons arriving at the dispatch area must often be resized as the size of cartons and the volume of stock for each order differs. In addition pickers do not know the required volume required for an order when selecting and preparing a new empty carton. Figure 1.15 illustrates the resizing and stapling of cartons at a dispatch station. A quality control check is also performed at this area on a sample of cartons to measure and manage picker accuracy.
Figure 1.15: A photograph of a dispatch station in PEP’s DC in Durban.
Closed cartons are conveyed to the shipping area where they are held in buffer areas. Each buffer area is designated for a specific transportation hub. Once a buffer area has a sufficient volume of stock a delivery vehicle is scheduled and the stock is loaded and delivered. Regular deliveries of stock arrive at transportation hubs and stores. A typical store would receive between one and three deliveries a week. These regular deliveries aid in the management and efficiency of batching SKUs in wave picking.
The order picking system at PEP may be seen as a picker-to-parts system as pickers walk to required SKUs. Pickers use voice recognition software and orders are not batched. Although there are multiple picking lines which resembles a synchronised zone picking system, cartons are not consolidated and multiple pickers can pick in the same zone which removes many of complexities associated with zone picking in literature. The picking line area may further be described as a type of forward pick area as stock is brought from storage racks to the picking lines. The presence of wave picking allows for all the required stock for a wave for all stores to
1.4. Problem description 15
be placed in a picking line before picking starts. Restocking during picking is therefore not a problem as in the forward picking areas described in literature.
A picking line shows many similarities to carousel systems as pickers move in a cyclical di-rection around the picking line. Although carousel systems are parts-to-picker systems, the relative cyclical pattern in which SKUs pass pickers has a similar mathematical structure. Two characteristics, however, differentiate these two systems. Firstly the presence of wave picking creates a deterministic planning environment for picking lines which is not the case for carousel systems in literature. Secondly the presence of multiple pickers operating in the same picking line creates a dynamic environment which differs from typical carousel systems with a single operator for each carousel.
Managing the DC’s order picking in terms of waves and the unconventional picking line setup creates a novel decision making environment not documented in academic literature. Within the order picking environment there are three decision tiers which are made on a daily basis. Optimising these decision tiers forms the basis for this study. The framework and details of these decisions is further discussed in the next section.
1.4 Problem description
Within the wave picking environment at PEP there are three sequential decision tiers which are made on a daily basis. Firstly DBNs need to be assigned to available picking lines. Once DBNs have been assigned to a picking line they need to be assigned a specific location by arranging them on the picking line. Finally, before picking starts the sequence in which the VRS assigns orders to pickers must be established. These three decision tiers are summarised as
1. Assign available SKUs to available picking lines.
2. Arrange SKUs on a picking line for each wave of picking.
3. Sequence orders to be passed to pickers by the VRS for each wave of picking.
These decision tiers are made in sequence and set of possible alternatives at each decision level is defined by the previous tier. For example the set of SKUs which need to be arranged on a picking line are defined by the initial assignment of DBNs to the picking line.
Although these decisions are made in sequence from decision tier 1 to 3, optimisation and decision support models must be developed in reverse order. For example, before approaches to arranging SKUs on a picking line can be developed an approach for sequencing the resulting set of orders must be known so that the SKU arrangement can be evaluated correctly. Similarly before alternative techniques for assigning DBNs to picking lines can be developed the effects of arranging SKUs with a different set of characteristics on the same picking line must be investigated. These decision tiers and the influences they have on each other are discussed for the remainder of this section.
1.4.1 DBN assignment and SKU arrangement
At the start of each day the managers evaluate the progress of all active picking lines and determine which picking lines will become available during that day. DBNs for which store requirements have been issued by the planning department and for which stock has arrived at
the DC are assigned to these picking lines. SKUs within the same DBN are assigned to the same picking line to ensure that the entire range of sizes for a product arrives at the stores at the same time.
When a DBN is released to the DC an out-of-DC date is assigned to it. DBNs are ranked according to these dates and the top ranked DBNs are selected to be scheduled on the available picking lines. Once these DBNs have been scheduled to be picked they must be distributed into waves for the different available picking lines and stock brought to each picking line. The total store requirements for each SKU in a DBN is known in advance when the DBN is assigned. Sufficient stock is therefore brought to the picking line such that restocking is not required during the picking phase. In some cases multiple adjacent locations are assigned to a SKU, but these locations are treated as a single location in the VRS.
DBNs are currently distributed into waves with the objective of balancing the workload between each wave. Management measures workload using in house estimations based on the total volume of stock assigned to the wave and the total number of picks –i.e. the maximum number of times picker needs to reach into a carton to pick items. The actual walking distance of pickers is not considered at this stage as it is currently not yet calculable. Management classifies SKUs as either A or B pick SKUs. Bulky or heavy items requiring two hands to pick are regarded as B picks and are considered more difficult to pick. The number of picks in a wave are then weighted when evaluating work on a picking line with B picks given a larger weighting3. When distributing DBNs management further avoids creating waves of picking which require an excessive number of pallets of stock to populate the picking line. These waves would require a large batch of retrieval jobs to be performed by the high-lifts. High-lifts will be tied down to this single batch of jobs for a long time – in some cases more than an entire shift (8 hours). This reduces operational flexibility in the DC. Moreover, while a picking line is being populated with SKUs it is not adding value to orders as all the stock must be retrieved before picking starts. After performing time analysis PEP segmented the time spent by pickers in a picking line into four tasks, namely walking time, picking time, time spent interacting with the VRS and time spent preparing new cartons. Only the walking time can be improved on by assigning DBNs to picking lines as the other times are fixed. Pickers typically spend 26% of their time walking, 30% picking items from location, 32% packing stock into cartons and 12% handling empty cartons. After consulting PEP management [57] three goals were identified which should be aspired to when assigning DBNs to picking lines and are listed below:
1. Minimise the total walking distance of pickers.
2. Limit the number of waves which require excessive numbers of pallets of stock to build the picking line.
3. Manage the number of orders requiring a low volume of stock. These orders create small cartons which increases handling costs at dispatch and total transported volume.
There are two phases to the picking line assignment decision tier. Firstly DBNs must be sched-uled for picking by assigning it to a particular day. Secondly the schedsched-uled DBNs must be distributed to available picking lines. For the purposes of this study it will be assumed that DBNs are scheduled using the current out-of-DC date ranking system. The picking line al-location problem (PLAP) is therefore defined as assigning a set of scheduled DBNs to a set
3
1.4. Problem description 17
of available picking lines while minimising walking distance, managing waves requiring a large volume of stock to populate a picking line and managing the number of small cartons produced. Once DBNs have been assigned to a picking line and before stock can be brought to the picking line each SKU from each DBN must be assigned to a specific location. Although SKUs from the same DBN must be assigned to the same picking line these SKUs need not be adjacent to each other. Any SKU may therefore be assigned to any location. This may result in SKUs from the same DBN being placed in different cartons. However, all cartons picked from the same picking line should arrive at the stores at the same time. Managers currently arrange SKUs by spreading the number of weighted picks evenly around the picking line. Managers perceive this to reduce total picking time as potential picker congestion at popular SKUs is reduced. Two goals for arranging picking lines have thus been established after consulting PEP’s management and are listed below:
1. Minimise the total walking distance of pickers.
2. Manage the congestion of pickers at popular SKUs.
The SKU location problem (SLP) is defined as the arrangement of a set of SKUs already assigned to a picking line while minimising walking distance and managing picker congestion.
Figure 1.16 illustrates the interactions between the PLAP and SLP. Both problems have a shared goal of minimising walking distance. An approach for determining picker walking distances before pickers start picking is therefore required before these two problems can be solved.
SKUs
Picking lines
Figure 1.16: A schematic representation of the first two decision tiers in the wave order picking oper-ation. The picking line assignment decision tier is shown on the left and the SKU arrangement decision tier is shown on the right. Each shaded shape represents a SKU. SKUs with the same shape are part of the same DBN.
1.4.2 Order sequencing
The total walking distance of pickers may be calculated once orders have been picked by adding the distances from the start to the end locations for each picked order. However, minimising the walking distance for a fixed SKU arrangement, before picking starts, has several complexities. Firstly the end position of the last order picked by a picker dictates the starting position of the next order. This starting position defines how far a picker needs to walk to pick all the required SKUs for that order. All preceding orders passed to a picker therefore influences the walking distance of the next order.
Further complexities are introduced with the stochastic nature of picking, the presence of mul-t
![Figure 1.2: A schematic representation of a complex logistics channel with multiple raw material suppli- suppli-ers, manufactursuppli-ers, warehouses and retailers [10]](https://thumb-us.123doks.com/thumbv2/123dok_us/1177244.2657954/28.892.229.666.198.468/schematic-representation-logistics-multiple-material-manufactursuppli-warehouses-retailers.webp)


![Table 2.1: A summary of the 22 historical problem instances used to evaluate solution approaches to the SLP [3].](https://thumb-us.123doks.com/thumbv2/123dok_us/1177244.2657954/54.892.300.600.160.572/table-summary-historical-problem-instances-evaluate-solution-approaches.webp)
![Table 2.2: A description of the 20 generated problem instances used to evaluate solution approaches to the SLP [3].](https://thumb-us.123doks.com/thumbv2/123dok_us/1177244.2657954/55.892.292.597.673.1049/table-description-generated-problem-instances-evaluate-solution-approaches.webp)