University of South Carolina
Scholar Commons
Theses and Dissertations
2016
Friction Stir Welding And Processing On Titanium
Alloys
Dawei Li
University of South Carolina
Follow this and additional works at:https://scholarcommons.sc.edu/etd Part of theMechanical Engineering Commons
This Open Access Thesis is brought to you by Scholar Commons. It has been accepted for inclusion in Theses and Dissertations by an authorized administrator of Scholar Commons. For more information, please [email protected].
Recommended Citation
Li, D.(2016).Friction Stir Welding And Processing On Titanium Alloys.(Master's thesis). Retrieved from
FRICTION STIR WELDING AND PROCESSING ON TITANIUM ALLOYS
by
Dawei Li
Bachelor of Science Henan University, 2009
Submitted in Partial Fulfillment of the Requirements
for the Degree of Master of Science in
Mechanical Engineering
College of Engineering and Computing
University of South Carolina
2016
Accepted by:
Anthony P. Reynolds, Director of Thesis
Addis Kidane, Reader
c
Dedication
Dedicated to my family and friends who have supported me through the life of
graduate school. It was a rough road, but I never would have made it without the
Acknowledgments
Without many people’s support, advice and encouragement I could not accomplish
this degree, so I would like to thank them one by one.
First, I want to give my thanks to Dr. Reynolds. Dr. Reynolds invited me to join
his group and introduced me to the world of friction stir welding, changing me from
a beginner to an experienced person in that field. He is full of energy and wisdom,
constantly explaining new stuff and giving suggestions to me. I cannot finish my
thesis without his generous and endless supports.
Second, I want to thank Dan. Dan is my thesis’s direct co-worker of this project.
So we have lots of time to talk about this project and I learnt a lot from him. I
still remember that every week we will meet several times to talk about how to move
forward with this project and how to understand friction stir welding. I still remember
the times when he gave me advices on how to operate different machines, even on
how to correct my pronunciations. So many good times to enumerate that I couldn’t
finish them in a single day. So I really appreciate his support and advice on my study,
life and my family. Thank you from the bottom of my heart.
Third, I want to thank my committee member and second reader, Dr. Addis
Kidane, for his support, criticism and suggestions.
Then, I want to give a special thank my friends here in the U.S. Dr. Wei Tang, he
gave me many support in experiment set up and suggestions on how to analyze data
and interpret experimental results. To my SC friends, Xiao, Xiaomin, Robby, Ryan,
you guys are awesome and I don’t think I could make it through graduate school
Finally, I want to thank my family. I don’t think I can get my thesis done without
Abstract
Friction stir welding (FSW) is a solid-state joining process that utilizes a non-consumable,
rotating tool to plunge into abutting faces and transverse along the weld path.
Ma-terial nearby the tool is softened by frictional heat generated via local friction and
plastic deformation. Severe plastic deformation of the interface along with a state of
hydrostatic pressure results in creation of a joint by metallurgical bonding. Because
the temperature of the material during the welding process is below that of the
melt-ing point, FSW has numerous advantages over conventional fusion weldmelt-ing. Friction
consolidation (FC) is also a solid-state process that uses a rotating die to soften and
consolidate initially well divided charge (chips or metal waste). FC can produce fully
consolidated bulk material from low-cost precursors such as metal chips, scraps or
even powders. It may be more economical, efficient and convenient than conventional
melting and casting recycle process. This thesis focuses on the friction stir
weldabil-ity of titanium 15 molybdenum alloy (Ti 15Mo) as well as friction consolidation of
commercially pure titanium alloy (CP Ti) and Ti 15Mo with an emphasis on FSW
of Ti 15Mo. For Ti 15Mo welds, the correlation between the control parameters such
as forge force, tool rotation rate and travel speed, and response variables like, torque,
weld power and weld energy are investigated by empirical observation and numerical
calculations. Extensive experiments and calculations are carried out and the result
shows that that joint quality weld strength and grain size in the weld nugget are
significantly affected by the control parameters. For the part of friction consolidation
of CP Ti and Ti 15Mo, ultra-high Vickers hardness and tensile strength are found
to examine and characterize this abnormal mechanical and metallurgical response.
Table of Contents
Dedication . . . iii
Acknowledgments . . . iv
Abstract . . . vi
List of Tables . . . x
List of Figures . . . xi
Chapter 1 INTRODUCTION . . . 1
1.1 Motivation of Project . . . 1
1.2 Friction Stir Welding . . . 2
1.3 Friction Consolidation . . . 5
1.4 Titanium Alloys . . . 8
Chapter 2 FRICTION STIR WELDING OF TI 15MO ALLOYS . . 11
2.1 Experiment setup and procedure . . . 11
2.2 Results and discussions . . . 17
2.3 Conclusions for Ti 15Mo welds . . . 29
Chapter 3 FRICTION CONSOLIDATION OF Alpha and beta titanium chips . . . 32
3.2 Conclusions of friction consolidation of alpha and beta chips . . . 48
Chapter 4 CONCLUSIONS AND FUTURE WORK . . . 50
4.1 Conclusions . . . 50
4.2 Future work . . . 54
List of Tables
Table 1.1 Chemical composition of CP Ti[1] . . . 9
Table 1.2 Chemical composition of Ti 15Mo[1] . . . 10
Table 2.1 Welding parameters for Ti 15Mo . . . 11
Table 2.2 Weld parameters and tensile test results . . . 19
Table 2.3 Weld parameters and tensile test results . . . 24
Table 3.1 Statistical result of chips made by the milling machine . . . 34
Table 3.2 Compression test results . . . 41
List of Figures
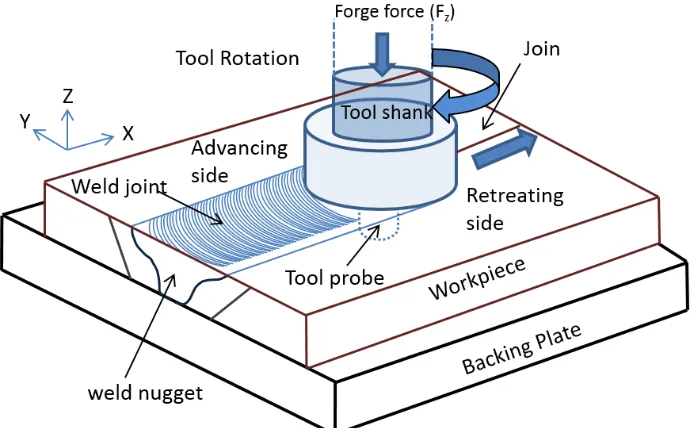
Figure 1.1 Schematic diagram of a typical FSW with relevant terminology . 4
Figure 1.2 A typical FSW transverse cross-section macrostructure . . . 6
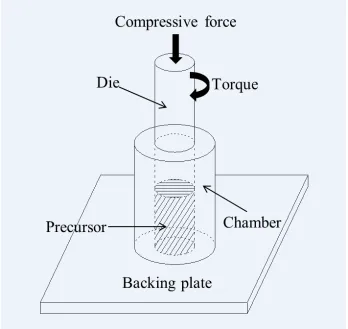
Figure 1.3 Schematic diagram of friction consolidation process . . . 7
Figure 2.1 The Friction Stir Welding Process Development System at USC . 12
Figure 2.2 Ti 15Mo plate after weld nuggets cut out in selected regions . . . 13
Figure 2.3 Welding tool for Ti 15Mo alloys . . . 13
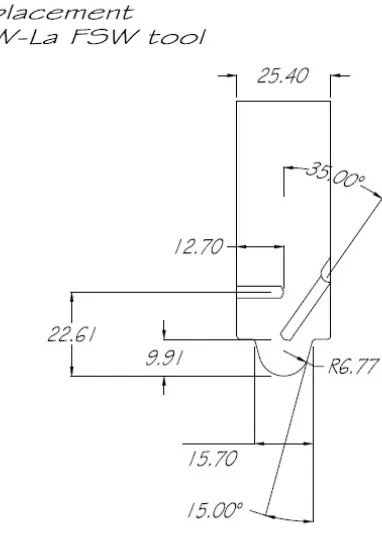
Figure 2.4 Schematic diagram of the welding tool for Ti 15Mo alloys . . . 14
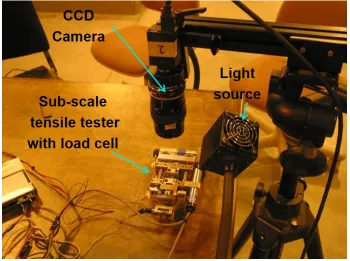
Figure 2.5 Sub-scale tensile test setup . . . 16
Figure 2.6 Contour plot of strain calculated by digital image correlation
for Ti 15Mo base metal before break (left) and after break (right) 16
Figure 2.7 Relative position where materials are cut out for sub-scale ten-sile test. Left: dogbone in the longitudinal direction. Right:
front view of two dogbones in the advancing side and retreating side. 17
Figure 2.8 Dimensions of specimen used by the sub-scale tensile tester . . . . 18
Figure 2.9 Sub-scale tensile test setup (left) and dogbone prepared based
on Figure 2.10 for tensile test (right). . . 19
Figure 2.10 Ultimate tensile strength VS advancing per revolution for Ti
15Mo welds . . . 20
Figure 2.11 Weld energy VS travel speed for Ti 15Mo welds . . . 20
Figure 2.12 Weld energy VS rotation per minute for Ti 15Mo welds . . . 21
Figure 2.13 Vickers hardness distribution with respect to the center line of
Figure 2.14 Vickers hardness distribution with respect to the center line of
weld for 2563A (left) and 2563B (right). . . 22
Figure 2.15 Vickers hardness distribution with respect to the center line of
weld for 2565A. . . 22
Figure 2.16 Vickers hardness distribution VS ultimate tensile strength. . . 23
Figure 2.17 Vickers hardness VS √1
d . . . 24
Figure 2.18 Scanned cross section of 2562A (top left), 2562B (top right), 2563A (middle left), 2563B (middle right) and 2565A (bottom).
The height of each weld is 17.5 mm . . . 25
Figure 2.19 Grain size distribution with respect to the center line of weld
for 2562A (left) and 2562B (right). . . 26
Figure 2.20 Grain size distribution with respect to the center line of weld
for 2563A (left) and 2563B (right). . . 26
Figure 2.21 Grain size distribution with respect to the center line of weld
for 2565A. . . 27
Figure 2.22 Grain size VS power for Ti 15Mo welds . . . 27
Figure 2.23 Ultimate tensile strength VS grain size for Ti 15Mo welds . . . . 28
Figure 2.24 Ultimate tensile strength VS advancing per revolution for Ti
15Mo welds . . . 28
Figure 2.25 Hall-Petch strengthening . . . 29
Figure 2.26 SEM images taken on the fracture surface of weld 2563B. . . 30
Figure 2.27 Comparison of elongations in the advancing side and retreating side. 30
Figure 3.1 Top and side views of the friction consolidation scroll die . . . 33
Figure 3.2 Friction consolidation setup (left) and heat generator (right) . . . 33
Figure 3.3 Schematic diagram of positions where small cylinders were cut
by electrical discharge machining . . . 35
Figure 3.5 Top, bottom and side views of consolidated disc (weld # 4162) . . 35
Figure 3.6 Scanned cross section of the consolidated disc after etching
(weld # 4162) . . . 36
Figure 3.7 Grain size distribution of the consolidated disc (weld # 4162) . . 37
Figure 3.8 Grain size distribution nearby the boundary of the bowl shape
region and other regions . . . 38
Figure 3.9 Area where indents were made (top) and Vickers hardness
dis-tribution of the consolidated disc weld # 4162 (bottom) . . . 39
Figure 3.10 Compression test on the small cylinder labelled as 1 . . . 40
Figure 3.11 Compression test on the small cylinder labelled as 2 . . . 41
Figure 3.12 Base metal compression test for CP Ti (left) and Ti 15Mo(right) . 41
Figure 3.13 Compression test on base metal of CP Ti . . . 42
Figure 3.14 Compression test on base metal of Ti 15Mo . . . 42
Figure 3.15 Relative position where tensile bars are cut from . . . 43
Figure 3.16 Contour plot of strain given by DIC in the high Vickers hardness
region . . . 44
Figure 3.17 Stress-strain curves of tensile bars from top and bottom regions
of the consolidated disc, base metal of CP Ti and Ti 15 Mo . . . 45
Figure 3.18 EDS result in the red region for the consolidated disc . . . 46
Figure 3.19 BSE result for the consolidated disc . . . 46
Figure 3.20 Distribution of Ti and Mo elements in the high Vickers hardness
region . . . 47
Figure 3.21 Distribution of Ti and Mo elements in the high Vickers hardness
region (left) and element counts for TiK and MoL . . . 47
Figure 3.22 Distribution of Ti and Mo elements in the region where CP Ti
Figure 3.23 Statistical result for the distribution of Ti and Mo elements in the region where CP Ti chips can be distinguished from Ti
15Mo chips (mapping) . . . 49
Figure 4.1 Grain size VS power for Ti 15Mo welds . . . 51
Figure 4.2 Ultimate tensile strength VS advancing per revolution for Ti
15Mo welds . . . 51
Figure 4.3 Weld energy VS IPM for Ti 15Mo welds . . . 52
Figure 4.4 Vickers hardness distribution VS ultimate tensile strength. . . 52
Figure 4.5 Ultimate tensile strength VS grain size for Ti 15Mo welds . . . . 53
Chapter 1
INTRODUCTION
1.1 Motivation of Project
This thesis consists of two major parts: the first part studies friction stir welding
of titanium 15 molybdenum alloys (Ti-15Mo) and the second part explores friction
consolidation of commercially pure titanium alloys (CP Ti) and Ti-15Mo. The
mo-tivation for the first part originates from the fact that there is no investigation on
the weldability of Ti-15Mo alloys, let alone the study of flow behavior, heat
gener-ation, microstructural characterizations and weld material properties in response to
different welding parameters. So it is worthwhile to study the application of FSW on
titanium alloys and also important to investigate the behavior of process variables
such as in-plane forces, torque, power, weld energy on the mechanical-microstructural
properties of titanium alloys. The objectives of this thesis are to present quantitative
information on
1. the correlation between the control parameters such as forge force, tool rotation
rate and travel speed, and response variables like in-plane forces, torque, weld
power and weld energy.
2. the microstructural characterizations of the weld material properties.
In addition, attempts are also made to predict the best control parameters that give
the best welds.
The motivation of the second is derived from the proposition that friction
eco-nomical way to recycle titanium alloys wastes using one step process and relatively
simple equipment. The conventional recycle process consists of refining, re-melting
and casting, all of which involve complex processes and considerable amount of labor
and power. Meanwhile, strict working environment and special devices are required
because of high temperature liquid-state metal involved in the process. So it is
worth-while to develop a simple and solid-state alternative process to recycle and reuse
metal wastes from machining. Friction consolidation is one of the choices. Friction
consolidation (FC) is a simple process that the die rotates and creates substantial
deformation to the initially finely divided charge (metal waste or chips). The heating
and shearing due to dissipation of the plastic deformation created by the rotating die
lead to consolidation of the initially unconsolidated charges into useful fully dense
metallic disc. Just as other friction-based processes, FC is a solid-state process with
peak temperatures below the melting point of the material being processed. In
addi-tion, explorations of new titanium alloys are also attempted.
1.2 Friction Stir Welding
Friction consolidation and extrusion was invented at The Welding Institute
(Cam-bridge, UK) in the early 1990’s. It was first derived from friction stir processing as a
method of forming or reforming metal/ceramic composite material[10].
1.2.1
Background
Friction stir welding (FSW) was invented by The Welding Institute (Cambridge, UK)
in 1991[10]. It is a solid state joining process that uses a rotating, non-consumable tool
to plunge into abutting faces and traverse along the weld path. Material adjacent to
the tool is heated by local friction and extreme plastic deformation due to large plunge
force and swept around behind the tool. Severe plastic deformation of the interface
bonding. Because the temperature of the material during the welding process is below
that of the melting point, FSW has numerous advantages over conventional fusion
welding. It can be used to avoid problems brought by melting method during fusion
process, such as porosity, hot cracking and element loss. It can also be used to
weld material that was once considered impossible to be welded by fusion process.
For example, 7xxx series aerospace aluminum alloys, which were extremely difficult
to weld using fusion due to nugget porosity, poor solidification microstructure and
significant loss in joint strength relative to the base metal, can be welded by FSW.
Because melting is eliminated during FSW, the damage to the base metal material is
minimized, thus reducing loss in joint strength. Friction stir welded joints typically
produce fine and equiaxed grains in the weld nugget, zero defects and a relative high
strength, giving superior mechanical properties with minimal distortion. Compared
to conventional fusion welding, FSW has been shown to produce joints with lower
residual stress, increased fatigue life and lower susceptibility to corrosion. And friction
stir welded joints can significantly reduce costs in production, maintenance and repair
in structural manufacturing industries, such as aerospace, marine, automotive etc.
Operation cost can be further reduced by eliminating filler metal and shielding gas.
FSW has been proven to be more energy efficient and environmentally friendly than
conventional joining process[10].
1.2.2
Material Flow
It is helpful to use a schematic diagram to explain common terminologies used in
FSW. Figure 1.1 shows a typical friction stir welding. A non-consumable rotating
tool with a large diameter shoulder and a smaller diameter probe is plunged into
abutting faces of material that needs to be joined. The shoulder has two functions:
prevent the expulsion of material from the weld zone and generate frictional heat. The
The material in the vicinity of the tool probe is deformed plastically because of tool
rotation and frictional heat by forge force and then swept around from the front to
the back of the tool probe. A welded joint is formed by metallurgical bonding once
the tool probe starts to move along the joint line. Clamping is used to constrain
the abutting workpieces. The one that moves in the same direction as the tool is
known as the advancing side, the other one moving in the opposite direction of the
toll is called the retreating side. For a detailed description of terminology in FSW,
one can refer to a paper by Threadgill [33]. For a given set of tool, work piece
and boundary condition, a typical FSW control parameters is composed of three
parts: tool rotation rate (RPM), tool traverse speed or welding speed (mm/s) and
applied forge force (kN). The response variables are forces in directions perpendicular
and parallel to the welding direction, weld zone temperature, measured torque and
power. The microstructure distribution, microhardness profiles and other mechanical
properties are also of primary interest to investigate.
1.2.3
Weld Structure
The mechanical properties of welds are determined by the mechanical and
microstruc-tural properties of material in and near the weld zone, which are governed by process
parameters during FSW. Compared to the material in the base metal, materials in and
near the weld zone are subject to high temperature and intense plastic deformation
which contribute to the change of mechanical and microstructural properties in these
regions. Welds by FSW after polishing and etching the transverse surface show three
characteristic microstructural regions, the nugget zone, the thermos-mechanically
af-fected zone (TMAZ) and the heat afaf-fected zone (HAZ), as show in Figure 1.2.
Al-though the nugget zone experiences severe plastic deformation during welding, the
temperature is generally below melting temperature of the weld material, resulting
in a fine grained recrystallized area [16, 14]. While the TMAZ that appears on both
sides of the nugget zone undergoes significant deformation and thermal cycle. In
most cases, the TMAZ grain structure consists of considerably deformed parent grain
structure but recrystallization is not obvious. There is always a distinct boundary
between recrystallized nugget zone and TMAZ. HAZ only experiences significant
ther-mal cycle. No plastic deformation has been found and there is no apparent change
in the grain structure in this area. However, hardness in HAZ is typically changed,
compared to that of the base metal. For precipitation hardening aluminum alloys,
HAZ is normally the critical zone as the mechanical properties in these zones are
degraded due to over-aging.
1.3 Friction Consolidation
Friction consolidation (FC) was invented in the early 1990’s. It is derived from friction
stir process as a method to form or reform metal/ceramic composite material [37].
Figure 1.2: A typical FSW transverse cross-section macrostructure
designates various processes that use a non-consumable rotating tool to friction stir
into/on material in order to change the properties of material through severe plastic
deformation [21, 25, 20, 39].
1.3.1
Overview
FC is a solid-state process with peak temperature below that of the bulk melting
point of material being processed. It was invented and patented in early 1990âĂŹs
by W. Thomas [37], who was inspired by a friction forging process developed in 1975
by D. R. Andrews and M. J. Gilpin [2]. It is a process using a rotating die to shape
resultant flash without extrusion. The one with extrusion is called friction extrusion
[30], which has been used to produce wire and recycle metal wastes [11, 7, 8] .Tang and
Reynolds improved this technology and produced high quality aluminum wires from
machining chips [31]. It uses a rotating die to compress charges of material (chips
or metal waste) in the chamber (Figure 1.3). For initially unconsolidated charges,
the heating and shearing due to dissipation of the plastic deformation created by the
rotating die finally lead to consolidation of fully dense metallic disc. So this process
is suitable to produce metal discs from materials such as machining chips and metal
powder. And one of its primary applications is to recycle materials from machine
Figure 1.3: Schematic diagram of friction consolidation process
1.3.2
Applications and Challenges
A plasticized layer that experience severe plastic deformation and heating is formed
during friction consolidation, which contains fine grains in the processed zone because
of substantial deformation at a relatively high working temperature. So this technique
has some attractive aspects of the friction stir process and could be an industrially
useful technique to recycle machine wastes, produce consolidation of powder product
and, potentially, create mechanical alloying [32]. Challenges are:
1. how different control parameters like rotation per minute, forge force affect the
mechanical properties of the consolidated disc. No systematic study has been
2. the temperature of the charge during the process is difficult to measure,
espe-cially in the center of the disc. So the mechanical-thermal history is unclear
and microstructure evolution cannot be explained.
3. limited resources can be used to interpret the correlation between control
pa-rameters and grain growth in the consolidated disc.
1.4 Titanium Alloys
Titanium, first identified as a metallic element by Gregor in England in 1791, and its
alloys have been widely used in medical industry, aerospace, ocean engineering and
other industries due to its lightweight, exceedingly corrosion-resistant and extremely
high strength. The combination of high strength, good toughness, stiffness, and low
density provided by various titanium alloys at very low to moderately elevated
tem-peratures allows weight savings in aerospace structures and other high performance
applications. Titanium and its alloys have the ability to exhibit a high degree of
im-munity to attack by most mineral acids and chlorides [1, 15, 38, 23, 13, 29]. Therefore,
titanium and its alloys are mainly used in two areas of application: strength-efficient
structures and corrosion-resistant service.
Titanium undergoes an allotropic transformation at about 885 degree Celsius,
changing from alpha phase (close-packed hexagonal crystal structure) to beta phase
(body-centered cubic structure). The transformation temperature is strongly affected
by the interstitial elements like oxygen, nitrogen and carbon (alpha stabilizers), which
raise the transformation temperature, and by metallic impurity or alloying elements.
1.4.1
Commercially Pure Titanium Alloy
Commercially Pure Titanium alloys (CP Ti), or commercial grades are a group of
and iron. Table 1.1 shows the compositions for different grades of CP Ti. Titanium
forms an extremely tenacious surface oxide layer, which is an excellent corrosion
inhibitor. Because of this unique corrosion behavior, CP Ti has been used extensively
in prosthetic devices such as bone replacement, knee joints and heart valves [5, 9, 36,
36, 12, 4, 22].
Table 1.1: Chemical composition of CP Ti[1]
Impurity limites(wt %)
UTS(MPa) 0.2% YS(MPa) N C H Fe O Ti Grade 1 240 170 0.03 0.1 0.015 0.2 0.18
Grade 2 340 280 0.03 0.1 0.015 0.3 0.25
Grade 3 450 380 0.05 0.1 0.015 0.3 0.35 balanced Grade 4 550 470 0.03 0.1 0.015 0.5 0.4
Grade 7 340 280 0.03 0.1 0.015 0.3 0.25
1.4.2
Titanium-15 Molybdenum Alloy
Ti 15Mo is a beta titanium alloy that is capable of a wide variety of properties
de-pending on the metallurgical condition. Ti 15Mo used in this thesis is from Allegheny
Technologies Incorporated (ATI) and the metallurgical condition is alpha plus beta
annealed plus aged condition. The alpha plus beta annealed condition consists of
a beta phase (bcc) matrix with a significant volume fraction of alpha phase (hcp).
While the aged condition is classified and confidential. Alpha plus beta Ti 15Mo
pro-vides a good combination of strength and ductility, with UTS of 1150 MPa, YS 1050
MPa, minimum elongation 10% and hardness range 36-40 (HRc). The composition
Table 1.2: Chemical composition of Ti 15Mo[1]
Wt% N C H Fe O Mo Ti
Min - - - 14 balanced
Chapter 2
FRICTION STIR WELDING OF TI 15MO
ALLOYS
2.1 Experiment setup and procedure
2.1.1
Welds made by Friction Stir Welding Process
Development System
Apparatus and procedure
The friction stir welding of Ti 15Mo alloys consists of Process Development System
(Figure 2.1), Ti 15Mo plate, backing plate and welding tool. The Ti 15 Mo plate was
cut from a large plate using a Flow International Corp Bengal 4x4 water jet. The
oxidation layer on the contact surface of the plate was removed by an angle grinder
with 3M bristle disks. The welding parameters are based on Table 2.1, where RPM
stands for rotation per minute and IPM inch per minute.
Table 2.1: Welding parameters for Ti 15Mo
Weld ID Forge force(kN) Rotational speed(RPM) Travel speed(IPM)
2562A 44.48 120 2
2562B 44.48 240 4
2562A 44.48 400 8
2562A 44.48 400 12
2562A 20.02 400 8
Figure 2.1: The Friction Stir Welding Process Development System at USC
right above of the predrilled hole in the Ti 15Mo plate, so the Z-axis of the machine
is aligned well with the center of the predrilled hole. Second, the tool is moved down
until it reaches the bottom of the predrilled hole. Then move the tool close to the
workpiece until they are slightly in contact. Finally, start the spindle. The heat
generated by the friction between the tool and workpiece increases the temperature
quickly. Consequently, material close to the tool is turned into plastic state and swept
around. With the downward pressure and heat input, severe plastic deformation of
the interface results in creation of a joint by metallurgical bonding when the tool
moves. During operation, the tool rotational speed, travel speed, tool position,
Z-force, torque and power were recorded by the FSW system control computer.
Material Preparation
Ti 15Mo plate used in this thesis is from Allegheny Technologies Incorporated (ATI)
and the metallurgical condition is alpha plus beta annealed plus aged condition.
Figure 2.2 shows the Ti 15Mo plate after weld nuggets cut out in selected regions for
metallurgical and mechanical tests.
Figure 2.2: Ti 15Mo plate after weld nuggets cut out in selected regions
shoulder tool. It is made of W-La tool material with 1% Lanthanum. It has a
15 degree conical shape with rounded tip. Two predrilled holes are used to put in
thermocouples, which collect temperature data during weld.
Figure 2.3: Welding tool for Ti 15Mo alloys
Process parameters
The process parameters like forge force and tool rotational speed play an important
Figure 2.4: Schematic diagram of the welding tool for Ti 15Mo alloys
calculations here. The tool’s rotational speed, in the unit of rotation per minute
(RPM) and the tool’s travel speed, in the unit of inch per minute (IPM), are recorded
automatically during the weld. It should be pointed out that for a fixed value of the
rotational speed, an increase in travel speed will result in an increase of power and
torque. This will cause a decrease in weld temperature, giving a decrease in grain
size in the weld nugget zone [27]. However, the weld nugget’s hardness and tensile
strength are not strongly affected by the travel speed. If the travel speed is held at
a constant value, an increase in the rotational speed will cause power and grain size
in the weld nugget to increase. The minimum hardness of the HAZ does not appear
to be unaffected by rotation speed when the forge force and welding speed remain
constant.
free running torque, which are recorded by a torque transducer. Power is calculated
by the following equation:
P =R2π
60τ (2.1)
where R is the rotational speed, τ is the torque and P is the power in the unit of
watts (W). The weld energy (WE) which measures the energy input per unit length
during weld is calculated based on equation, where v is the travel speed in the unit
of meter per second.
W E = P
v (2.2)
The in-plane forces are X and Y forces and their directions are defined by the
coor-dinate system shown in Figure 2.1. A pressure transducer is used to import the X
force data into a weld file which contains various weld and response parameters as a
function of time. The Y force is calculated using equation, where C is the moment
arm factor with value 0.5754
Fy =|Zlolad Cell 1−Zload Cell 2| ×C (2.3)
2.1.2
Sub scale tensile test
Equipment and procedure
Sub-scale tensile tester (Figure 2.9) and digital image correlation (DIC) were used to
obtain the stress-strain curves for all specimens in this thesis. The whole sub-scale
tensile test apparatus is composed of one sub-scale tensile tester, light source and
a CCD camera, as shown in Figure 2.9. The sub-scale tensile tester has a capacity
of 2000 Newtons, which could put a limit on the dimensions of specimens. The
displacement rate was set to be 0.1 mm/s. Force was measured by a load cell in the
sub-scale tester and recorded via Labview software. Displacement was calculated by
DIC. A CCD camera was used to take pictures at 2Hz sampling rate during test. The
c=3.6e-3, subject distance 120 mm, depth of field 0.55 mm [17]. Images taken by the
camera were correlated by Vic2D DIC software to obtain the strain of the specimen.
Figure 2.5: Sub-scale tensile test setup
Figure 2.6 shows the contour of strain distribution on the Ti 15Mo base metal.
Fracture occured close to the center of the sample, as indicated by Figure 2.6.
Material preparation
In order to compare the mechanical properties of the weld along the weld path,
longitudinal cross sections in the weld nuggets (Figure 2.7) were taken out to do
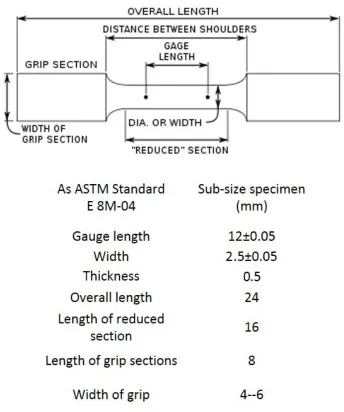
tensile test. Both advancing side and retreating side were machined to the dimensions
suggested by ASTM standard [3], as shown in Figure 2.10. Then 400 and 600 grits
sand papers were used to smooth specimen’s surface. Finally, one side of specimen
was painted with white background and then black dots for DIC use.
Figure 2.7: Relative position where materials are cut out for sub-scale tensile test. Left: dogbone in the longitudinal direction. Right: front view of two dogbones in the advancing side and retreating side.
Figure 2.9 shows the sub-scale tensile test setup and a sample prepared. The
average thickness of samples is 0.5 mm and width 2.35 mm.
2.2 Results and discussions
2.2.1
Parameter study
Table 2.2 shows a summary of weld parameters and tensile test results. APR means
advance per revolution, which is the ratio of IPM and RPM and measures how dense
those semi-rings are. The ultimate tensile strength (UTS) for each specimen is the
Figure 2.8: Dimensions of specimen used by the sub-scale tensile tester
determine which side is bigger. It might be hard to find the correlation between UTS
and RPM/IPM. But if UTS and APR are plotted together, as indicated by figure,
one can see that UTS is inversely proportional to APR. This is due to the fact that
greater APR requires deformation and transportation of a higher volume of material
per revolution, essentially increasing the flow stress [27, 18]. And torque is related to
weld temperature through the effect of temperature on flow stress. A lower torque
corresponds to higher temperature which results in larger grain size. So there is an
Figure 2.9: Sub-scale tensile test setup (left) and dogbone prepared based on Fig-ure 2.10 for tensile test (right).
Table 2.2: Weld parameters and tensile test results
Weld ID Fz(kN) RPM IPM APR τ P WE UTS 2562A 44.48 120 2 0.423 231.8 2.91 34.41 1064 2562B 44.48 240 4 0.423 170.2 4.28 25.26 1055 2562A 44.48 400 8 0.508 159.7 6.69 19.75 983 2562A 44.48 400 12 0.762 178.8 7.49 14.74 896 2562A 20.02 400 8 0.508 51.8 2.17 6.41 1073
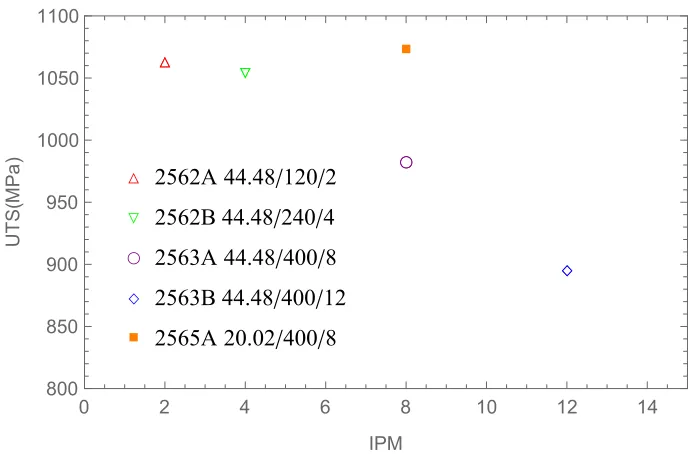
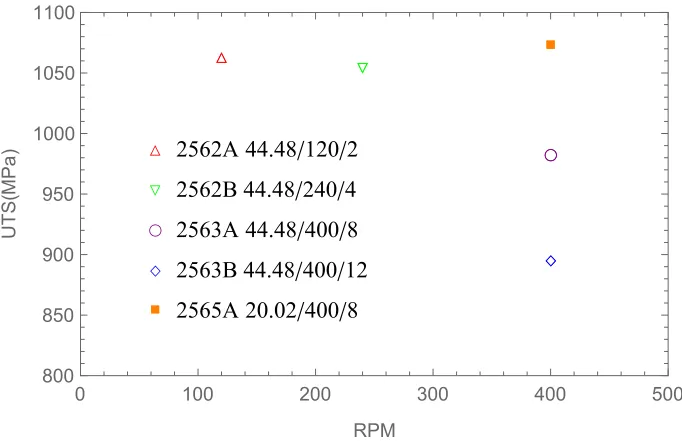
Figure 2.11 and Figure 2.12 show the weld energy as a function of IPM and RPM,
respectively. It can be concluded from the two plots that the weld energy is inversely
proportional to IPM and RPM, which means that the energy input per unit length
decreases when IPM or RPM increases. This can be explained by the fact that weld
energy is also correlated to torque. If RPM is held at constant value while increasing
IPM, torque will increase too. But for Ti 15Mo alloys, the torque increase is not as
significant as IPM. Hence, weld energy decreases as IPM increases.
2.2.2
Vickers hardness
First, metallographic samples were cut from welds using an abrasive water jet cutter.
△ △ ▽ ▽ ○ ○ ◇ ◇ ■ ■
△ 2562A 44.48/120/2
▽ 2562B 44.48/240/4
○ 2563A 44.48/400/8
◇ 2563B 44.48/400/12
■ 2565A 20.02/400/8
0.0 0.2 0.4 0.6 0.8 1.0
800 850 900 950 1000 1050 1100
APR(mm/2π)
UTS
(
MPa
)
Figure 2.10: Ultimate tensile strength VS advancing per revolution for Ti 15Mo welds
△ △ ▽▽ ○ ○ ◇ ◇ ■ ■
△ 2562A 44.48/120/2
▽ 2562B 44.48/240/4
○ 2563A 44.48/400/8
◇ 2563B 44.48/400/12
■ 2565A 20.02/400/8
0 2 4 6 8 10 12 14
800 850 900 950 1000 1050 1100 IPM UTS ( MPa )
Figure 2.11: Weld energy VS travel speed for Ti 15Mo welds
samples were ground using 240, 400, 600, 800, 1200 grit silicon carbide waterproof
paper. Third, they were polished by hand using 9µm, 6µm, 3µm, and 1µm diamond
compounds and then colloidal silica (< 0.05µm). Indents were made in the center of
weld in horizontal direction with load force (F) 500 g, traversing base metal, HAZ,
△ △ ▽▽ ○ ○ ◇ ◇ ■ ■
△ 2562A 44.48/120/2
▽ 2562B 44.48/240/4
○ 2563A 44.48/400/8
◇ 2563B 44.48/400/12
■ 2565A 20.02/400/8
0 100 200 300 400 500
800 850 900 950 1000 1050 1100 RPM UTS ( MPa )
Figure 2.12: Weld energy VS rotation per minute for Ti 15Mo welds
and Eq (2.5), where F is the load force in the unit of gram force, x and y are the
horizontal and vertical distances in the unit of microns of the indents respectively.
The spacing for those indents is 0.635 mm.
HV = 1854× F
d2 (2.4)
d = 1x+y
2 (2.5)
The following figures show the Vickers hardness profile on Ti 15Mo welds in the base
metal, HAZ and weld nugget. Note that the left half of each figure corresponds to
the retreating side of the weld. It can be seen from these hardness distributions that
the Vickers hardness distribution of each weld forms like a squeezed ”W" shape with
minimum hardness located in HAZ, which is coincident with the location of fracture.
One can draw two conclusions when compared with these five hardness distribution
plots: one is that on average, the hardness of retreating side is higher than that of
the advancing side; another is that the width of HAS on the advancing side is almost
as big as that of the retreating side.
Figure 2.13: Vickers hardness distribution with respect to the center line of weld for 2562A (left) and 2562B (right).
Figure 2.14: Vickers hardness distribution with respect to the center line of weld for 2563A (left) and 2563B (right).
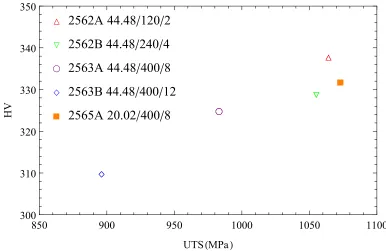
The Vickers hardness is proportional to UTS. For a lower UTS, the corresponding
Vickers hardness is also smaller. It was anticipated that decreasing heat input leads
to increased minimum HAZ hardness eventually reducing the overall width of the
HAZ[28]. ó ó õ õ ç ç í í à à
ó
2562A 44.48
•
120
•
2
õ
2562B 44.48
•
240
•
4
ç
2563A 44.48
•
400
•
8
í
2563B 44.48
•
400
•
12
à
2565A 20.02
•
400
•
8
850 900 950 1000 1050 1100
300 310 320 330 340 350
UTSHMPaL
HV
Figure 2.16: Vickers hardness distribution VS ultimate tensile strength.
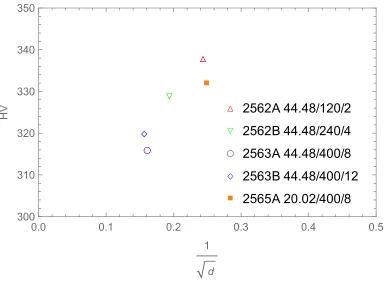
Figure 2.17 shows the effect of grain size on Vickers hardness. It can be shown
that reducing the grain size will cause the material’s HV to increase.
2.2.3
Microstructure
Samples were etched using Kroll’s Reagent (Kroll’s Reagent: 92 ml water, 6 ml
HN O3 and 2 ml HF) for 18 seconds to reveal the macro-structure. Then grain size
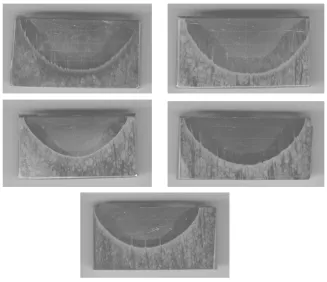
measurement was carried out nearby indents for convenient reference. Figure 2.18
shows the scanned cross section for each weld after etching. Optical microscopy
was used to show the microstructure distribution along the transeversal direction
△ △ ▽ ▽ ○ ○ ◇ ◇ ■ ■
△
2562A 44.48/120/2
▽
2562B 44.48/240/4
○
2563A 44.48/400/8
◇
2563B 44.48/400/12
■
2565A 20.02/400/8
0.0 0.1 0.2 0.3 0.4 0.5
300 310 320 330 340 350 1 d HV
Figure 2.17: Vickers hardness VS √1 d
Vickers hardness (HV) results for welds under different weld condition. It should be
pointed out that grain size and Vickers hardness data are the average values in the
weld nugget.
Table 2.3: Weld parameters and tensile test results
Weld ID RPM IPM APR(mm/rev) GS(µm) P(kW) HV UTS(MPa)
2562A 120 2 0.423 16.86 2.91 343 1064
2562B 240 4 0.423 26.67 4.28 325 1055
2562A 400 8 0.508 38.69 6.69 316 983
2562A 400 12 0.762 40.94 7.49 320 896
2562A 400 8 0.508 16.15 2.17 326 1073
Figure 2.19, Figure 2.20 and Figure 2.21 show detailed distribution of grain size
on the welds. The center of the weld nugget is used as a reference line and all other
quantities are measured from this line. The distance between two vertical dashed
Figure 2.18: Scanned cross section of 2562A (top left), 2562B (top right), 2563A (middle left), 2563B (middle right) and 2565A (bottom). The height of each weld is 17.5 mm
two solid vertical lines right next to the pin’s edge mark the boundary of the weld
nugget, which varies for different weld parameter and the distance of which is on the
order of millimeter. The distance between two vertical dot-dashed lines corresponds
to the diameter of the tool’s shoulder, which has a value of 19.05 mm. It should be
pointed out that the left side corresponds to the retreating side of the weld, right to
advancing side. Note that the grain size in HAZ is on the order of millimeter, which
is too big to be shown in these plots. Based on the digital image correlation result of
the Ti 15 Mo base metal, it has an average grain size of 13.02 µm, Vickers hardness
364 and ultimate tensile strength 1183 MPa. It can be concluded from these grain
size distribution plots that the grain size in the weld nugget is bigger than that of
the base, which can be explained by the fact that weld nugget received significant
slightly bigger than that of base metal, which indicates certain heat treatment during
weld.
Figure 2.19: Grain size distribution with respect to the center line of weld for 2562A (left) and 2562B (right).
Figure 2.20: Grain size distribution with respect to the center line of weld for 2563A (left) and 2563B (right).
Figure 2.22 shows the correlation between average grain size of nuggets and
weld-ing power. It is clearly shown that grain size is proportional to weldweld-ing power, which
follows the same trend as found in other projects [35, 28]. Because welding power is
proportionally related to temperature of weld. As the welding power is increased, the
peak temperature of weld nugget will be increased too. Consequently, the grain size
of weld nugget will be bigger for higher power input.
Figure 2.23 shows the ultimate tensile strength as a function of grain size. It
Figure 2.21: Grain size distribution with respect to the center line of weld for 2565A. △ △ ▽ ▽ ○ ○ ◇◇ ■ ■
△ 2562A 44.48/120/2
▽ 2562B 44.48/240/4
○ 2563A 44.48/400/8
◇ 2563B 44.48/400/12
■ 2565A 20.02/400/8
10000 2000 3000 4000 5000 6000 7000 8000 10 20 30 40 50 Power(kW) Grain Size ( μ m )
Figure 2.22: Grain size VS power for Ti 15Mo welds
size increases. Because grain size is proportional to welding power and temperature,
Figure 2.23 also implies that ultimate tensile strength is inversely proportional to
temperature. The lower the peak temperature of the weld, the stronger it will be.
Figure 2.24 shows the ultimate tensile strength as a response to different
advanc-ing per revolutions. Bigger advancadvanc-ing per revolution is indicative of higher weldadvanc-ing
temperature as greater APR requires deformation and transportation of a higher
vol-ume of material per revolution. The decrease of ultimate tensile strength is attributed
△ △ ▽▽ ○ ○ ◇ ◇ ■ ■
△ 2562A 44.48/120/2
▽ 2562B 44.48/240/4
○ 2563A 44.48/400/8
◇ 2563B 44.48/400/12
■ 2565A 20.02/400/8
0 10 20 30 40 50 60
800 850 900 950 1000 1050 1100 Grain Size(μm) UTS ( MPa )
Figure 2.23: Ultimate tensile strength VS grain size for Ti 15Mo welds
△ △ ▽ ▽ ○ ○ ◇ ◇ ■ ■
△ 2562A 44.48/120/2
▽ 2562B 44.48/240/4
○ 2563A 44.48/400/8
◇ 2563B 44.48/400/12
■ 2565A 20.02/400/8
0.0 0.2 0.4 0.6 0.8 1.0
800 850 900 950 1000 1050 1100
APR(mm/2π)
UTS
(
MPa
)
Figure 2.24: Ultimate tensile strength VS advancing per revolution for Ti 15Mo welds
Figure 2.25 shows the effect of grain size on the ultimate tensile strength, or the
Hall-Petch strengthening. It can be concluded that decreasing grain size will cause an
increase in UTS. Grain boundaries impede dislocation movement and the number of
dislocations within a grain have an effect on the UTS. The number of dislocations can
grain to grain. So, reducing grain size during weld process by introducing water spray
can influence dislocation movement. Consequently, the ultimate tensile strength will
be increased. △ △ ▽ ▽ ○ ○ ◇ ◇ ■ ■
△
2562A 44.48
/
120
/
2
▽
2562B 44.48
/
240
/
4
○
2563A 44.48
/
400
/
8
◇
2563B 44.48
/
400
/
12
■
2565A 20.02
/
400
/
8
0.0 0.1 0.2 0.3 0.4 0.5
800 850 900 950 1000 1050 1100 1 d UTS ( MPa )
Figure 2.25: Hall-Petch strengthening
2.2.4
Fractography
The scanning electron microscope (SEM) was used to check the fracture surface after
sub-scale tensile test for each weld. Figure 2.26 shows a typical fracture surface for
Ti 15Mo welds. Figure 2.27 shows the elongation data for each weld in the advancing
side and retreating side, respectively. It seems more ductile in the advancing side and
more brittle in the retreating side.
2.3 Conclusions for Ti 15Mo welds
Figure 2.26: SEM images taken on the fracture surface of weld 2563B.
2562A 44.48/120/2 2562B 44.48/240/4 2563A 44.48/400/8 2563B 44.48/400/12 2565A 20.02/400/8 0
5 10 15 20
ϵ
(%
)
AS RS
Figure 2.27: Comparison of elongations in the advancing side and retreating side.
• UTS is inversely proportional to APR.
• WE is inversely proportional to IPM.
• HV distribution forms a squeezed W shape with minimum in HAZ.
• HV is proportional to UTS.
• UTS is inversely proportional to GS, which indicates that UTS is inversely
Chapter 3
FRICTION CONSOLIDATION OF Alpha and
beta titanium chips
3.1 Alpha and beta types titanium chips consolidation
3.1.1
Experiment design
Apparatus and procedure
The friction consolidation of CP Ti and Ti 15Mo alloys consists of a Process
Devel-opment System (Figure 2.1), a consolidation die, a billet chamber and a back plate.
The consolidation die is made of tungsten with 1 % Li and a diameter of 39 mm and
length 180 mm (Figure 3.1). Because tungsten based tools and polycrystalline cubic
boron nitride tools and are preferred due to high strength and hardness at elevated
temperature [24]. The top of the consolidation die has a scrolled surface, which
ro-tates in the clockwise direction when facing down in experiment). The purpose of
this design pattern is to transport plastic-state material toward the center. The billet
chamber is composed of a chamber made of O1 tool steel with an inner diameter
40 mm. Right outside the chamber is a steel ring with four holes. Four cartridge
heaters are put into these holes to preheat the chamber to a certain temperature
(Figure 3.2). A stainless steel plate is used as the back plate to support the chips
during consolidation. Finally, argon gas is used to protect the chips and consolidated
disc from oxidation.
Figure 3.1: Top and side views of the friction consolidation scroll die
Figure 3.2: Friction consolidation setup (left) and heat generator (right)
rotation axis of the spindle is aligned properly with the chamber. The chamber is
preheated to 200 degree Celsius. Then a fully mixed chips of CP Ti chips and Ti 15Mo
chips are put in the chamber. Each weighs 16 grams. After loading, these chips are
pre-compacted using a force of 8900 N for ten seconds. Next, the argon protection gas
is turned on. Finally, those chips are friction-consolidated for 60 seconds with 22.24
kN forge force and 500 RPM. This procedure is repeated two more times. So totally,
3 charges of fully mixed alpha Ti chips and beta Ti chips are used for consolidation.
Material Preparation
CP Ti chips and Ti 15 Mo chips are prepared in this step. These chips are made by
a milling machine using Eq (3.1), where tc is the average thickness of chips, v is the
teeth on the cutter periphery, d is the depth of cut and D is the cutter diameter,
tc= 2v N n
s d
d (3.1)
Table 3.1: Statistical result of chips made by the milling machine
t(mm) σt(mm) w(mm) σw(mm) CP Ti 0.104 0.012 2.11 0.08 Ti 15Mo 0.067 0.008 1.98 0.1
Table 3.1 shows the statistical results of chips made by the milling machine. It
should be pointed out that t andw are the average thickness and width of chips and
σt and σw are their variance, respectively. The average length of these chips is about
9 mm.
Due to limitation of size and number of consolidated discs, one disc is used to
do the compression test and another one for tensile test. The compression test was
performed on the small cylinders cut by electrical discharge machining (EDM), as
shown in Figure 3.3. These cylinders were ground and polished using same steps
mentioned in chapter 2. The one used for tensile test was cut in half vertically along
the radial direction. One half was used to carry out grain size and Vickers hardness
measurements and another half was cut into several dog-bones to do the tensile test
based on method explain in the last chapter.
3.1.2
Results and analyzes
Grain size distribution
Because of the torsional crack, only two consolidated discs were made. Figure 3.4
and Figure 3.5 show these two consolidated discs with different. Both of them were
Figure 3.3: Schematic diagram of positions where small cylinders were cut by electri-cal discharge machining
# 4161 was used for compression test, the result of which will be given in the next
subsection. Weld # 4162 was cut into two halves, one half for grain size and Vickers
hardness measurements and another half cut for sub-scale tensile test.
Figure 3.4: Top, bottom and side views of consolidated disc (weld # 4161)
Figure 3.5: Top, bottom and side views of consolidated disc (weld # 4162)
Figure 3.6 shows the scanned cross section of the consolidated disc after etching.
The center and peripheral regions on the top and bottom sides were checked carefully.
Only two cracks were found in appearance on the top left and top right corners of
distinctive layers can be found on this disc: the bottom one, the middle one and the
top one. Microstructure images were taken on these regions to evaluate the grain size
distribution using an optical microscope.
Figure 3.6: Scanned cross section of the consolidated disc after etching (weld # 4162)
The bottom left and bottom right corners formed the first layer because most
material was stuffed to the consolidation die during the first trial. Chips were fully
consolidated but not fully recrystallized, as indicated by the middle two small pictures
in Figure 3.7, where CP Ti chips and Ti 15 Mo chips remains distinguishable.
The middle part was the second layer and only part of this layer was recrystallized.
In this layer, part of these two different chips was “welded” together under high
compressive force and torque. These chips might be softened by heat generated by
severe plastic deformation and heat from the bottom first layer.
The top layer is the most interesting layer as it forms like a bowl shape. The
grain size in the bowl shape region is close to equiaxed, which is also indicative of
recrystallization. There are several clear bands along the boundary between the bowl
shape region and other partial recrystallized region, as show in Figure 3.8. This
banded structure could be due to flow patterns caused by thermal-mechanical cycle
during consolidation. Its pattern seems quite similar to onion ring nugget structure
found in friction stir welds citeMuthukumaran,Krishnan. Compared with the grain
Figure 3.7: Grain size distribution of the consolidated disc (weld # 4162)
All these three fully consolidated layers indicate that alpha type and beta type of
titanium chips can be successfully stir-compressed into solid disc through friction
consolidation.
Vickers hardness distribution
Vickers hardness data was measured on the left half surface of the vertical cross
section of weld # 4162. 26 vertical lines with 22 indentations on each line were
used to make the Vickers hardness map, as shown in Figure 3.9. The spacing for
two nearest indentations is 0.635 mm. So totally there are 1122 indentations with
maximum Vickers hardness 550 and minim 210. It can be seen from the Vickers
Figure 3.8: Grain size distribution nearby the boundary of the bowl shape region and other regions
region, the material of which was recrystallized and grain size uniform. Whereas
low hardness regions are those consolidated or partial recrystallized regions. Three
methods can be used to explain this abnormal high Vickers hardness distribution, the
process peak temperature, cooling rate and reprecipitation. It is expected that the
peak temperature for the top layer should be relatively higher than that of middle and
bottom layers, but the grain size and Vickers hardness predicted a lower temperature
as lower temperature indicates smaller grain size and higher hardness. The cool
rate of the consolidated disc could play an important role in the explanation of high
hardness. When the consolidation die was pulled out of the chamber, the top layer
was in contact with air immediately. This could result in a relatively fast cooling
rate and also brittle property of the top layer. Reprecipitaion could increase the yield
still not clear what contributed most to the high hardness.
Figure 3.9: Area where indents were made (top) and Vickers hardness distribution of the consolidated disc weld # 4162 (bottom)
Compression test
In order to determine the correlation between high Vickers hardness and mechanical
properties, two compression tests were performed using a tensile frame. The relative
positions where these two small cylinders were taken from are shown in Figure 3.3.
The first one was taken from the region close to the edge of the consolidated disc in
order to determine the bondage between different layers. The second one was taken
close to the center of the disc, where high hardness appears.
Figure 3.10 shows the cylinder’s side surface after compression test. It is obvious
Figure 3.10: Compression test on the small cylinder labelled as 1
they are loosely bonded together. Figure 3.11 shows the compression test result
for cylinder labelled with 2. Although ship happened near the bottom part of the
cylinder (slip region is between the top layer and the middle), crack did occur on the
side surface of the cylinder during test. The angle made by the crack direction and
the vertical axis of the cylinder is 45 degrees. And those banded structures became
more distinctive.
In order to make comparisons with base metal CP Ti and Ti 15Mo alloys, the
compression test was also performed on cylinders with the same dimension from these
two alloys (Figure 3.12). Cylinder from CP Ti had a wrinkled surface and experienced
barreling during compression, shown in Figure 3.13, which means that CP Ti alloy is
ductile. Cylinder from Ti 15Mo had a cracked surface, as seen in Figure 3.14. The
cracked surface of Ti 15Mo cylinder could be indicative of brittle material. Table 3.2 is
Figure 3.11: Compression test on the small cylinder labelled as 2
Figure 3.12: Base metal compression test for CP Ti (left) and Ti 15Mo(right)
Table 3.2: Compression test results
# E(GPa) YS(MPa) ∆H(%) Finish CP Ti 110 415 -39.2 barreling Ti 15Mo 75 1220 -40.4 crack(π4) Disc(3R4 ) 110 852 -2.27 slip
Disc(R
4) 110 1372 -14.8 crack( π 4)
Tensile test
Two tensile bars with the same dimensions as described in Chapter 2 were cut to
Figure 3.13: Compression test on base metal of CP Ti
Figure 3.14: Compression test on base metal of Ti 15Mo
another one is in the bottom part with relatively low hardness, shown in Figure 3.15.
The purpose of tensile test in the blue region is to find the mechanical properties
related to this particular region with high hardness and try to correlate the Vickers
hardness profile with the tensile test results. The aim of performing tensile test on
bonded in this partial recrystallized region.
Figure 3.15: Relative position where tensile bars are cut from
Figure 3.16 shows the contour of strain distribution right break in the high Vickers
hardness region, shown in Figure 3.9. Fracture occurred close to the center of the
sample, where low Vickers hardness dominated and localized deformation occured
during test.
Figure 3.17 shows the stress-strain curves from sub-scale tensile tests for the top
and bottom bars, base metal of CP Ti and Ti 15Mo. The tensile bar in the high
hardness region broke without yielding, as indicated by the sudden drop in the
stress-strain curve. The position where the top tensile bar broke was found to be the center
of the sample, where HV is relatively low compared with nearby regions. The sudden
drop could also be explained by this particular region that most deformation occured
in this low HV region during test. The ultra high Vickers hardness in this region
might be due to the increased O2 content. The one in the partially recrystallized
region has a standard stress strain curve. Table 3.3 summarized the subscale tensile
test results, where E is Young’s modulus, YS is yield stress, UTS is ultimate tensile
Figure 3.16: Contour plot of strain given by DIC in the high Vickers hardness region
Table 3.3: Subscale tensile test results for tensile bars from top and bottom regions of the consolidated disc, base metal of CP Ti and Ti 15 Mo
# E(GPa) YS(MPa) UTS(MPa) El(%)
CP Ti 83 296 418 15.2
Ti 15Mo 118 1220 -40.4 2.9
top 163 N/A 1429 1.2
bottom 105 606 793 8.6
Compositional analysis
Energy Dispersive X-ray Spectroscopy (EDS), a qualitative and quantitative X-ray
microanalytical technique that can provide information about the elemental
compo-sition of a sample, is used to perform the compocompo-sitional analysis of the consolidated
top bottom Ti 15Mo CP Ti
0.00 0.02 0.04 0.06 0.08 0.10 0.12 0.14 0 200 400 600 800 1000 1200 1400 Strain Stress ( MPa )
Figure 3.17: Stress-strain curves of tensile bars from top and bottom regions of the consolidated disc, base metal of CP Ti and Ti 15 Mo
of the consolidated disc. The kα and Lα for titanium are 4.51 keV and 0.452 keV,
where capital Roman letter indicates the shell containing the inner vacancy (K, L
or M) of the titanium element electron configuration and Greek letter specifies the
group to which the line belongs in order of decreasing importance (α,β, etc.). Thekα
and Lα for molybdenum are 17.48 keV and 2.29 keV, respectively. Four peaks clears
indicates the appearance of titanium and molybdenum elements with titanium as the
dominated element.
Back scattered electrons are electrons that have been emitted from the primary
beam and have interacted elastically with the test sample’s atoms. These electrons
are bounced back almost in the same direction as the one they came from, and with
very little energy loss. Chemical elements that have a high atomic number produce
more back scattered electrons than those with a low atomic number. So areas of
the sample with a high atomic number look whiter than the ones with a low atomic
number, known as phase contrast. It can be used to assess the chemical homogeneity
Figure 3.18: EDS result in the red region for the consolidated disc
scattered white areas correspond to the appearance and abundance of molybdenum
and dark ones are titanium as the atomic number of Mo is bigger than Ti. The lack
of sharp contrast indicates homogeneous distribution of Ti and Mo, which can be
used as an evidence of recrystallization.
Figure 3.19: BSE result for the consolidated disc
of the top layer (Figure 3.18), which high Vickers hardness data are measured from
and CP Ti chips and Ti 15Mo chips are undistinguishable. It can be concluded that
alpha type chips and beta type chips were fully mixed and consolidated during friction
processing and recrystallization was evident based from the uniform distribution of
these two elements and grain size distribution result. A white line with length of
16 µm (Figure 3.21) was used to analyze the composition of material in this region.
Table 3.4 shows the element counts, atom percentage and weight percentage for TiK
and MoL along this line. The weight percentage for MoL on this line is 12.92 %,
which is slightly lower than that of Ti 15Mo base metal.
Figure 3.20: Distribution of Ti and Mo elements in the high Vickers hardness region
Figure 3.21: Distribution of Ti and Mo elements in the high Vickers hardness region (left) and element counts for TiK and MoL
Figure 3.22 shows the distribution of Ti and Mo elements in the left corner of the
bottom layer, where CP Ti chips can be distinguished from that of Ti 15Mo. The left
one is the scanning electron image with height of 35µm. Areas that are brighter than
Table 3.4: Compositional analysis results for while line in Figure 3.21
Counts At(%) Wt(%) MoL 852 7.41 12.92
TiK 63 92.59 87.08
darker areas are CP Ti chips. Because the atomic number of molybdenum is higher
than that of titanium, there are more back scattered electrons from molybdenum than
titanium, resulting brighter areas for Ti 15Mo chips. The right one is a distribution
of titanium element with uniform distribution from CP Ti chips and shaded areas
from Ti 15Mo chips. Figure 3.23 shows the statistical result of the distribution of Ti
and Mo elements in this area. It can be seen from the weight comparison that there
are more Ti 15Mo chips than CP Ti chips in this area.
Figure 3.22: Distribution of Ti and Mo elements in the region where CP Ti chips can be distinguished from Ti 15Mo chips (mapping)
3.2 Conclusions of friction consolidation of alpha and beta chips
The following shows itemized conclusions for research on friction consolidation of CP
Figure 3.23: Statistical result for the distribution of Ti and Mo elements in the region where CP Ti chips can be distinguished from Ti 15Mo chips (mapping)
• HV distribution is indicative of UTS. UTS is higher in the high HV region,
relatively lower in other regions.
• Microstructure shows fine, equiaxed GS distribution in the high HV region and
fully consolidated in other regions.
• Both compression test and sub-scale tensile test show that the UTS in high HV
region is higher than that of Ti 15Mo.
• It is expected new titanium alloys could be produced or friction consolidation
Chapter 4
CONCLUSIONS AND FUTURE WORK
4.1 Conclusions
4.1.1
Friction stir welding of Ti 15Mo alloys
Optimal parameter
Several conclusions can be drawn from chapter 2 based on the results of friction stir
welding of Ti 15Mo. First, the correlation between the grain size of welds and power
is obvious (Figure 4.1): grain size is proportional to power, same results as found
in other welds [28, 35]. As the welding power is increased, the peak temperature
of weld nugget will be increased too. Consequently, the grain size of weld nugget
will be bigger for higher power input. Second, ultimate tensile strength is inversely
proportional to advancing per revolution (Figure 4.2). This is due to the fact that
greater APR requires deformation and transportation of a higher volume of material
per revolution, essentially increasing the flow stress [27]. And torque is related to
weld temperature through the effect of temperature on flow stress. A lower torque
corresponds to higher temperature which results in larger grain size. Third, weld
energy is inversely proportional to IPM (Figure 4.3). Fourth, in general, Vickers
hardness is proportional to the UTS (Figure 4.4). Finally, ultimate tensile strength
△ △ ▽ ▽ ○ ○ ◇◇ ■ ■
△ 2562A 44.48/120/2
▽ 2562B 44.48/240/4
○ 2563A 44.48/400/8
◇ 2563B 44.48/400/12
■ 2565A 20.02/400/8
10000 2000 3000 4000 5000 6000 7000 8000 10 20 30 40 50 Power(kW) Grain Size ( μ m )
Figure 4.1: Grain size VS power for Ti 15Mo welds
△ △ ▽ ▽ ○ ○ ◇ ◇ ■ ■
△ 2562A 44.48/120/2
▽ 2562B 44.48/240/4
○ 2563A 44.48/400/8
◇ 2563B 44.48/400/12
■ 2565A 20.02/400/8
0.0 0.2 0.4 0.6 0.8 1.0
800 850 900 950 1000 1050 1100
APR(mm/2π)
UTS
(
MPa
)
Figure 4.2: Ultimate tensile strength VS advancing per revolution for Ti 15Mo welds
4.1.2
Friction consolidation on CP Ti and Ti 15Mo chips
Tensile test
The sub-scale tensile test results for tensile bars from fully recrystallized region and
Figure 4.3: Weld energy VS IPM for Ti 15Mo welds ó ó õ õ ç ç í í à à ó 2562A 44.48•120•2
õ 2562B 44.48•240•4
ç 2563A 44.48•400•8
í 2563B 44.48•400•12
à 2565A 20.02•400•8
850 900 950 1000 1050 1100
300 310 320 330 340 350
UTSHMPaL
HV
Figure 4.4: Vickers hardness distribution VS ultimate tensile strength.
strength in the high Vickers hardness region should be higher than 1500 MPa if
the sample didn’t break suddenly. So more tensile tests should be done in order to
find the true ultimate tensile strength in this particular area. The strength for the
partially recrystallized region is between that of Ti 15Mo and CP Ti, but the ductility
△ △ ▽▽ ○ ○ ◇ ◇ ■ ■
△ 2562A 44.48/120/2
▽ 2562B 44.48/240/4
○ 2563A 44.48/400/8
◇ 2563B 44.48/400/12
■ 2565A 20.02/400/8
0 10 20 30 40 50 60
800 850 900 950 1000 1050 1100 Grain Size(μm) UTS ( MPa )
Figure 4.5: Ultimate tensile strength VS grain size for Ti 15Mo welds
be done in the high hardness region. If UTS could be confirmed, it would be useful
and interesting to find the material composition in this area.
Correlation between Vickers hardness and tensile strength
The following shows itemized conclusions for research on friction consolidation of CP
Ti and Ti 15Mo chips.
• HV distribution is indicative of UTS. UTS is higher in the high HV region,
relatively lower in other regions.
• Microstructure shows fine, equiaxed GS distribution in the high HV region and
fully consolidated in other regions.
• Both compression test and sub-scale tensile test show that the UTS in high HV
region is higher than that of Ti 15Mo.
• It is expected new titanium alloys could be produced or friction consolidation