University of South Carolina
Scholar Commons
Theses and Dissertations
2016
Development Of A Luminescent Polymer Sensor
Array For The Discrimination Of Carboxylates
And Further Improvements In A Solvent
Programmable Polymer
William J. Richardson
University of South Carolina
Follow this and additional works at:https://scholarcommons.sc.edu/etd Part of theChemistry Commons
This Open Access Thesis is brought to you by Scholar Commons. It has been accepted for inclusion in Theses and Dissertations by an authorized administrator of Scholar Commons. For more information, please [email protected].
Recommended Citation
D
EVELOPMENT OF AL
UMINESCENTP
OLYMERS
ENSORA
RRAY FOR THED
ISCRIMINATION OFC
ARBOXYLATES ANDF
URTHERI
MPROVEMENTS IN AS
OLVENTP
ROGRAMMABLEP
OLYMERby
William J. Richardson
Bachelor of Science Colorado State University, 2012
Submitted in Partial Fulfillment of the Requirements
For the Degree of Master of Science in
Chemistry
College of Arts and Sciences
University of South Carolina
2016
Accepted by:
Ken D. Shimizu, Director of Thesis
Andrew B. Greytak, Reader
DEDICATION
ABSTRACT
This thesis summarizes the work performed on two stimuli responsive polymer projects.
The first project used a lanthanide based luminescent polymer to create a sensor array for
carboxylate analytes. Initial attempts incorporated molecular imprinting as a means to incorporate
unique selectivity into the polymer by introducing acetate, benzoate, and phenylacetate as templates
prior to polymerization. This process was successful at creating unique sensing elements for the
array, but the polymers lacked the specific selectivity typically seen in molecularly imprinted
polymers (MIPs). Instead, a ligand displacement mechanism that relied on multiple sensors with
different labile anion ligands directly complexed with the europium center was utilized. This
system resulted in unique response patterns with the introduction of carboxylate analytes, which
were characterized using linear discriminant analysis (LDA).
The second project re-examined our group’s theory about our solvent programmable
polymer (SPP). Specifically, previous evidence suggested that the SPPs undergo a conformational
change when heated and then cooled in a nonpolar solvent due to a dimerization between the
carboxylate functional groups. To expand the utility of this unique polymer, synthetic modifications
were made to the functional monomer in order to replace the ring opened metathesis polymerization
TABLE OF CONTENTS
DEDICATION ... iii
ABSTRACT ... iv
LIST OF TABLES ... vii
LIST OF FIGURES ... viii
LIST OF SCHEMES ... ix
CHAPTER 1:LUMINESCENT POLYMER SENSOR ARRAY FOR SENSING CARBOXYLATES ...1
1.1ABSTRACT ...1
1.2INTRODUCTION ...1
1.3MIPSENSOR ARRAY ...4
1.4ANION DISPLACEMENT POLYMER SENSOR ARRAY ...9
1.5EXPERIMENTAL ...21
1.6REFERENCES ...24
CHAPTER 2:SOLVENT PROGRAMMABLE POLYMER ...26
2.1ABSTRACT ...26
2.2INTRODUCTION ...27
2.3“TURN-OFF”DIMERIZATION ...28
LIST OF TABLES
Table 1.1 Analytes and anions for sensor array ...11
LIST OF FIGURES
Figure 1.1 Comparison of old to new polymers ...5
Figure 1.2 MIP and NIP emission at 616 nm ...6
Figure 1.3 Luminescent response patterns of MIP array ...7
Figure 1.4 LDA plots of MIP array ...8
Figure 1.5 Emission vs. concentration of A1 ...12
Figure 1.6 Concentration titration of A1, A2, and A3 ...13
Figure 1.7 Emission response of anion array ...14
Figure 1.8 Emission variance of anion array ...15
Figure 1.9 LDA plot of anion array ...17
Figure 1.10 Reusability study of polymer array ...18
Figure 1.11 Correlation of F1 to change in emission...19
LIST OF SCHEMES
Scheme 1.1 Eu-salen polymer synthesis and structure ...3
Scheme 1.2 Anion displacement array ...10
Scheme 1.3 Synthesis of 2-hydroxy-4-(4-vinylbenzyloxy)benzaldehyde ...21
Scheme 1.4 Salen ligand synthesis ...22
Scheme 2.1 Preliminary hypothesis of SPP mechanism ...28
Scheme 2.2 Preparation of SPP ...28
Scheme 2.3 Updated hypothesis of SPP mechanism ...29
Scheme 2.4 Synthesis route for acrylate functional monomer ...31
Scheme 2.5 New proposed route for acrylated monomer ...32
Scheme 2.6 2-amino-3-methylbenzoic acid synthesis ...33
Scheme 2.7 Synthesis for functional ROMP monomer ...33
Scheme 2.8 Synthesis for ROMP crosslinker ...34
Scheme 2.9 Synthesis of t-butyl protected monomer ...35
Scheme 2.10 Oxidation of norbornene C=C bond ...36
Scheme 2.11 Acrylamide coupling reaction ...37
CHAPTER
1
L
UMINESCENTP
OLYMERS
ENSORA
RRAY FORS
ENSINGC
ARBOXYLATES1.1ABSTRACT
The goal of the first project was to imbue individual polymers with enough
selectivity to create a luminescent sensor array capable of distinguishing structurally
similar carboxylates. Initially, molecular imprinting developed for this system by Di Song
and improved by Yang Xu was reproduced and analyzed using linear discriminant analysis.
Despite 100% cross validation accuracy of the array, the MIPs did not show selective
binding. This suggests that the array functioned as a non-specific array and the steps to
achieve a MIP were excessive and unnecessary. A simpler method to create individual
sensors was employed. An anion ligand exchange mechanism was designed based on the
non-imprinted polymer (NIP). The exchange of anionic ligands to develop unique sensing
elements proved effective and efficient. Nine carboxylic acid analytes were tested and
100% cross validation accuracy was achieved from the unique response patterns.
1.2INTRODUCTION
A europium-based luminescent polymer sensor array was tested for applicability in
distinguishing carboxylates. Luminescent and fluorescent materials are highly desirable for
sensing applications because of the direct in situ response.1, 2 The two primary methods of
emission-based sensing involve the analyte interacting with the sensor to produce an
analyte interaction. With the second method, a change in emission intensity can either
increase (turn-on) or decrease (turn-off) with the addition of an analyte. Quenching the
emission, as a sensing technique, can be problematic because increasing analyte
concentration decreases the signal until the signal cannot be distinguished from the baseline
error. Turn-on fluorescence is preferable because it allows for a lower detection limit due
to the lack of background emission. The system described in this chapter demonstrated a
turn-on fluorescence with the addition of analytes.
Lanthanide fluorescence occurs at a narrow spectral bandwidth making it ideal for
a variety of sensing applications. Unfortunately, the fluoresce is also very weak. However,
light absorbing organic ligands can be complexed to the lanthanides to increase the
emission intensity. This significant increase in intensity occurs because the excited
bandgaps of the organic complex are at a higher energy level than the lanthanide. Excited
electrons are therefore able to transfer into the excited energy level of the lanthanide
causing a significant increase in the emission intensity of the lanthanide. The emission at
618 nm for europium has been identified as the 5D0 to 7F2 transition.3 Enveloping the metal
ion in an organic ligand also protects the lanthanide center from solvent and self-quenching
effects. A luminescent polymer based on Borovik’s design shown in Scheme 1 was used
as the basis for this project.4 This polymer system affords direct binding sites to the
europium center while anchoring the complexed lanthanide into a polymer framework
Scheme 1.1. Synthesis and polymerization of the Eu-salen complex designed by Borovik and co-workers with x being the binding sites for the template molecules.4
Carboxylic acids represent a diverse class of organic compounds that occur in
nature as biological building blocks and industrially as food and pharmaceutical products.5,
6 Due to the wide scope of uses and structural variety, sensors to detect and distinguish
carboxylic acids are of significant interest. Most existing carboxylate sensor arrays are
single molecule systems that require individual synthesis of sensing elements.7, 8, 9 The
arrays presented herein are conceptually similar except that the sensing elements are not
soluble and the sensing elements are based on direct interaction between the analyte and
polymer-bound luminescent europium complex.
Sensor arrays have been shown as an effective strategy for differentiating similar
analytes.10, 11, 12 Sensor arrays require a library of response data collected from the analytes
against a number of individual sensing elements. Unknown analytes can then be compared
against this library of patterns and classified. The intrinsic cross-reactivity of these sensors
increases the dimensionality of variance in the response patterns. However, designing
individual sensing elements with unique selectivity can be synthetically costly to establish.
Using non-specific receptors such as polymers or polymer blends can reduce this difficulty,
tunable single polymer capable of incorporating selectivity based on molecular imprinting
or anion displacement.
The complexity of the response data collected from sensor arrays can be difficult
to interpret without multivariate analysis. For this luminescent polymer system, the
dimensional reduction technique linear discriminant analysis (LDA) was used.
1.3MIPSENSOR ARRAY
Molecular imprinting was introduced applied to Borovik’s design to attain
polymers with different selectivities. Molecularly imprinted polymers (MIPs) are typically
synthesized based on the interactions between template molecules and functional monomer
in a pre-polymerized solution. The interactions in the pre-polymer solution are retained
after polymerization, and washing out the template results in selective binding sites. This
process allows for the rapid preparation of polymers with selective binding. One of the
major downsides in MIP synthesis is the lack of binding site homogeneity which is caused
by the low fidelity. The lack of uniform binding sites allows for a significant level of
cross-reactivity that can negatively influence the MIP as a highly selective single sensor. Using
several sensors as an array mitigates this problem by comparing the response patterns of
analytes across the array. Sensor arrays are capable of functioning based on the interaction
between different sensors and analytes regardless of the specific selectivity. Coupling this
with MIPs that have a specific selectivity enables a far more useful array with minimal
effort, and this approach has been used with success in the past.13 The typical quantification
of binding to MIPs is indirect relying on UV absorption of the unbound analyte. The system
discussed herein is superior to previous systems because the response patterns are
Experiments previously performed by Xu and Song were reproduced and analyzed.
Previous results indicated that residual template molecules remain attached to the binding
sites even after soxhlet washing. All MIPs and NIP were washed 3 times in a 3mM
acetonitrile solution of tetrabutylammonium (TBA) nitrate. To ensure that the synthesis of
new polymer yielded similar results to previous tests, a comparison between newly
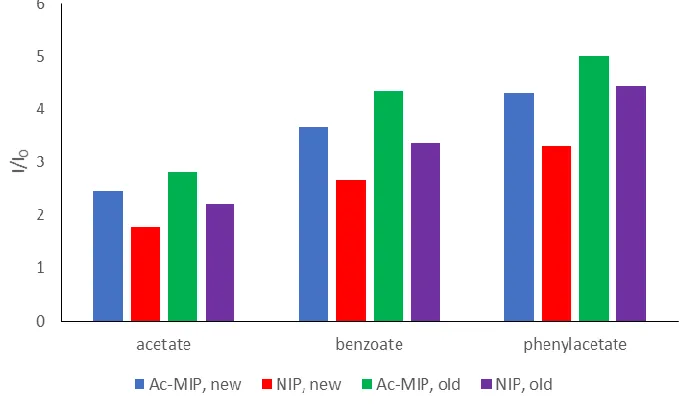
synthesized and standard sample was measured as seen in Figure 1.1.
Figure 1.1. Comparison of old NIP (green) and Ac-MIP (purple) synthesized by Yang Xu and newly synthesized NIP (red) and AC-MIP (blue) against acetate, benzoate, and phenylacetate analytes. All samples underwent the nitrate washing technique prior to measuring the intensity. An excitation wavelength of 350 nm was used to obtain the emission at 616 nm for 0.01 g of polymer in 0.3 mL of acetonitrile.
Polymer was suspended in a 5:1 chloroform:acetonitrile solution and sonicated.
Aliquots of 0.4 mL (0.01 g of polymer) were deposited into a quartz microtiter plate. After
drying for several hours, 0.3 mL of acetonitrile were added to each sample and after 15
min, the luminescence was measured at an excitation of 350 nm.
To compare the luminescent intensities of the various MIPs, I/I0 was used with I as
of the polymer in blank acetonitrile. While the older samples of NIP and Ac-MIP from
Song and Xu produced consistently higher emission intensity than their newly synthesized
counterparts, the general trend between the NIP and Ac-MIP’s difference in intensity was
preserved. This suggests that while the total emission intensity of polymers experiences
batch to batch variations, the correlation between the different sensing elements remains
constant. Because of this trend, large scale precursor synthesis was used so that the same
batch of Eu-salen ligand was used for the NIP and three MIPs. A new batch of NIP and
MIPs were synthesized using acetate, benzoate (Bz-MIP) and phenylacetate (Ph-MIP)
templates.
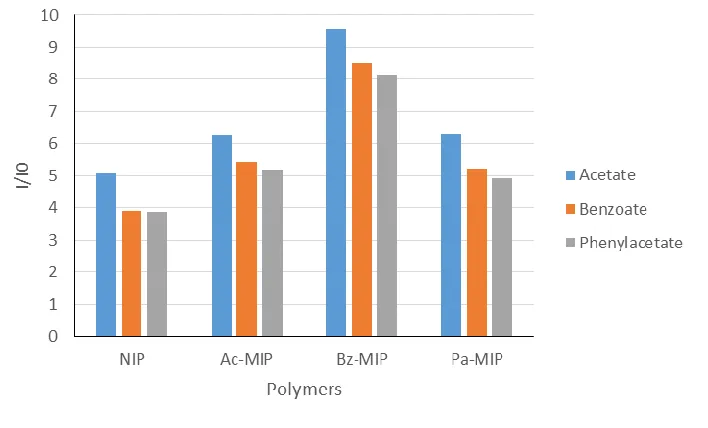
Figure 1.2. Average of five luminescent responses of NIP and three MIPs at 616 nm with the addition of 0.3 mL of 3 mM analytes TBA acetate, benzoate, and phenylacetate in acetonitrile. The polymers were excited at 350 nm.
However, while there is a clear difference between the total intensities, the trends
between the analytes remain consistent. This would, for instance, make it difficult to
spectra were taken of the emission profiles of the Eu-polymers in the presence of the
analytes as well as several other anions seen in Figure 1.3.
Figure 1.3. Average emission of NIP (a), Ac-MIP (b), Bz-MIP (c), Pa-MIP (d) over five measurements with the addition of 0.3 mL of 3 mM TBA acetate (blue), benzoate (green), and phenylacetate (orange) at when excited at 350 nm.
With the exception of the 610-640 nm range in Figure b for phenylacetate, the order
and patterns of the analytes all remain consistent. However, often a great deal of variance
is not discernable simply from visually comparing two spectra, so multivariable analysis
was used to reduce the dimensionality of the data set and isolate any unique features of
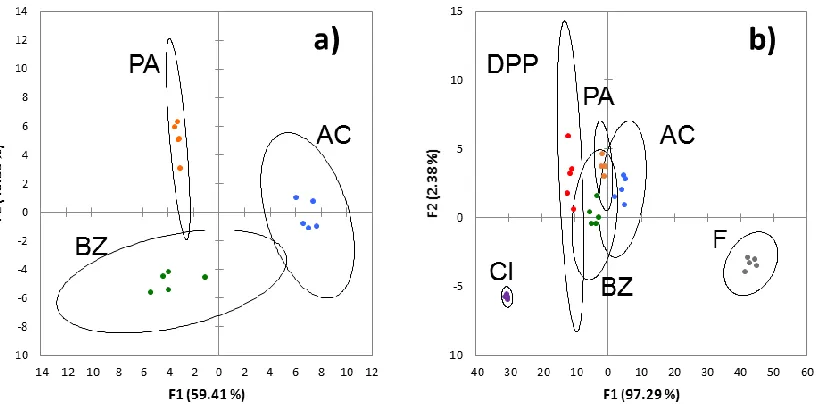
Figure 1.4. LDA analysis of sensor array with TBA-acetate (AC, Blue), benzoate (BZ, green), and phenylacetate (PA, orange) (a), and the analysis with the three template molecules and diphenyl phosphate (DPP, red), chloride (Cl, purple), and fluoride (F, gray) (b). The cross-validation of the analysis was 100% (a) and 97% (b).
While this process showed potential as an array, the molecular imprinting process
did not appear to create significant affinity for the template molecule. Also, the inclusion
of other analytes actually reduced the ability of the array to distinguish the carboxylates.
While the lack of imprinting did not significantly impact the success of using this as an
array, it does suggest that the imprinting process for this polymer system is unnecessary.
The primary function of molecular imprinting was to create unique specificity for each
sensing element.
The reason for the failure in imprinting is because the three templates only have a
single functional group capable of creating specific recognition, the carboxylic acid. The
direct binding site of the europium is the only site in the polymer matrix capable of
interaction sites on the analytes, contribution to creating specificity in the polymer matrix
are nonexistent. Also, the design strongly followed Borovik’s including the use of EGDMA
as the crosslinking agent with no functional monomer such as methacrylic acid or
methacrylamide. This system lacked both unique recognition sites on the template
molecules and the functional monomer necessary to create effective imprinted polymers.
Thus, initial attempts to create molecularly imprinted polymers (MIPs) were
unsuccessful. The most logical explanation is that the carboxylates chosen (acetate,
benzoate, phenylacetate) were simply too similar with the only unique non-covalent
binding site (C=O) in the same area. Therefore, the only imprinting factor is size
dependence which plays a minor role with these similar sized analytes. As expected, acetate
consistently showed a larger emission than benzoate and phenylacetate because of its
smaller size and ability to access more binding sites. Further work with this system was
not attempted because a size-exclusive sensor showed limited potential.
1.4ANION DISPLACEMENT POLYMER SENSOR ARRAY
Analysis of the previous results showed that the intensity of the emissions and
emission profile was highly dependent on whether the polymer was washed in a TBA
nitrate solution or not. The template molecules were not completely removed during the
soxhlet extraction of the imprinted polymers and this residual template was the cause of
varied emissions in the imprinting studies. This was demonstrated by washing the polymers
with TBA nitrate and observing that the “imprinted” polymers lost their unique emission
profiles and coalesced into very similar signals. While this was problematic for the
imprinting approach, it did suggest an alternate strategy to prepare polymers with different
elements as seen in Scheme 1.2. This process was consistent with previously reported
europium (III) host-guest displacement sensors. 14, 15, 16
Scheme 1.2. Representative scheme of the anion displacement array. The grey circles represent the europium binding site, the red shapes represent the anion host ligands, and the blue, green, and purple shapes represent analytes.
The host anions and carboxylate analytes are listed in Table 1.1 Host anions were
chosen based on their diversity in size, shape, and basicity to maximize the signal variance.
The carboxylate anions were chosen because of certain structural similarities. Analytes
A1-A4 were chosen to test structurally similar molecules. They are also important food
additives and preservatives. Analytes A5-A9 were added to test the size discrimination of
the array. Specifically, analyte A6 was chosen due to the size and shape similarity with A2.
Table 1.1. Carboxylate analytes and host anions.
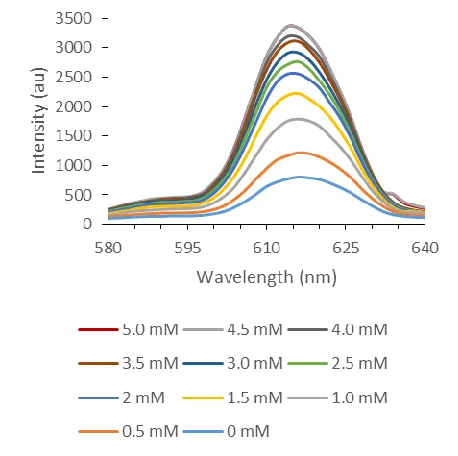
The initial tests were performed to characterize the increase in luminescent
emission with increasing concentrations of A1 as seen in Figure 1.5. The primary peak
observed was the 618 nm 5D0 to 7F2 transition when the system was excited at 350 nm. The
turn on luminescence of similar systems has been attributed to minor strains between the
europium center and salen complex caused by different ligands binding at the open
europium sites. A likely explanation is that the host anion (nitrate) is quenching or limiting
the transfer of energy between the salen ligand and europium center when excited.
Replacement of this ligand with A1 allows for greater transfer of energy and therefore an
Figure 1.5. Change in fluorescent intensity of P1 with the addition of increasing concentrations of A1 when excited at 350 nm.
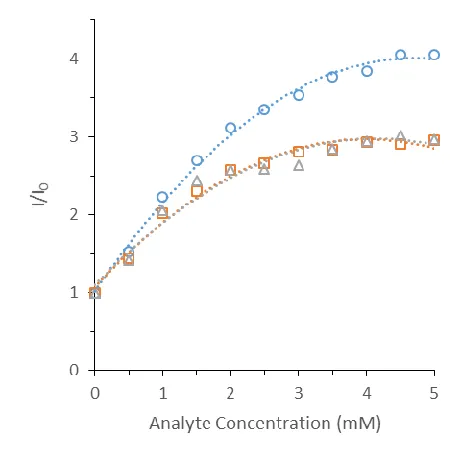
Further experimentation concluded that the optimal analyte concentration for
further studies was 3 mM. The P1 polymer was titrated with A1, A2, and A3 of varying
concentrations as seen in Figure 1.6. At this concentration, the response profile of the
analytes showed a higher level of variation. This is also the lowest concentration at which
Figure 1.6. Titration curve of P1 luminescent response at 618 nm with the addition of varying concentrations of A1 (circles, blue), A2 (square, orange), A3 (triangle, gray) in acetonitrile (0.3 mL). P1 (0.01 g) was excited at 350 nm.
As was seen with the MIP array, A1 caused a larger increase in emission than A2
and A3 at the same concentration. The likely explanation for this is that the smaller A1 can
access europium binding sites within the polymer that A2 and A3 are too large or sterically
hindered to access. Further studies employed larger molecules to observe this trend.
The same process used to measure the MIP response was used to measure the
Figure 1.7. Emission spectra of the I/I0 response of P1-P5 with the addition of A1-A9
excited at 350 nm.
In addition to differences in I/I0, the shapes of the emission spectra for P1-P3
retain similar characteristics. However, a significantly higher emission response was seen
in P4 and P5 which showed a peak intensity more than double that of P4. Also of interest
is the change in the order of the analytes in P5, namely that A1 no longer shows the
greatest enhancement in emission. However, identification of key points of variation
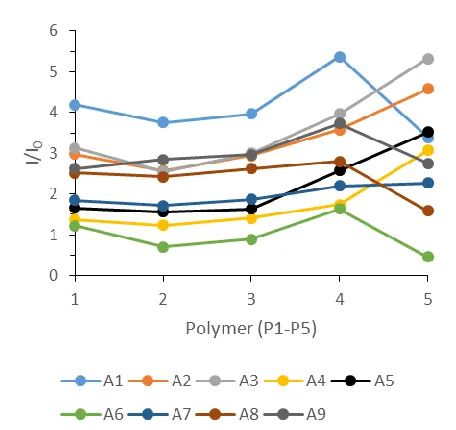
Figure 1.8. Luminescent response of the polymer array (P1-P5) against analytes (A1-A9) at 618 nm when excited at 350 nm. Each point is an average of 5 measurements, each measurement involved 0.01 g of dried polymer with the addition of 0.3 mL of 3 mM TBA-analyte solution in acetonitrile.
Despite minor shifts in intensity between P1-P3, most of the analytes appear to have
a similar response along these sensor elements. Sensing element P4 sees several large
spikes such as A1 and A5 while other analytes show a more minor increase like A7 and
A8. Though subtle, differences like these can significantly increase the ability to
distinguish analytes. However, the most interesting sensor, P5, shows a significant increase
for some analytes and a significant decrease for others. Also, this is the only sensor where
A1 does not have the strongest emission intensity. To characterize the visual differences
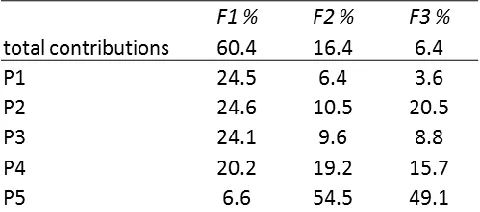
seen in this figure, principle component analysis (PCA) was used. A software package of
XL STAT 2016 was used to quantitatively assess the similarities and differences in the
Table 1.2. PCA contributions showing the variability of the individual sensor elements over all analytes and the entire spectrum (550-670 nm, all even wavelengths) when excited at 350 nm.
The total contributions to the variance were equally spread between P1, P2, and P3
in the primary component (F1) with P4 and P5 contributing the least. However, P4 and P5
contribute the most to the secondary component.
The range between 578-588 nm was responsible for 13% of the total variance in
the F1 component, and each wavelength (only even wavelengths) in that section had almost
identical contributions (2.14-2.18%) over the 6 data points. Similar groupings were
observed throughout F1, F2, and F3. To incorporate data from the entire spectrum, points
were chosen in increments of 16 nm. The LDA plot is built from 584 nm, 600 nm, 616 nm,
Figure 1.9. Two-dimensional LDA plots of the three most prominent linear discriminants. Centroids represent a confidence interval of 95%.
Analysis of the distances between the points for each pattern in the LDA plots did
not show size and shape discrimination of the carboxylate of the analytes as a significant
factor. For example, F1 did a poor job distinguishing A8 and A9, the two largest analytes,
from A2 and A3. Also, A4 and A5 were distinctly separated from A2 and A3 despite having
similar shapes. A more important parameter appears to be the relative bascisity of the
carboxylates. For example, A1 and A6 have both similar sizes and shapes but vastly
different pKb’s and were at opposite ends of the F1 scale. However, attempts to plot the
pattern. This suggests that the separation seen in this array is complex and based on several
properties directly related to the individual analytes. The ability to discern these analytes
based on their unique identities suggests that other analytes introduced into the system will
also have a unique “fingerprint.”
To assess the classification accuracy of our luminescent polymer array, a jack-knife
or “leave one out” cross validation was employed to describe the response quantitatively.
This analysis treats a sample set of data like an unknown and performs the LDA analysis
without this data set. After building the new library, the omitted data set is reintroduced
and classified. This process is repeated for each sample pattern. Using this method resulted
in 100% classification accuracy for this sensor array. This result demonstrates that the
ligand exchange method of producing sensing elements can produce selective sensing
elements. This is significant because of the simple method of preparation of the individual
polymer elements of the array.
After the first use, the emission intensity significantly decreased, but remained
more consistent with subsequent uses suggesting that the array may be reusable. One
concern with the initial drop off in emission is that the primary component (F1) is directly
related to the luminescent intensity as seen in Figure 1.11. Therefore, the primary
contributor to the variance was significantly altered through multiple uses. However, the
effect that this has on the system as a whole will likely be negligible. It has already been
shown that P4 and P5 contribute the most significantly towards the second and third
component which use less visually obvious patterns in the response to differentiate the
analytes. These components are essential in separating certain analytes, and while a
reduction in signal intensity will alter the fidelity in the F1 component, the distinct
fingerprints should remain consistent.
Figure 1.11 Correlation between F1 component and the change in intensity at 616 nm with an excitation at 350 nm.
An investigation into P4 and P5 was performed to determine why they contributed
to F2 and F3 more significantly than P1-P3. Initial analysis of the data showed that both
P4 and to a greater extend P5 had reduced I0 emission along the entire spectrum (580-650
0 0.5 1 1.5 2 2.5 3 3.5 4 4.5
-30 -20 -10 0 10 20 30
nm) than P1-P3. The turn on fluorescence of the polymer in the presence of carboxylate
analytes has already been explained, and it is possible that both the diphenyl phosphate and
p-toluene sulfonate anions negatively impact the transfer of energy between the salen
ligand and europium center. Another theory is that there is a transfer of energy into
diphenyl phosphate and p-toluene sulfonate that is lost through the resonance of the anion.
The resonance quenching effect is a well-known phenomena, but regardless of the cause
the lowered I0 allows for an increased I/I0 response for the system with the introduction of
analytes and an extra level of variance during the competition of host and guest anions. To
demonstrate the increased potential for variance, standard nitrate washed, hydrogen
sulfonate washed, methane sulfonate washed, and p-toluene sulfonate washed polymer
were compared in Figure 1.12.
Figure 1.12. Luminescent intensity of polymer washed in various sulfonates. Standard nitrate washed (blue), hydrogen sulfonate (grey), methane sulfonate (yellow), p-toluene sulfonate (orange).
addition, p-toluene sulfonate and methane sulfonate polymers both showed distinct
emissions as well. The use of sulfonates as host anions in this array would be ideal for
organophosphate sensing applications. Because phosphates and sulfonates have similar
pKa’s, their competition for the binding site should vary for any small conformational
difference in hosts or analytes. Furthermore, using this method will incorporate resonance
quenching affects as that are unique to the molecules.
In short, the effective use of a europium based luminescent polymer array based on
anion ligand displacement has been demonstrated. The need to only synthesize a single
batch of polymer tremendously simplifies the process of designing individual sensing
elements. The washing technique to prepare the sensing elements is universal for TBA salts
yielding a vast array of potential sensors. Specifically, it was determined that sulfonates
acting as hosts affect the response signal in ways that the host anions of P1-P3 did not. An
array consisting of sulfonates would likely provide even greater potential for the separation
of analytes.
1.5EXPERIMENTAL
1.5.1 2-Hydroxy-4-(4-Vinylbenzyloxy)Benzaldehyde Synthesis
To 30 mL of methanol, 2,4-dihydroxylbenzaldehyde (10.4 g, 75 mmol) and
potassium hydroxide (4.2 g, 75 mmol) were added and stirred for 30 minutes. Solvent was
evaporated and residue was suspended in 50 mL of acetonitrile. A solution of vinylbenzyl
chloride (9.16 g, 60 mmol) in acetonitrile was added. Potassium iodide (4.15 g, 25 mmol)
was added and the mixture was heated at 50 °C for 10 hours. The reaction solution was
filtered and the solution was collected. After evaporation of the solvent, 50 mL of water
and 100 mL of ethyl acetate were added. The organic layer was collected and was washed
with 3% potassium carbonate, water, and 5% citric acid each 3x. The solvent was removed
in vacuo and the residue was recrystallized in ethyl acetate. The pure product is white
rod-like crystal (38% yield). 1H NMR (300 MHz, CDCl3) δ: 9.72 (s, 1H), 7.40 (m, 5 H), 6.73
(dd, J = 17.7 Hz, J = 10.8 Hz, 1H), 6.61 (dd, J = 8.7 Hz, J = 1.8 Hz, 1 H), 6.51 (m,1 H),
5.78 (d, J = 17.7 Hz, 1H), 5.28 (d, J = 10.8 Hz, 1H), 5.10 (s, 2 H).
1.5.2 Synthesis of Salen Ligand
Scheme 1.4. Synthesis of Salen.
The benzaldehyde (2.8 g, 11 mmol) was suspended in 50 mL of dry methanol and
sonicated. The solution was put under nitrogen flow at 0 °C. Ethylenediamine (0.3 g, 5
mmol) was added dropwise in 3 parts over 30 min. The reaction mixture was taken off ice
was collected and dried (71% yield). 1H NMR (300 MHz, CDCl3) δ: 8.19 (s, 2H), 7.39 (m,
8H), 7.08 (m, J = 8.4 Hz, 2H), 6.71 (dd, J = 17.7 Hz, J = 10.8 Hz, 2 H), 6.45 (m, 4 H), 5.75
(d, J = 17.7 Hz, 2H), 5.25 (d, J = 10.8 Hz, 2H), 5.03 (s, 4 H), 3.85 (s, 4H).
1.5.3 Synthesis of Eu-salen Complex
Into 50 ml methanol, Salen (3.2 g. 6 mmol) and KOH (0.5g, 9 mmol) were added
and stirred. A solution of europium nitrate hexahydrate (1.78 g, 4 mmol) in MeOH was
added and stirred for 12 h at 40 °C. The precipitate was filtered and washed with methanol.
(76% yield) yellow solid. UV-vis UV/Vis (DMF, λmax, nm): 350 nm. Fluorescent
emission (DMF, λmax, nm): 614.
1.5.4 Polymerization of Eu-Salen Complex
Eu2(salen)3(H2O)2 (0.05 g) and EDGMA (0.95 mL, 5 mmol) was dissolved in 7
mL dichloroethane then heated at 80 °C. At this stage, templates for individual MIPs
(TBA-acetate, benzoate, and phenylacetate) were added (0.312 mmol) or none were added for
NIP. After complete dissolution of the materials, AIBN (0.016 g, 0.1 mmol) was added and
the mixture was heated at 80 °C for 8 h. The resulting polymer was ground and sieved
through a 150 micron sieve. Polymer was then washed with methanol for 12 h in a Soxhlet
extractor, and then with a 1:4 methanol/acetonitrile mixture for another 12 h. Polymer was
dried in vacuo to constant weight.
1.5.5 Tetrabutylammonium Carboxylates
To 50 mL methanol, carboxylic acid (4 mmol) and tetrabutylammonium hydroxide
30-hydrate (3.2 g, 4 mmol) were added and stirred for 6 hours. The solvent and water was
toluene. A gray solid was collected. A gray solid was obtained with a 94% yield and
verified with 1H NMR.
1.5.6 Luminescent Studies
The desired polymer (0.16 g) was suspended in a 5:1 chloroform:acetonitrile
solution (5.36/1.06 mL) using a sonicator, and 0.4 mL of solution (0.01 g) of polymer was
deposited into a microtiter plate. The solvent was evaporated over the course of several
hours and warmed on top of an oven. After cooling to room temperature, 0.3 mL of 3 mM
analyte solution was added to the wells. After 15 minutes, fluorescence was measured over
a range of 550-670 nm with an excitation at 350 nm.
1.6 REFERENCES
1. Duke, R.M.; Veale, E.B.; Pfeffer, F.M.; Kruger, P.E.; Gunnlaugsson, T. Chem. Soc. Rev.2007, 129, 9856-9857.
2. Sakai, R. Nature Polymer Journal. 2016, 48, 59-65.
3. Haas, Y.; Stein, G.; J. Phys. Chem. 1971, 76, 3667-3677.
4. Mitchell-Koch, J.T.; Borovik, A.S. Chem. Mater.2003, 15, 3490-3495.
5. Peczuh, M.W.; Hamilton, A.D. Chem. Rev. 2000, 100, 2479-2494.
6. Kovala-Demertzi, D. J. Organom. Chem. 2006, 691, 1767-1774.
7. Akdeniz, A.; Mosca, L.; Minami, T.; Anzenbacher, P. Chem. Commun.2015, 51, 5770-5773.
8. Davey, E.A.; Zucchero, A.J.; Trapp, O.; Bunz, U.H.F. J. Am. Chem. Soc. 2011,
133, 7716-7718.
9. Han, J.; Bender, M.; Hahn, S.;Seehafer, K.; Bunz, U.H.F. Chem. Eur. J.2016, 22, 3230.
10. Anzenbacher, P., Jr.; Lubal, P.; Bucek, P.; Palacious, M.A.; Kozelkova, M.E.
Chem. Soc. Rev.2010, 39, 3936-3953.
12. Askim, J.R.; Mahmoudi, M.; Suslick, K.S. Chem. Soc. Rev.2012, 42, 8649.
13. Green, N.T.; Shimizu, K.D. J. Am. Chem. Soc.2005, 127, 5695-5700.
14. Carr, R.; Bari, L.D.; Piano, S.L.; Parker, D.; Peacock, R.D.; and Sanderson, J.M.
Dalton Trans.2012, 41, 13154-13158.
15. Hammell, J.; Buttarazzi, L.; Huang, C.H.; Morrow, J.R. Inorg. Chem. 2011, 50, 4857-4867.
CHAPTER
2
S
OLVENTP
ROGRAMMABLEP
OLYMER2.1ABSTRACT
A solvent programmable polymer (SPP) based on the hindered bond rotation of
carboxylic acid monomers was studied to determine the molecular memory mechanism
and to create a greater variety of SPPs through free radical polymerization. The SPP was
prepared by ring-opening metathesis polymerization (ROMP) which incorporated the
atropisomeric functional monomer into a rigid crosslinked network. The orientation of the
carboxylic acid groups was achieved by heating and then cooling in various solvents. These
solvent-induced changes altered the recognition properties of the SPP and were retained at
room temperature. The recognition properties were repeatedly erased and reprogrammed
by heating in different solvents. The orientation of the carboxylate monomers was
measured using ethyl adenine-9-acetate (EA9A), and the binding of EA9A increased with
polar solvents and decreased with non-polar solvents. A new theory suggesting that
dimerization between carboxylic acids is responsible for the decreased binding of EA9A is
discussed. Also, attempts to create a monomer capable of free radical polymerization are
2.2INTRODUCTION
Materials with switchable properties have received much attention in recent years.
A variety of stimulants can be used to force a transition from one molecular state to another,
but retention of the second state typically relies on continued stimulation. A solvent
programmable polymer capable of retaining programmed states is discussed herein.1,2,3
The primary mechanism of the SPP relies on a hindered bond rotation that is
kinetically restrained at room temperature. At higher temperatures, the SPPs are sterically
unrestrained and can switch their recognition properties in response to interactions with
solvent molecules. On cooling, the solvent-induced orientation of the monomers is retained
through the reestablishment of restricted-rotation. Not only does the polymer display
solvent memory, but it also provides a unique fingerprint based on the polarity of the
solvent. Strong hydrogen bonding solvents such as water, methanol, and isopropanol
increase the percentage of solvent accessible carboxylic groups and the binding capacity
of the polymer. Conversely, less polar solvents such as cyclohexane, dioxane, and
acetonitrile decreases the percentage of solvent accessible carboxylic acid groups and
decreases the binding capacity of the polymer.
The initial hypothesis for the switching mechanism of the SPPs is shown in Scheme
1. The atropisomeric functional monomer with a carboxylic acid recognition group is
shown against the polymer matrix. The carboxylic acid recognition group (red sphere) was
positioned ortho to the Caryl-Nimide bond so that its relative orientation and solvent
Scheme 2.1. Representative scheme of the initial theory of the SPP’s rotational mechanism when heated and cooled in polar and non-polar solvents.
2.3“TURN-OFF”DIMERIZATION
The initial mechanistic hypothesis was based on the assumption that the polymer
matrix was rigid enough to shield the solvent accessibility of the carboxylic acid
monomers. It was believed that this highly crosslinked morphology would result from the
ROMP polymerization of the monomer and crosslinker seen in Scheme 2.2.
Scheme 2.2. Preparation of the SPP with the functional monomer (1) and the crosslinker (2).
However, previous experimental results collected by Zhang and He do not show
consistent results with this theory. The characterization of the ROMP SPP was more
consistent with a gel morphology. This conclusion was based on the following
observations. First, results from Yinyan’s experiments show a higher level of polymer
swelling percentages than expected for rigid polymers. Dried polymer particles were
observed for acetonitrile, cyclohexane, and water respectively. Second, an acid-base
titration performed on the SPP by Yagang showed that the accessibility of the carboxylates
did not change based on which solvent the SPP was heated and cooled in. The theoretical
number of carboxylic acids in the SPP (0.578 mmol/g) was based on the ratios of monomer
1 and crosslinker 2 used in the ROMP. Approximately 57% of these sites were susceptible
to deprotonated. SPP heated and cooled in cyclohexane and SPP heated and cooled in water
were both found to vary less than 1%.
The combination of swelling properties and accessible sites suggests that the SPP
contained well solvated polymer chains that retain accessible functional sites regardless of
the rotamer. The polymer system is therefore more consistent with a gel morphology than
the highly crosslinked system initially described. In order to incorporate these two studies
with the results seen in the EA9A binding studies, a new mechanism was proposed. The
recognition properties of the carboxylic acid sites are dictated by the formation of dimers
as seen in Scheme 2.3.
Scheme 2.3. Representation of the new theory suggesting that the “off” state of the SPP is caused by the dimerization of carboxylic acid moieties.
When heated in a polar solvent, the solvated carboxylic acids rotate to maximize
their interactions with the solvent molecules. After cooling, the carboxylic acids become
the carboxylic acids rotate to avoid the non-polar solvent by forming strong hydrogen
bonded dimers. This dimerized conformation reduces the accessibility of the carboxylic
acids. Strong bases such as the NaOH used in the titration experiment are capable of
disrupting the dimer and deprotonating the acids, but weakly basic guests such as EA9A
do not disrupt the dimer. This allows for the decreased binding percentages of EA9A after
heating in non-polar solvent while also explaining the similar quantity of accessible sites
for NaOH.
2.4FREE RADICAL SYNTHESIS
The process of ROMP reactions relies heavily on ring strain to create a polymer
network. This constraint limits the ability to study a variety of functional monomers that
might result in SPPs. Free radical polymerization can occur with acrylate, acrylamide, and
styrene groups which can be easily attached to existing structures. The goal of this project
was to incorporate functional groups onto the monomer that would participate in free
radical polymerization.
The primary strategy for this synthesis was to open the sp2 bond in the norbornene
section of the molecule and attach acrylate, acrylamide, or vinyl functional groups that
could participate in free radical polymerization. The functional monomer used in the
ROMP polymerization exists as a single rotomer and this constraint is due to the steric
hindrance caused by the sp2 bond. Initial trials protected the carboxylic acid recognition
group as a methyl ester, but the deprotection was found to react with the imide portion of
the molecule. Instead, a tert-butyl ester group was used. Sulfuric acid and MgSO4 were
mixed prior to the addition of the monomer and t-butanol, and the reaction was driven with
norbornene sp2 bond into two carboxylic acids. The biphasic solution was vigorously
stirred several hours and a dicarboxylic acid was obtained after filtration and base to acid
extraction. The acrylamide was attached using EDCHCl in dry DCM. And finally, the
deprotection of the original carboxylic acid was performed with H3PO4 in acetonitrile seen
in Scheme 2.4.
Scheme 2.4. Synthesis route for the incorporation of acrylate groups onto the functional monomer.
Identification of the dicarboxylic acid proved to be challenging based on the NMR.
All peaks were identified and characterized except for the acid peak expected to appear
above 10 ppm. TLC and bromocrescol green stain supported the inclusion of an acid group
amount of purified material to verify the presence of 2 carboxylic acid groups. Integration
of the methyl ester peak in 1HNMR showed the incorporation of two methyl esters into the
molecule demonstrating the presence of the acid groups in the previous molecule.
The cause of the low deprotection reaction yield was not identified, but it is possible
that the acid used catalyzed a polymerization reaction. Subsequent attempts to perform this
synthesis demonstrated that the t-butyl protection reaction was unreliable. In addition, use
of an acrylamide instead of an acrylate was based on the notion that the deprotection of a
ester protecting group could cleave an acrylate group. To resolve these problems a new
synthesis is proposed.
Scheme 2.5. Proposed synthetic route to incorporate acrylate functional groups onto a potential monomer for a SPP polymer.
reactions which is why this conformation has been used so far in the design of the SPP.
However, Diels Alder reactions that include furans have been shown to yield the more
thermodynamically stable exo product in place of the more kinetically stable endo product.
The presented procedure should resolve the steric hindrance cause by the endo norborene
monomer used previously and does not rely on the protection of the carboxylic acid
recognition site.
2.5EXPERMIENTAL
2.5.1 2-Amino-3-Methylbenzoic Acid Synthesis
Scheme 2.6. 2-amino-3-methylbenzoic acid synthesis.
3-methyl-2-nitrobenzoic acid (5 g, 28 mmol) was hydrogenated overnight with
10% by weight palladium on carbon in ethanol. Solution was filtered and dried under
vacuum to produce a reddish-brown powder for a 92% yield. 1H NMR (Acetone-d6, 300
MHz) δ ppm: 8.00 (s, 1H) 7.73 (d, J = 7.73 Hz, 1H), 7.17 (d, J = 7.17 Hz, 1H), 6.49 (J =
6.49, 1H), 2.16 (s, 3H).
Scheme 2.7. Synthesis for functional ROMP monomer.
2-amino-3-methylbenzoic acid (1.25 g, 8 mmol) and
cis-5-norbornene-endo-2,3-dicarboxylic anhydride (1.5 g, 9 mmol) were combined and dissolved in THF. The solvent
was removed by vacuum, and the remaining solid was put under vacuum and heated
overnight at 110 °C for a 94% yield. Product was a brown solid. 1H NMR (Acetone-d6,
300 MHz) δ ppm: 7.95 (d, J= 7.8 Hz, 1H), 7.57 (d, J = 7.8 Hz, 1H), 7.44 (dd, J = 7.5 Hz,
1H), 6.32 (dd, J = 2.1Hz, J = 1.8Hz, 2H), 3.50-3.52 (m, 2H), 3.37-3.39 (m, 2H), 2.12 (s,
3H), 1.73 (dd, J = 1.5 Hz, 2H).
2.5.3 Crosslinker Synthesis
Scheme 2.8. Synthesis for ROMP crosslinker.
Norbornene-endo-dicarboxylic anhydride (0.743 g, 4 mmol) and ethylene diamine
(0.14 mL, 0.002 mol) were dissolved in DMF and refluxed at 110 °C for 24 hours. Addition
of ice-cold water to the mixture crashed out a precipitate which was filtered and washed
with water. White solid was dried in vacuo, 73% yield. 1H NMR (CDCl3 300 MHz) δ ppm:
6.03 (dd, J = 2.1 Hz, J = 1.8 Hz, 4H), 3.45 (s, 4H), 3.32 (m, 4H), 3.22 (m, 4H), 1.71 (d, J
= 8.7 Hz, 2H), 1.51 (d, J = 8.6 Hz, 2H).
2.5.4 ROMP Polymerization
80/20 mole % mixture of crosslinker (0.75 g, 2.2 mmol) to functional monomer
Hoveyda-Grubbs Gen. 2 catalyst (0.016 g, 26 µmol) was added and the mixture was shaken for 20
min. Reaction proceeded at room temp for 10 hours, and was heated at 60 °C for 4 hours.
The polymer was dried, ground, and washed in a soxhlet extractor for 24 hours with
methanol and then for another 24 hours with 4:1 methanol/acetonitrile.
2.5.5 T-Butyl Protecting Group Incorporation
Scheme 2.9. Synthesis of t-butyl protected monomer.
In 40 mL of DCM, MgSO4 (4.81 g, 40 mmol) was combined with H2SO4 (0.55 mL,
10 mmol) and stirred vigorously for 15 min. The carboxylic acid (2.97 g, 10 mmol) and
t-BuOH (4.78 mL, 50 mmol) were added, and the reaction was stirred overnight. A solution
of 70 mL saturated sodium bicarbonate solution was added and stirred until MgSO4 was
consumed. Organic phase was washed with brine, dried with MgSO4, and recrystallized in
MeOH to abotain a white/brown crystals at 35% yield. 1H NMR (Acetone-d6, 300 MHz) δ
ppm: 7.95 (d, J= 7.8 Hz, 1H), 7.57 (d, J = 7.8 Hz, 1H), 7.44 (dd, J = 7.5 Hz, 1H), 6.32 (dd,
J = 2.1Hz, J = 1.8 Hz, 2H), 3.50-3.52 (m, 2H), 3.37-3.39 (m, 2H), 2.12 (s, 3H), 1.73 (dd, J
2.5.6 Oxidation of the Norbornene C=C
Scheme 2.10. Oxidation of norbornene C=C bond.
T-butyl protected imide (0.179 g, 0.5 mmol) was combined with 2 mL of ethyl
acetate and 2 mL of acetonitrile at 0 °C. RuCl3 (0.0023 g, 10 µmol) was added and stirred
for 10 min while 3 ml of water was combined with NaIO4 (0.432 g, 2 mmol). The aqueous
solution was added to the solvent solution dropwise. Biphasic solution was taken off ice
and stirred vigorously for 6 hrs. Solution was filtered and combined with 0.25 M aqueous
NaOH solution. The aqueous solution was extracted and acidified to a pH 1 with HCl.
Ethyl acetate was mixed with solution and solvent phase was extracted. Solvent was
removed in vacuo and dicarboxylic acid was obtained as a white powder at an 83% yield.
1H NMR (MeOH-d4, 300 MHz) δ ppm: 7.89 (d, J = 7.81 Hz, 2H), 7.53 (d, J = 7.54 Hz,
1H), 7.40 (t, J = 7.41 Hz, 2H), 3.75 (dd, J= 3.73 Hz, 2H), 3.23 (m Hz, 2H), 2.33 (dd, J =
2.5.7 Amide Coupling
Scheme 2.11. Acrylamide coupling reaction.
N-(3-aminopropyl) methacrylamide HCl (0.05 g, 0.28mmol) was suspended in dry
CH2Cl2 and cooled to 0 °C. Triethylamine (40 µL, 0.28mmol) was combined with dry
CH2Cl2 and added dropwise to solution. Dicarboxylic acid (0.05 g, 0.12mmol) and
EDCHCl (0.1 g, 0.52 mmol) were added and the solution was removed from ice and stirred
for 12 h. Solvent layer was washed with water 3x and dried in vacuo. Resulting product
was a white powder with 89% yield. 1H NMR (MeOH-d4, 300 MHz) δ ppm: 8.16 (t, J=
8.16 Hz, 2H), 7.89 (t, J = 7.88 Hz, 2H), 7.78 (d, J = 7.81 Hz, 1H), 7.54 (d, J = 7.54 Hz,
2H), 7.39 (t, J = 7.48 Hz, 2H), 5.67, 5.30 (d, J = 5.30 Hz, 4H), 3.64 (dd, J= 3.64 Hz, 2H),
3.36 (m, 4H), 3.20 (m, 2H), 3.12 (m, 4H), 2.55 (dd, J= 2.60 Hz, 1H), 2.40 (s, 3), 1.99 (m,
2.5.8 T-Butyl Deprotection
Scheme 2.12. Deprotection of meth acrylamide functional monomer.
T-butyl protected monomer (0.1 g, 0.15 mmol) was dissolved in 2 mL of CH2CL2
and 1 mL of trifluoroacetic acid was added dropwise. Solution was stirred for 3 h and water
was added. Solvent layer was removed and dried in vacuo. Yield of 6% 1H NMR
(MeOH-d4, 300 MHz) δ ppm: 8.16 (t, J= 8.16 Hz, 2H), 7.89 (t, J = 7.88 Hz, 2H), 7.78 (d, J = 7.81
Hz, 1H), 7.54 (d, J = 7.54 Hz, 2H), 7.39 (t, J = 7.48 Hz, 2H), 5.67, 5.30 (d, J = 5.30 Hz,
4H), 3.64 (dd, J= 3.64 Hz, 2H), 3.36 (m, 4H), 3.20 (m, 2H), 3.12 (m, 4H), 2.55 (dd, J= 2.60
Hz, 1H), 2.40 (s, 3), 1.99 (m, 1H), 1.87 (s, 6H), 1.75 (m, 4H).
2.5.9 Binding Studies
Polymer was heated and stirred in a sealed container of the desired solvent at 80 °C
for 24 h. The mixture was cooled and the polymer was removed and washed with
acetonitrile 5x. Polymer was then dried in vacuo.
Polymer (60 mg) was added to 2.5 mL of 0.1 mM EA9A and shaken for 2 hours.
The polymer was separated from the solution, and UV-vis at 257 nm was used to quantify
2.5.10 Swelling Studies.
Ground polymer (160 mg) was placed in 5 mm NMR tubes. Excess water, hexane,
or acetonitrile was added and heated at 83 °C for 26 h. The volume of swelling was
determined by measuring the heights of the dry polymers versus the solvent heated
polymers.
2.6 REFERENCES
1. Degenhardt, C., III; Shortell, D. B.; Adams, R. D.; Shimizu, K. D. J. Chem. Soc.,
Chem. Commun. 2000, 929-930.
2. Chong, Y. S.; Shimizu, K. D. Synthesis. 2002, 9, 1239-1244.
3. Rasberry, R. D.; Shimizu, K. D. Org. Biomol. Chem.2009, 7, 3899-3905.
4. Choi, D. S.; Chong, Y. S.; Whitehead, D.; Shimizu, K. D. Org. Lett. 2001, 3, 3757-3760.
5. Lavin, J. M.; Shimizu, K. D. Chem. Commun. 2007, 228–230.
6. Degenhardt, C. F.; Lavin, J. M.; Smith, M. D.; Shimizu, K. D. Org. Lett. 2005, 7, 4079–4081.
7. Lee, M.W.; Herndon, W.C. J. Org. Chem. 1978, 43, 518.