Addressable Load-shedding System for the
Smart Grid
Benjamin, Ezekiel A.1, Iloh, John Paul I.2, Nwabueze, Christopher A.3
Postgraduate Student, Chukwuemeka Odumegwu Ojukwu University, Uli, Anambra. Nigeria1 Senior Lecturer, Department of EEE, Chukwuemeka Odumegwu Ojukwu University, Uli, Anambra. Nigeria2 Associate Professor, Department of EEE, Chukwuemeka Odumegwu Ojukwu University, Uli, Anambra. Nigeria3
ABSTRACT: Full implementation of the smart grid concept will play a vital role in the development of smart cities. In most developing countries, the grid systems are characterized by demand that exceeds supply. To mitigate a collapse in the system, load-shedding methodology is implemented. However, some smart cities infrastructures such as Data Centers, Hospitals, Aviation Systems, Communication and intelligent transportation systems amongst others will depend on a reliable grid system. This work proposes two classes of consumers - Controllable Load and Priority Load classes as subscribed to by the consumers themselves. Load-shedding operation targets individual consumers in the Controllable Load class. The inconveniencies suffered by the Controllable Load class consumers are compensated with a lower energy pricing system. Addressable Load-shedding System mitigates load-shedding as well as over-loading of feeders.
KEYWORDS:Smart Grid, Addressable Load-shedding, Renewable, SCADA, Management, Consumers
I. INTRODUCTION
Figure 1 illustrates the concept of a smart grid. The smart grid clearly is a web of many threads. It consists of millions of technologies and components. So, to perfect these technologies and to make them to work together will take time, research, approval, installation and testing before it comes out to the public [5]
II. RELATED WORKS
Traditionally, load-shedding systems include under-voltage control, and under-frequency control schemes. The most commonly used method for controlling the frequency of power networks within set limits and maintaining the network stability under critical conditions is Load-shedding by frequency relays [6]. In 2016, a review of under-frequency load-shedding research papers was published [7]. A review of techniques relating to voltage factor was published featuring voltage instability detection [8]. Under-voltage schemes for load-shedding [9]. Under-voltage load shedding (UVLS) scheme was considered more reliable than under-frequency load shedding (UFLS) [10]. Review of load shedding techniques has also been seen in the work carried out [11]. The disadvantage associated with existing load-shedding methods could mean a huge loss to the utility company due to the load-shedding of an excess load. There is a need to investigate better feasibility of novel optimization techniques which leads to provide a good balance between the load shedding schemes and quality of power system restoration process [12].
Some smart cities infrastructures such as Data Centres, Hospitals, Aviation Systems, Communication and intelligent transportation system that depend on reliable grid system are denied access to power supply. Addressable Load-Shedding as introduced in this work, seeks to match load with available supply. The Internet of Things (IoT) has evolved from the convergence of wireless technologies, micro-electromechanical systems, microservices and the Internet. The Internet of Things (IoT) is a system of interrelated computing devices, mechanical and digital machines, objects, animals or people that are provided with unique identifiers and the ability to transfer data over a network without requiring human-to-human or human-to-computer interaction [13]. The Smart Grid, regarded as the next generation power grid, uses two-way flow of electricity and information to create a widely distributed automated energy delivery network [14]. Smart grid initiatives seek to improve operations, maintenance and planning by making sure that each component of the electric grid can both send and receive data [15]. A well coordinated communication between connected smart devices will require an intelligent SCADA (Supervisory Control and Data Acquisition) system [16].
III. METHODOLOGY
Addressable Load-Shedding as implemented in this work relied on IoT within a SCADA system. Smart Meters deployed at the consumer’s end communicates with the Master SCADA for ON/OFF signals. This work creates two classes of consumers – Controllable Load (CL) and Priority Load (PL) classes as subscribed to by the consumers themselves. Load-shedding operation targets individual consumers in the CL class. The inconveniencies suffered by the CL class consumers are compensated with a lower energy pricing system. Priority Load consumers essentially includes some smart cities infrastructures such as Data Centres, Hospitals, Aviation Systems, Communication and intelligent transportation systems that depends on reliable grid system. Consumers, who do not wish to be in the CL class, can subscribe to the PL class.
3.1. SCADA System
Figure 2: SCADA network for DNA (Distribution Network Automation)
The Smart Meters (SMs) are sensors and control relays that directly interfaces with the consumers’ load demand (i.e. managed system). The Smart Meters report to the Remote Telemetry Units (RTUs). The RTUs serve as local collection points for communications between the SCADA Master Unit and the Smart Meters. These RTUs report to SCADA master units via a communication network. The choice of a communication network depends on some other factors such as area of network coverage and the required bandwidth. The Master unit provides a human interface to the system and automatically regulates the managed system in response to real-time energy demand and supply. Figure 2 shows the arrangement of SCADA system components used in this work to automate the electricity distribution network.
3.2. Energy Management System
In this sub-section, there are factors that are considered to implement an EMS namely:-
i. Asaba Load Information
Demand of Asaba Business Unit peaks at about 82.25MW, compared to an average grid allocation of 28MW. It means that demand is about three times above supply. However, the peak demand is reduced to 47MW when all the consumers adopted efficient energy usage.
company control some or their entire load as a result of peaking energy demands. In this scheme, the utility monitors peaking load demands and sends an ON/OFF command to the smart meters registered in the contract scheme. Each smart meter registered in this contract scheme is identifiable using appropriate communication link to enable communications between smart meters and Utilities SCADA/Energy Management System. To achieve this proposed scheme, consumers under the CLM contract scheme are accorded a reduced energy pricing plan.
iii. Renewable Energy- to complement power supplies from utilities, consumers are encouraged to integrate Renewable Energy Sources (RES) with Energy Storage Units (ESU) into their energy plans. Available RES include solar, wind, Geothermal, small hydropower, and biomass energy sources.
iv. Proposed Consumers’ EMS: - consumers registered in the Controllable Load Management (CLM) scheme shall at minimum install ESUs in their premises, and may install other RESs to complement the Utility’s power source.
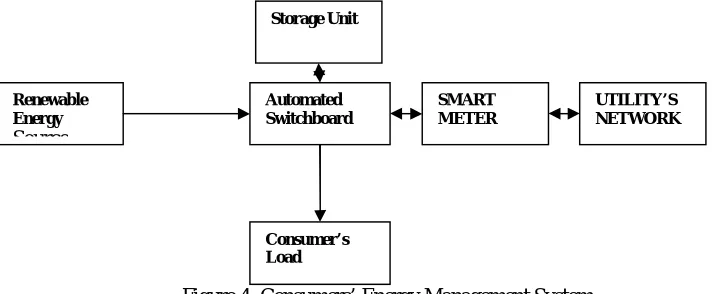
Figure 4: Consumers’ Energy Management System
In figure 4, the Utility’s network is the primary source of supply to the consumer, while the RES is an alternative energy source. The smart meter as an interface between the grid and consumers’ automated switchboard is both an energy measuring device and a switching device. The automated switchboard routes energy from the grid to the consumers’ load and storage unit whenever the smart meter is energized, and alternatively routes energy from the RES to the consumers’ load and storage unit whenever the smart meter is load-shedded. However, at some other times, it can synchronize energy from both sources, and route it to both consumers’ load and storage unit. The storage unit as an energy source is a back-up to the other energy sources.
3.3. Load-shedding Flowchart
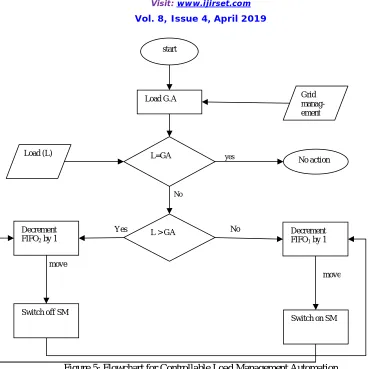
Figure 5 is the flowchart for controllable load management procedure used in this work. The first operation begins with loading of GA - a reference load value base on grid allocation/availability. Every second, the system compares the values of L (Load)and G.A (Grid Allocation/Availability). If L=GA no further action is taken. However, if L≠ GA,
then, further processing is required.
UTILITY’S NETWORK Renewable
Energy
Source
Storage Unit
Automated Switchboard
SMART METER
Figure 5: Flowchart for Controllable Load Management Automation
For L>GA, it implies that load shedding of a controllable load would be activated. The selection of SM to load-shed is done by means of the First-In-First-Out (FIFO2)register as a queuing system. The first SM that was energized
automatically becomes the first SM to be load-shedded sequentially. At the time of load-shedding an SM, its address is automatically sent to queue into the load-shedding First-In-First-Out (FIFO1) register waiting to be re-energized as a
last-in.
For L<GA, it implies a need to energize an additional load from the load-shedding register (FIFO1). Similarly, the
selection of the SM to be re-energized is done by means of the FIFO1 register as a queuing system. The first SM that
was load-shedded automatically becomes the first SM to be re-energized. At the time of re-energizing an SM, its address is sent to the in-circuit register waiting to be load-shedded in the FIFO1 system.
IV. SIMULATION AND RESULTS
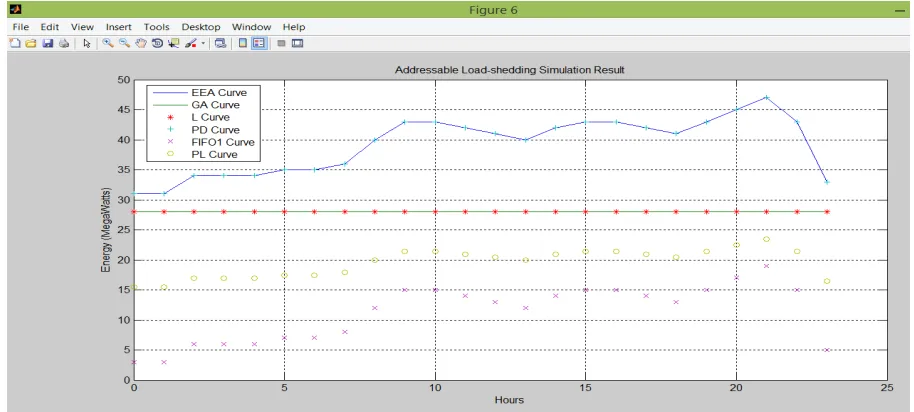
The algorithm for the simulation is shown in sub-section. The value of EEA is used in the simulation. Figure 6 shows a comparative result of the simulation.
move move
Yes No
No
yes Load G.A
L=GA Load (L)
L > GA
No action
Decrement FIFO2 by 1
Decrement FIFO1 by 1
Switch off SM
AFL = [54.25,54.25,59.50,59.50,59.50,61.25,61.25,63,70,75.25,75.25,73.50,71.75,70,73.50,75.25,75.25,73.50,71.75,75.25,78. 75,82.25,75.25,57.75];
EEA = [31,31,34,34,34,35,35,36,40,43,43,42,41,40,42,43,43,42,41,43,45,47,43,33]; PL=EEA*0.4989;
CL=EEA*0.5011; FIFO2=GA-PL; FIFO1=CL-FIFO2; CL=FIFO2+FIFO1; L=PL+FIFO2; PD=PL+CL; figure
plot(x,EEA,x,GA,x,L,'*',x,PD,'+',x,FIFO1,'x',x,PL,'o'); xlabel 'Hours';
ylabel 'Energy (MegaWatts)';
title 'Addressable Load-shedding Simulation Result';
legend ('EEA Curve','GA Curve','L Curve','PD Curve','FIFO1 Curve','PL Curve'); grid on;
4.2. Result and Discussion
Figure 6: Addressable Load-shedding Simulation Result
Figure 6 shows comparative curves of Asaba Full Load (AFL) demand, Energy Efficiency Applied (EEA) demand and Grid Allocation/Availability (GA) in megawatts. Full load demand values are at peak between 18:00hrs to 22:00hrs, and minimum between 23:00hrs to 01:00hrs. Peak demand is 82.25MW at 21:00hrs and minimum demand is 54.25MW at 01:00hrs. The straight line represents GA, with an average value of 28MW.
V. CONCLUSION
In Smart Grid deployment, load-shedding is usually not desirable especially in power systems with adequate energy supply. However, in situations where demand exceeds supply, load-shedding becomes inevitable to avoid a collapse of the grid. Addressable Load-shedding System for the Smart Grid will mitigate systems collapse due to grid overload as well as encourage more Renewable Sources integration into the grid.
REFERENCES
[1] P. Obi, "Powering and Lighting-up Nigeria". New Telegraph, p56, January 28, 2015.
[2] F. Olasupo, " FG Introduces Jatropha To Combat Desertification, Reduce Emission" Vanguard News Nigeria: http://www.vanguardngr.com/2016/10/fg-introduces-jatropha-combat-desertification-reduce-emission/, 2016
[3] A. Essien, I. Igweonu, C. Eguzo, and B. Robert, "Integrating Smart Grid Model in Nigeria Power Network" International Journal of Advances in Engineering & Technology, Vol 6 No 4, pp1760-1768, 2013.
[4] E. Marris, "Energy: Upgrading the Grid" https://www.nature.com/news/2008/080730/full/454570a.html, 2008. [5] G. Kaushal, “Technical Article on Smart Grid”, http://hscl.co.in/files/NIRMAN_REL090617_2017.pdf, 2017.
[6] M.T. Ameli, S. Moslehpour, H.R. Khoshmakani. Presentation and Comparison of the Various Methods of Load-Shedding for Frequency Control in Iran Power Networks, IJME-INTERTECH Conf., pp. 315-320, 2006.
[7] M. Lu, W.A. ZainalAbidin, T. Masri, D.H. Lee, and S. Chen, "Under-Frequency Load Shedding (UFLS) Schemes – A Survey", International Journal of Applied Engineering Research. Vol 11, Issue 1, pp456-472, 2016.
[8] M. Glavic, and T.V. Cutsem, "A short Survey of Methods for Voltage Instability Detection" IEEE Power and Energy Society General Meeting , pp1-8, 2011.
[9] R.Verayiah, A. Mohamed, H. Shareef, and I.Z. Abidin, "Review of Under-voltage Load Shedding Schemes in Power System Operation", http://pe.org.pl/articles/2014/7/19.pdf, 2014.
[10] C. Mozina, "Undervoltage Load Shedding", IEEE Power Systems Conference: Advanced Metering, Protection, Control, Communication, and Distributed Resources, pp39-54, 2007.
[11] P. Lakra, and M. Kirar, "Load Shedding Techniques for System with Cogeneration: A Review", Electrical and Electronics Engineering: An International Journal (ELELIJ) Vol 4, No 3, 2015.
[12] C. Raghu, and A. Manjunatha, "Assessing Effectiveness of Research for Load Shedding in Power System" International Journal of Electrical and Computer Engineering , pp3235-3245, 2017.
[13] I. Wigmore, "Internet of Things", http://internetofthingsagenda.techtarget.com/definition/Internet-of-Things-IoT, 2014. [14] Eskare. "Smart Grid Solutions", http://www.eskare.com/Article1.html, 2014.
[15] Schneider Electric, "SCADA System", https://www.schneider-electric.com/solutions/eg/en/med/20340568/application/pdf/1485_se-whitepaper-letter-scadaoverview-v005.pdf, 2012.
![Figure 1: The Smart Grid [4].](https://thumb-us.123doks.com/thumbv2/123dok_us/1552717.1190616/1.595.77.519.582.769/figure-the-smart-grid.webp)