Copyright to IJIRSET www.ijirset.com 3115
TRANSFORMER FAULT
DETECTION USING DWT-DCT
Rajni Gupta
1, Mr. Rinku Kumar
2M.Tech student, Department of Electrical Engineering, DIET College, Karnal, Haryana 1
Assistant Professor, Department of Electrical Engineering, DIET College, Karnal, Haryana2
Abstract: Wavelet transform can be applied with the Fourier transform to analyse a signal. This transform gives the signal
characteristics in time or in frequency domain. But they don‟t give the combination of both. Wavelet Transform splits the signal energy in time-frequency domain. In this paper, In this a new approach was presented in order to recognize and distinguish fault signal from inrush current. With this kind of analysis, these two currents can be separated simply since the distribution of energy in time and frequency domain for inrush and fault currents is very different. The results shows that DCT –DWT splits differential current into small wavelets. This is done by filters in DWT. Various wavelet filters has been tried for all types of faults. It has been concluded that db6 wavelet shows best result for fault detection.
Keywords: Discrete Cosine Transform, Discrete Wavelet Transform, Inrush Current, db6 wavelet
I. INTRODUCTION
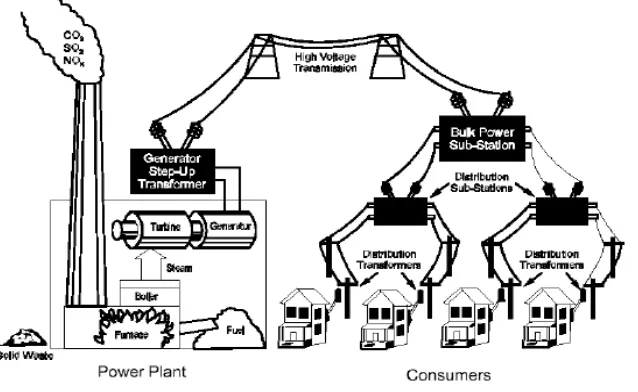
Transformers are an essential part of the electric power system because it has ability to change voltage and current level, which enables to generates, transmit and distribute electric power at economical and suitable level. Figure shows that voltage of electricity generated at the power plant will be increased at higher level by using step-up transformers. A higher voltage will reduce the energy lost during the transmission process of the electricity. After electricity has been transmitted to various end points of the power grid, voltage of the electricity will be reduced to usable level by using step-down
transformer.
Figure 1: The structure of electric power transmission and distribution system
Copyright to IJIRSET www.ijirset.com 3116
Figure2: Primary and secondary windings of transformer
Figure2 shows the basic operating principle of the transformer. The input coil of the transformer is called the primary winding and the output coil is called the secondary winding. The voltage induced in the secondary is determined by the turn ratio and the primary side voltage.
II.INRUSHMAGNETIZINGCURRENT
When the transformer is disconnected from its source a magnetizing current is retained in the primary of transformer which causes a high surge of current. This surge is multifold to transformer rating and it exists till all the magnetic flux is removed by supply. Magnetizing Inrush current in transformer results from any abrupt change of the magnetizing voltage. Although usually considered as a result of energizing a transformer. Due to presence of a small resistor and large resistance in the transformer winding an inrush current appear in the primary winding.
A. Causes of InrushCurrent
1. Occurrence of an external fault
2. Voltage recovery after clearing an external fault. 3. Change of the character of a fault.
4. Out of phase synchronizing of a connected generator. B. Characteristics of Inrush Current
Generally contain dc offset, odd harmonics, and even harmonics.
Typically composed of unipolar or bipolar pulses, separated by intervals of very low current values. Peak values of unipolar inrush current pulses decrease very slowly.
Time constant is typically much greater than that of the exponentially decaying dc offset of fault currents. Second-harmonic content starts with a low value and increases as the inrush current decreases.
III.FAULT ANALYSIS
A. Fourier Transform
Fourier transform (FT) is the most popular transformation that can be applied to travelling wave signals to obtain their frequency components appearing in the fault signal. Usually, the information that cannot be readily seen in the time domain can be seen in the frequency domain. The FT and its inverse give a one-to-one relationship between the time domain x(t) and the frequency domain X(w). Given a signal I (t), the FT FT (w) is defined by the following equation:
Where w is the continuous frequency variable. This transform is very suitable for stationary signal, where every frequency components occur in all time. The discrete form of the FT can be written as
Copyright to IJIRSET www.ijirset.com 3117
integration equally. This is why FT is not suitable for non-stationary signals. The FT has good results in the frequency-domain but very poor results in the time frequency-domain. When the current surge hits the fault point, it is reflected with the same sign and travels back to the source end of the line. Then, it is reflected again from the source end with the same sign and returns back to the fault point. Since the duration of this complete cycle is 4 , (τ is the propagation time of the surge from the source end to the fault point) the main component of the current signal after the circuit breaker opening has a frequency equal to
so that the distance to the fault may be obtained as
B. DiscreteWavelet Transform
The wavelet multi resolution analysis is a new and powerful method of signal analysis and is well suited to travelling wave signals. Wavelets can provide multiple resolutions in both time and frequency domains. The windowing of wavelet transform is adjusted automatically for low and high-frequencies i.e., it uses long time intervals for low frequency components and short time intervals for high frequency components. Wavelet analysis is based on the decomposition of a signal into „scales‟ using wavelet analysing function called „mother wavelet‟. The temporal analysis is performed with a contracted, high frequency version of the „mother wavelet‟, while the frequency analysis is performed with a dilated, low frequency version of the „mother wavelet‟. Wavelets are functions that satisfy the requirements of both time and frequency localization. The necessary and sufficient condition for wavelets is that it must be oscillatory, must decay quickly to zero and must have an average value of zero. In addition, for the discrete wavelet transform considered here, the wavelets are orthogonal to each other. Wavelet has a digitally implementable counterpart called the discrete wavelet transform (DWT). The generated waveforms are analyzed with wavelet multi resolution analysis to extract sub-band information from the simulated transients. Daubechies wavelets are commonly used in the analysis of travelling waves. They were found to be closely matched to the processed signal, which is of utmost importance in wavelet applications. Daubechies wavelets are more localized i.e., compactly supported in time and hence are good for short and fast transient analysis and provide almost perfect reconstruction. However, there are some other wavelets show a good correlation with the transient signals and may be used in the analysis. Several wavelets have been used in this thesis. Due to the unique feature of providing multiple resolution in both time and frequency by wavelets, the sub-band information can be extracted from the original signal. When applied to faults, these sub-band information are seen to provide useful signatures of transmission line faults, so that the fault location can be done more accurately. By randomly shifting the point of fault on the transmission line, a number of simulations are carried out employing the MATLAB. The generated time domain signals for each case are transferred to the modal domain using Clark‟s transformation. Then, the aerial mode signal is analyzed using wavelet transform. From the different decomposed levels, only one level is considered for the analysis. This level has the highest energy level output and the dominant frequency of the transient. Waveforms associated with the travelling waves are typically non-periodic signals that contain localized high frequency oscillations superimposed on the power frequency and its harmonics. DFT was found to be not adequate for decomposing and detecting these kinds of signals because it does not provide any time information. On the other hand, the STFT takes the time dependency of the signal spectrum into account. However, the time-frequency plane cannot give both accurate time and frequency localizations. The Wavelet transform allows time localization of different frequency components of a given signal like the STFT but its transformation functions called wavelets which adjust their time widths to their frequency in such a way that higher frequency wavelets will be narrow and lower frequency ones will be broader. Wavelet‟s time frequency resolution provides a useful tool for decomposing and analyzing fault transient signals. Given a function x(t), its Continuous Wavelet Transform (CWT) is defined as follows:
The transformed signal is a function with two variables b and a, the translation and the scale parameter respectively. (t)
Copyright to IJIRSET www.ijirset.com 3118
ensure that each scaled wavelet function has the same energy as the wavelet basis function. It should also satisfy the following admissible condition:
The term translation refers to the location of the window. As the window is shifted through the signal, time information in the transform domain is obtained. a is the scale parameter which is inversely proportional to frequency. Wavelet transform of sampled waveforms can be obtained by implementing the DWT, which is given by:
Where (t) is the mother wavelet, and the scaling and translation parameters a and b are replaced by and
respectively, n and m being integer variables. In the standard DWT, the coefficients are sampled from the CWT on a dyadic grid. The wavelet coefficients (WTC) of the signal are derived using matrix equations based on decomposition and reconstruction of a discrete signal. Actual implementation of the DWT involves successive pairs of high-pass and low-pass filters at each scaling stage of the DWT. This can be thought of as successive approximations of the same function, each approximation providing the incremental information related to a particular scale (frequency range). The first scale covers a broad frequency range at the high frequency end of the spectrum and the higher scales cover the lower end of the frequency spectrum however with progressively shorter bandwidths. Conversely, the first scale will have the highest time resolution. Higher scales will cover increasingly longer time intervals.
C. Filter bank
Figure3: Wavelet Transform filter bank
A time-scale representation of a digital signal is obtained using digital filtering techniques. Above figure shows the wavelet transform filter bank. The DWT analyzes the signal at different frequency bands with different resolutions by decomposing the signal into a coarse approximation and detail information. The DWT employs two sets of functions, called wavelet functions and scaling functions, which are associated with a lowpass and high-pass filters. The multi-stage filter bank implement the DWT using the low-pass mother wavelet H1(n) and its half band highpass filter dual, H1(n) . After the filtering, half of the samples can be eliminated according to the Nyquist‟s rule, since the signal now has a highest frequency of f /2 instead of f. The signal therefore can be downsampled by 2, simply by discarding every other sample. The output of the low-pass filter is filtered again in high and low-pass filters until DC value is reached. This procedure is repeated without the down-sampling block after the high-pass filters. H0 and H1 are low-pass and high-pass filters respectively. The outputs of the high-pass filter are the original signal in different scaling.
IV.PROPOSEDMETHODUSINGDCT-DWT
Copyright to IJIRSET www.ijirset.com 3119
Figure4: MATLAB Model
V. RESULTS
Inrush current in transformer is checked by Fourier Transform. The second order harmonics of the Fourier transform always represents Inrush current. The peak of second harmonics will be always highest in case of Inrush current. Here in this work the differential current is first undergone DCT transform before breaking into small wavelets by DWT. The filters used in the form of Wavelets in DWT are many, but best results are shown by db6 wavelet. Below are the results shown for different wavelet filters. Given figure shows the Fourier Transform of differential current when three- phase fault occurs along with Inrush Current.
Figure5: Fourier Transform of differential current in three phase fault environment
0 2 4 6 8 10 12 14 16 18
-0.04 -0.03 -0.02 -0.01 0 0.01 0.02 0.03 0.04 0.05 0.06
Order of Harmonic
M
ag
ni
tu
de
b
as
ed
o
n
"B
as
e
Pe
ak
"
P
ar
am
et
er
Copyright to IJIRSET www.ijirset.com 3120
The differential current after passing through DCT-DWT by using db4 filter is shown in figure given below
Figure6: 3-phase fault differential current by DWT using db4 filter
The main difference between fourier transform and DCT-DWT transform is that fourier transform give detail only in frequency domain whereas DCT-DWT gives information in time domain as well as in frequency domain also. It shows that maximum energy lies between 5600-10000 samples . the fault occurrence is shown in between 1700-56000 samples where the magnitude is almost zero.
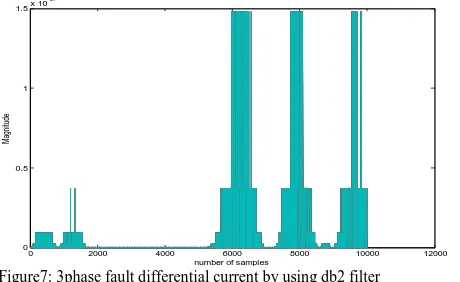
Figure7: 3phase fault differential current by using db2 filter Figure8: 3 phase fault differential current by using db6 filter
In figure 7 three phase fault now results are shown for db2
Figure 8 shows that maximum energy is confined near 6000 samples. Above figures clearly depicts that filter db6 is best suitable for three phase fault detection.
Now single lines to ground fault results are shown in below figures. Fourier transform of single phase to ground fault shows the highest peak is of second harmonics but first and third harmonic are less than those in three phase fault detection. DWT-DCT transform using db6 filters are best as it confines maximum energy near 7000 samples.
0 2000 4000 6000 8000 10000 12000 0
1 2 3
x 10-68
number of samples
M
ag
ni
tu
de
3 phse fault diiferential cutrrent Wavelet Transform
0 2000 4000 6000 8000 10000 12000 0
0.5 1 1.5x 10
-67
number of samples
M
ag
ni
tu
de
0 2000 4000 6000 8000 10000 12000 0 0.2 0.4 0.6 0.8 1 1.2 1.4x 10
-66
number of samples
M a g n it u d e
3 phse fault diiferential cutrrent Wavelet Transform
0 2 4 6 8 10 12 14 16 18
-0.03 -0.02 -0.01 0 0.01 0.02 0.03 0.04 0.05
Order of Harmonic
M ag nit ud e ba se d on "B as e Pe ak " P ar am et er
Copyright to IJIRSET www.ijirset.com 3121
Figure9: Fourier transform for single phase to ground fault
Figure10: Single Phase to Ground fault differential current Figure11: Single Phase to Ground fault differential current by DWT using
by DWT using db2 filter db4 filter
Figure12: Single Phase to Ground fault differential current by DWT using db6 filter
VI. CONCLUSION
In this study a new approach was presented in order to recognize and distinguish fault signal from Inrush current. Wavelet transforms splits off the signal energy in time-frequency domain whereas Fourier transformer does not have this capability. With this kind of analysis, these two currents can be separated simply since the distribution of energy in time and frequency domain for inrush and fault current is very different. Because of the existence of DC component and even harmonics in inrush current and regarding the sampling frequency (64 samples per cycle) the energy of zero, third and fourth levels can be a proper criteria for recognition.
It has been shown in results that DCT – DWT splits differential current into small wavelets. This is done by filters in DWT. Various wavelet filters has been tried for all types of faults. It has been concluded that db6 wavelet shows best results for fault detection. Results are also shown using Fourier transform. But Fourier transform shows results only in frequency domain.
The second harmonic represents the inrush current. DCT-DWT shows that when three phase fault occurs then maximum energy is confined in single lob near 7000 sample while in single phase to ground and double phase to ground the all energy is not confined into single lob it is distributed in other lobs also as cleared from results.
REFERENCES
[1]. Y. Najafi Sarem, E. Hashemzadeh, M.A. Layegh,”TRANSFORMERS FAULT DETECTION USING WAVELET TRANSFORM” IJTPE March 2012 Issue 10 Volume 4 Number 1 Pages 17-26.
[2]. Waad Noori Taboor, Dr. Adel Ahmed Obed, Dr. Majed Abdul Nabi Alwan,”Application of Wavelet Packet and S Transforms for Differential Protection of Power Transformer”, Number 2 Volume 19 February 2013 Journal of Engineering
[3]. Adel Aktaibi ,”Wavelet Packet Transform Algorithm Based Differential Protection of Power Transformers” Student member, IEEE
0 2000 4000 6000 8000 10000 12000
0 1 2 3
x 10-68
number of samples
M
ag
ni
tu
de
3 phse fault diiferential cutrrent Wavelet Transform
0 2000 4000 6000 8000 10000 12000
0 0.1 0.2 0.3 0.4 0.5 0.6 0.7 0.8 0.9
1x 10 -68
number of samples
M a g n it u d e
3 phse fault diiferential cutrrent Wavelet Transform
0 2000 4000 6000 8000 10000 12000
0 0.5 1 1.5 2 2.5 3 3.5x 10
-67
number of samples
Ma
gn
itu
de
Copyright to IJIRSET www.ijirset.com 3122
[4]. Okan ¨OZG¨O NENEL, “Transformer Protection Using the Wavelet Transform”, Turk J Elec Engin, VOL.13, NO.1 2005.
[5]. Tanuja Anuchuri, M.R.L.Jyostna, “STUDY OF TRANSIENT PHENOMENA IN POWER TRANSFORMER USING WAVELETS AND ANN ALGORITHM” IJESAT Volume-2, Issue-4, 1055 – 1060
[6]. S. Sendilkumar, B. L. Mathur, and Joseph Henry,” Differential Protection for Power Transformer Using Wavelet Transform and PNN” International Journal of Electrical and Electronics Engineering 4:7 2010
[7]. Mudathir Funsho Akorede and Hashim Hizam,” Wavelet Transforms: Practical Applications in Power Systems” Journal of Electrical Engineering & Technology Vol. 4, No. 2, pp. 168~174, 2009
[8]. M. Michalik, and T. M. Okraszewski,” Application of The Wavelet Transform to Backup Protection of MV Networks – Wavelet Phase
Comparison Method” 2003 IEEE, June 23-26th