Research Article
Mapping and Inventory of Forest Fires in Andhra Pradesh,
India: Current Status and Conservation Needs
C. Sudhakar Reddy,
1P. Hari Krishna,
1K. Anitha,
2and Shijo Joseph
21Forestry & Ecology Division, National Remote Sensing Centre, Balanagar, Hyderabad 500 625, India 2Forest and Environment Program, Center for International Forestry Research, Bogor 16115, Indonesia Correspondence should be addressed to C. Sudhakar Reddy,[email protected] Received 13 August 2012; Accepted 19 September 2012
Academic Editors: G. Martinez Pastur, P. Robakowski, and A. M. Vettraino
Copyright © 2012 C. Sudhakar Reddy et al. This is an open access article distributed under the Creative Commons Attribution License, which permits unrestricted use, distribution, and reproduction in any medium, provided the original work is properly cited.
Analyzing the spatial extent and distribution of forest fires is essential for sustainable forest management. The present study appraises the distribution of forest fires in one of the largest states in India, Andhra Pradesh, using satellite remote sensing. Advanced Wide Field Sensor (AWiFS) onboard on Indian Remote Sensing Satellite (IRS P6) was used for mapping and analyzing the spatial extent of burnt areas. Comparative analysis was carried out with respect to different forest types, protected areas and across elevation zones to demarcate and identify the fire-affected areas. The results show that about 19% (8594 km2) of forest
area were burnt in the state during 2009. Burnt area statistics for Protected Areas reveal that 24% of forest cover was affected by fire. Nagarjunasagar Srisailam Tiger Reserve, the largest tiger reserve of the country, shows an area of 793 km2(22%) under forest
fire. Higher elevation areas which are predominantly dominated by savannah and woodlands experienced higher fire occurrence in comparison with lower elevation areas. Similarly, fires were prevalent near edges compared to core forest. Results of the study suggested that forests of Andhra Pradesh are prone to high fire occurrences and current fire regime poses a severe conservation threat to biodiversity both within and outside the Protected Areas.
1. Introduction
Fires affect the species composition, structure, pattern of veg-etation, biomass, and consequently cause significant damage to the tropical forests [1,2]. Globally, more than 350 million ha of forests were burned in 2000, an area of nearly equal to the size of India [3]. In many tropical deciduous ecosystems, fire is part of the natural regeneration process, stimulating the germination of certain species (Teak) and clearing space for the invasion [4]. Increased burn frequencies can therefore progressively weed out more fire-vulnerable components of biodiversity. Frequent fires may cause mortality of smaller trees, opening up the canopy and leading to the gradual conversion of once-closed forests to woodland savannahs with low tree density and a grassy understory [5].
In India, large areas of tropical dry forests have already been converted to grasslands or other land use as a result of fire and other practices [6,7]. According to the Ministry of Environment and Forests, Government of India, 3.73 Mha
of forests are affected by fires annually in India [8]. The extent of these fires depends on various factors such as the frequency of human disturbances and the climate of the region [9]. Forest dependent communities burn forests for shifting cultivation or to promote the growth of fresh fodder for grazing, and to facilitate the collection of non timber forest products [10]. Beddome [11] described the effects of increased burn frequencies under slash-and-burn cultivation in the states of Andhra Pradesh and Orissa. These forests have a wretched and stunted appearance, are very dry, and more or less impenetrable from a tangled rank undergrowth, and there are no seedlings, nothing, in fact, but the coppice growth generally of not only the quicker growing but also poorer sorts of timber. Brandis [12] observation from Indian forests suggested that the dominance of certain thick-barked species, or species that are able to resprout vegetatively in fire affected forests.
There is no comprehensive data available on different dimensions of fire on a regular basis in India [8]. There is
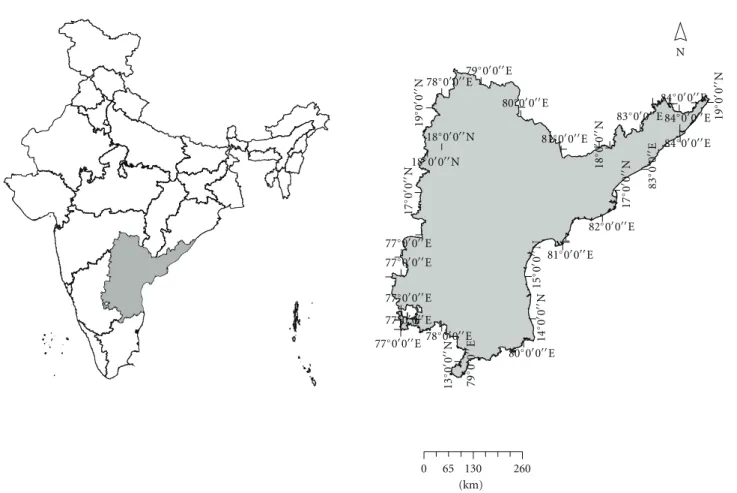
0 65 130 260 (km) 19 ◦0 0 N 17 ◦0 0 N 17 ◦0 0 N 18◦00N 18◦00N 14 ◦0 0 N 15 ◦0 0 N 18 ◦0 0 N 19 ◦0 0 N 13 ◦0 0 N 77◦00E 77◦00E 77◦00E 81◦00E 82◦00E 77◦00E 77◦00E78◦00E 80◦00E 80◦00E 79◦00E 78◦00E 81◦00E 83◦00E 83 ◦0 0 E 84◦00E 84◦00E 84◦00E 79 ◦0 0 E N
Figure 1: Location map of Andhra Pradesh in India.
a requirement of national level precise burnt area assess-ment using high-and moderate-resolution satellite data in addressing the various issues like reliable assessment in terms of area, number of patches and spatial spread, base line information for temporal monitoring and fire recurrence assessment, identification and prioritization of vulnerable areas, understanding the impacts on regeneration, succes-sion, biodiversity and wildlife, assessment in terms of Green House Gas Emissions towards national communication, scope for developing web enabled national forest burnt area reporting system, and fire mitigation planning [1–13].
Technological advancement of satellite remote sens-ing both in spatial and spectral sensors is a cost- and time-effective solution in identifying areas for biodiversity conservation. Currently several satellite-based sensors like AWiFS, LISS-III, MODIS, ETM+, SPOT, AATSR, AVHRR, and MODIS provide synergistic datasets that have potential in forest fire detection, inventory, mapping, and damage assessment [1]. Forest burnt areas have a typical spectral signature, especially if analysed by a multitemporal approach because of the different ground coverage between prefire (vegetation) and postfire (white ash, black ash, bare soil, and dead vegetation) conditions [14].
Forest fires, invasive species, and shifting cultivation are recognized as serious threat to biodiversity of many Protected Areas (PAs). Recent findings from the PAs of the tropics confirm that Lantana may be favored by fire and grazing
[15]. A critical issue is that without a clear understanding of the distribution and dynamics of forest fires, it is impossible to effectively manage them [16]. With the current trend of increasing rate of forest fires, there is an urgent need to generate a spatial database for planning, decision making, and further objective-oriented requirements. With respect to the burnt area extent and forest-type detailed information is needed in order to assess postfire ecological effects on the biodiversity.
Among the 10 biogeographic zones of India, Deccan Peninsula was found to be prone to the highest fire frequency. Among the states of Deccan Peninsula, Andhra Pradesh, Chhattisgarh, and Madhya Pradesh are regularly affected with human-induced fires. Fire occurrence information as per AATSR satellite shows maximum fires during March and April in Deccan Peninsula [17]. The estimated forest burnt area of Andhra Pradesh state was 6369 km2 during 2000
[18], which is based on coarse resolution (1.1 km2)
SPOT-VGT satellite data. In view of scanty research work on forest fires in Andhra Pradesh, the present study was focused on assessment and inventory of forest fires covering number of fires, burnt area size, annual area burned, and distribution across forest types using IRS P6 AWiFS data for the 2009. In the present study, an attempt was also made to generate the information on forest burnt areas across the districts, Protected Areas, and elevation zones of Andhra Pradesh.
0 65 130 260 (km)
N
Figure 2: IRS P6 AWiFS FCC image of Andhra Pradesh (March,
2009).
1 2
3
Figure 3: Active burnt and after fire signatures on IRS P6 AWiFS
image (4,3,2 band combination) of March 7th, 2009. (1) Active fire area (2) postfire area (3) smoke.
2. Materials and Methods
2.1. Study Area. The State of Andhra Pradesh is situated
in the middle of eastern half of the Indian Peninsula lying between 12◦ 41–190 54N latitudes and 760 46–840 45E
longitudes (Figure 1). It is India’sfourth largest state by area
andfifth largest by population. It is bounded by the Bay of Bengal in the east, Tamil Nadu in the south, Karnataka in the west, and Maharashtra, Chhattisgarh, and Orissa in the north. Andhra Pradesh receives most of its annual rainfall from the south-west monsoon as well as from the north-east monsoon. The south-west monsoon begins in the second
0 75 150 300 (km)
Bamboo mixed forest
Forest Plantation Scrub Mangrove N Riverine forest Woodland Savannah Grassland Other Land Use Semi evergreen forest
Moist Deciduous forest Dry Deciduous forest Dry Evergreen forest Thorn forest Teak mixed forest Forest burnt area
Figure 4: Forest burnt areas overlaid on forest-type map of Andhra
Pradesh.
week of June and lasts till September while the north-east monsoon descends between October and November. The state experiences a mild winter in December but the temperature hardly goes down below 16◦C. The hot season prevails in the months of March, April, and May when it could shoot up to 40 degrees or even higher.
Geographically, the state is categorized into three regions, namely, (1) the Coastal Plains (along the east coast, a low-lying area from from Srikakulam to Nellore) mainly of agricultural land, (2) the Eastern Ghats, forming a chain of discontinuous range of hills along the coast with good vegetation, and (3) the Deccan Plateau consisting of agricultural lands, scrub, and deciduous forests, which cover part of Kurnool (excl. Nallamalais), Anantapur districts (excl. Nigidi hills), and the major part of Telangana. The total forest cover of the state is 45, 102 km2, which occupies 16.4%
Kurnool Chittoor Nellore Anantapur Adilabad Guntur Prakasham Khammam Medak Cuddapah Nalgonda Warangal Mahabubnagar Karimnagar Nizamabad Krishna East Godavari Visakhapatnam Rangareddy Srikakulam West Godavari Vizianagaram Hyderabad 0 75 150 300
Forest burnt area
(km)
N
Figure 5: Forest burnt areas overlaid on district map of Andhra Pradesh.
There are 27 Protected Areas declared for conservation in Andhra Pradesh, comprising 22 wildlife sanctuaries and 5 national parks. The total area protected for biodiversity is about 12,555 km2or 4.56% of geographical area of Andhra
Pradesh. Nagarjunasagar Srisailam Tiger Reserve is largest tiger reserve of the country, it occupies 28% of the total Protected Area of Andhra Pradesh [19].
2.2. Remote Sensing Data. Indian Remote Sensing Satellite
P6 (ResourseSat-1) AWiFS sensor has spatial resolution of 56 m and radiometric resolution of 10-bit. AWiFS operates
in four spectral bands in the green (0.52–0.59µm), red (0.62– 0.68µm), Near IR (0.77–0.86µm), and Short-Wave IR (1.55– 1.70µm). It has a swath width of 740 km and a revisit period of five days. Cloud free IRS-P6 AWiFS data pertaining to January, February, March, and April 2009 were selected for the study. AWiFS data were geometrically rectified with an average of less than one pixel accuracy using ERDAS Imagine 9.3. Orthorectified Landsat ETM+ datasets were downloaded from Global Land Cover Facility for reference [20]. To reduce the error due to various atmospheric conditions at different dates of image acquisition conversion
0 75 150 300 (km)
Code PA (wildlife Sanctuary/National Park) Protected area
Forest burnt area
N Kawal Pranahita Sivaram Eturnagaram Pakhal Kinnerasani Pocharam Manjira KBR Mrugavani MHV Nagarjunasagar-Srisailam Rollapadu Gundla Brahmeswaram Rajiv Gandhi Sri Lankamalleshwara Peninsula Narasimha Sri Venkateshwara W.L.S. Sri Venkteshwara N.P. Kaundinya Pulicat lake Nelapattu Krishna Kolleru Coringa Papikonda Kambalakonda 1 2 3 4 5 6 7 8 9 10 11 12 13 14 15 16 17 18 19 20 21 22 23 24 25 26 27
Figure 6: Forest burnt areas overlaid on Protected Area map of Andhra Pradesh.
of digital number to Top-of-Atmosphere (TOA) reflectance as suggested by Chavez [21] was followed. The raw digital data were enhanced using contrast stretching and ratio-based techniques to facilitate better discrimination of forest burnt areas and other land cover. The four spectral bands of AWiFS sensor can be used for a different observational task during and after a fire incidence. SWIR, NIR, and Red spectral bands were assigned to respective red, green, and blue gun to highlight source point of active fire (Figure 3). More specifically, fire plumes and burnt areas can be better distinguished in the SWIR spectral channel for detecting high temperature targets. Since 1.65µm in the electromagnetic spectrum is very sensitive to flame and flaming energy and not very sensitive to smoldering and its energy, FCC with the SWIR, NIR, and R combination highlights the active fire pixels. SWIR channel is considered more suitable for identifying hotspots, since the maximum
Planck black body radiance shifts to shorter wavelengths as temperature increases. The usefulness of the SWIR channel has long been recognized for monitoring forest fires [1,13].
2.3. Ancillary Data and Software Packages. The ancillary data
were used for reference from Global Positioning System (GPS), the Survey of India (SOI) topographical sheets of 1 : 50,000 scale, and IRS P6 LISS III image data of December 2003/January 2004. The software packages used were ArcGIS and Erdas Imagine.
2.4. Burnt Area Mapping and Analysis. The vegetation-type
maps are primary inputs for identification of forest fire risk. Vegetation-type map of 1 : 50,000 scale prepared as part of national project of biodiversity characterisation at landscape level was used in the study to understand the distribution of various forest types and to integrate in GIS
01.753.5 7 10.5 (km)
N
(a) Natural Colour Composite image (2-Jan-2009)
01.753.5 7 10.5 (km)
N
(b) False Colour Composite image (7-Mar-2009)
01.753.5 7 10.5 (km)
N
(c) False Colour Composite image (2-Jan-2009)
01.753.5 7 10.5 (km)
N
(d) Natural Colour Composite image (7-Mar-2009)
Figure 7: Multi-temporal IRS P6 AWiFS images of Gundla Brahmeswaram Sanctuary (no fires were observed in (a) and (c); high fire
occurrence noticed in (b) and (d)).
analysis [21]. IRS P6 AWiFS Imagery was classified digitally by the technique of supervised classification using maximum likelihood classifier, with appropriate signatures/training sets for mapping forest burnt areas and land cover categories. The spectral separability and contingency analysis of training sites indicated that burnt pixels were distinct, and more than 96% of the pixels in the training sites were correctly clas-sified. All the nonforest classes, namely, scrub, agriculture, settlement, barren, fallow, and water bodies were masked out using vegetation-type map. Finally, burnt pixels overlaid
on different forest types to assess area under forest fire. The spatial information generated on forest burnt areas was utilized to understand the distribution of fires across the districts, Protected Areas. Fire occurrence analysis was carried out to understand the fire frequency from the forest edge to interior and disturbance sources. The Aster global DEM was used to find out distribution of forest fire across elevation zones [22]. Testing samples have been selected from the reference field data for assessing the classification accuracy.
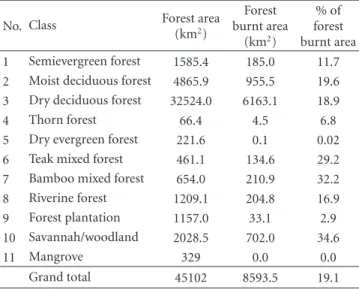
Table 1: Areal extent of forest types and proportion of burnt area
in each forest type of Andhra Pradesh, India.
No. Class Forest area(km2)
Forest burnt area (km2) % of forest burnt area 1 Semievergreen forest 1585.4 185.0 11.7
2 Moist deciduous forest 4865.9 955.5 19.6
3 Dry deciduous forest 32524.0 6163.1 18.9
4 Thorn forest 66.4 4.5 6.8
5 Dry evergreen forest 221.6 0.1 0.02
6 Teak mixed forest 461.1 134.6 29.2
7 Bamboo mixed forest 654.0 210.9 32.2
8 Riverine forest 1209.1 204.8 16.9
9 Forest plantation 1157.0 33.1 2.9
10 Savannah/woodland 2028.5 702.0 34.6
11 Mangrove 329 0.0 0.0
Grand total 45102 8593.5 19.1
3. Results and Discussion
IRS P6 AWiFS False Colour Composite image of Andhra Pradesh was shown inFigure 2. The forest types found in Andhra Pradesh are semievergreen, moist deciduous, dry deciduous, dry evergreen, thorn, teak mixed, bamboo mixed, riverine forest, mangrove, and savannah. Most abundant forest type was dry deciduous forest which comprises 32524 km2 of the total forest area, followed by moist
deciduous forest of 4865.9 km2(Table 1). The forest fires in
Andhra Pradesh are mostly ground fires which are usually confined to the vegetation of the lower canopy destroying shrubs and herbs and also scorch the tree bases. Surface fires are also frequent and associated with ground fires, which burn the shrubs and trees of the middle canopy. The spatial analysis of fire occurrence and extent of forest fires in 2009 was presented below.
3.1. Forest-Type Wise Burnt Area. Table 1 shows the for-est type wise assessment of burnt areas. Almost 19.1% (8593.5 km2) of total forest cover of Andhra Pradesh was
affected by fires during 2009. It was also determined that there have been significant increases of forest burnt area as compared to 2000 (an area of 6369 km2 in 2000 to an
area of 8593.5 km2 in 2009). The net increase of burnt area
of 2224.5 km2 within a decade infers considerable rising
threat to forest environment. All the inland forest types were undergone fire during 2009 (Figure 4). The forest type and species composition are decisive factors in forest fires. Among the different forest types, savannah/woodland undergone a large-scale forest fire which was accounted as 34.6%, followed by bamboo mixed forest (32.2%) and teak mixed forest (29.2%). But, the highest spatial extent of forest fires was noticed in dry deciduous forests and moist deciduous forests. Presently the moist deciduous forests in northern parts of Andhra Pradesh are under threat due to slash and burn agriculture. So, proportionately slightly
0 5 10 15 20 25 30 35 100 500 1000 1500 2000 3000 4000
Distance from forest edge (m)
B
u
rnt ar
ea (%)
Figure 8: Pattern of fire frequency in relation to distance from forest
edges to interior.
more burnt area has been accounted in moist deciduous forests as compared to dry deciduous forests. The study also found dry deciduous forests are more vulnerable to fires than thorn forests. The reason could be thorn forests are receiving very low rainfall and hence insignificant amount of combustible matter is available. About 11.7% of area of semi evergreen forests are also undergone fire indicates conservation threat to high biologically richness areas of Andhra Pradesh. Dry evergreen forests which are distributed in Krishna and Guntur are less affected due to fire. Riverine (riparian) forests are also affected by fire in summer due to drying of streams.
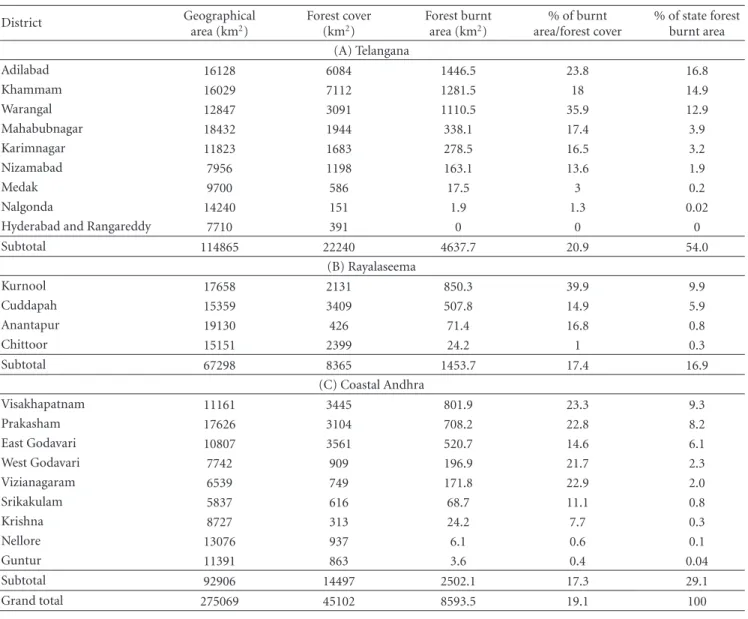
3.2. District Wise Forest Burnt Area. Administratively,
Andhra Pradesh has 23 districts which were grouped into three zones: (1) Coastal Andhra, (2) Rayalaseema, (3) Telan-gana. On the whole, forest burnt area in Telangana region was very high (4637.7 km2), followed by Coastal Andhra
(2502.1 km2) and Rayalaseema (1453.7 km2). As compared
to Rayalaseema region, Telangana receives moderately high rainfall, but represents more forest fires reveals severe anthropogenic pressure (Figure 5). Among the 23 districts, Adilabad, Khammam, Warangal, Kurnool, Visakhapatnam, Vizianagaram, and Prakasham were evidenced with large-scale fires (Table 2). Of the total forest burnt area at state level, Adilabad, Khammam, and Warangal are repre-senting highest area and estimated as 16.8%, 14.9%, and 12.9%, respectively. According the proportionate burnt area with reference to forest cover, Kurnool was affected by more fire (39.9%) followed by Warangal (35.9%), Adilabad (23.8%), Visakhapatnam (23.3%), Vizianagaram (22.9%), and Prakasham (22.8%).
3.3. Protected Area Wise Forest Burnt Area. Taking into
account the wildlife sanctuaries and national parks, the total area affected by forest fires during 2009 are 2680.5 km2
(23.6%). Of the 11 Protected Areas in Eastern Ghats, Papikonda wildlife sanctuary and Gundla Brahmeswaram wildlife sanctuary were affected 49.4% and 41.7% of
Table 2: Region- and district-wise forest burnt area statistics of Andhra Pradesh: 2009. District Geographical area (km2) Forest cover (km2) Forest burnt area (km2) % of burnt area/forest cover % of state forest burnt area (A) Telangana Adilabad 16128 6084 1446.5 23.8 16.8 Khammam 16029 7112 1281.5 18 14.9 Warangal 12847 3091 1110.5 35.9 12.9 Mahabubnagar 18432 1944 338.1 17.4 3.9 Karimnagar 11823 1683 278.5 16.5 3.2 Nizamabad 7956 1198 163.1 13.6 1.9 Medak 9700 586 17.5 3 0.2 Nalgonda 14240 151 1.9 1.3 0.02
Hyderabad and Rangareddy 7710 391 0 0 0
Subtotal 114865 22240 4637.7 20.9 54.0 (B) Rayalaseema Kurnool 17658 2131 850.3 39.9 9.9 Cuddapah 15359 3409 507.8 14.9 5.9 Anantapur 19130 426 71.4 16.8 0.8 Chittoor 15151 2399 24.2 1 0.3 Subtotal 67298 8365 1453.7 17.4 16.9 (C) Coastal Andhra Visakhapatnam 11161 3445 801.9 23.3 9.3 Prakasham 17626 3104 708.2 22.8 8.2 East Godavari 10807 3561 520.7 14.6 6.1 West Godavari 7742 909 196.9 21.7 2.3 Vizianagaram 6539 749 171.8 22.9 2.0 Srikakulam 5837 616 68.7 11.1 0.8 Krishna 8727 313 24.2 7.7 0.3 Nellore 13076 937 6.1 0.6 0.1 Guntur 11391 863 3.6 0.4 0.04 Subtotal 92906 14497 2502.1 17.3 29.1 Grand total 275069 45102 8593.5 19.1 100
area, respectively. Nagarjunasagar Srisailam Tiger Reserve is largest tiger reserve in India, shows 792.5 km2 (22.2%)
area under forest fire (Figures 5, 6, and 7). Of the eight wildlife sanctuaries in Deccan Plateau (Telangana), Kawal, Eturnagaram, and Kinnersani were affected by more fires. The forest fires were not noticed in small Protected Areas that is, Rollapadu sanctuary, Rajiv Gandhi national park, Kambalakonda sanctuary, Manjira sanctuary, KBR national park, Mrugavani national park, and MHV national park during 2009. It is attributed to stringent conservation measures. But these seven Protected Areas contribute to about 1% of total Protected Area network of Andhra Pradesh (Table 3). Prescribed fire is an important tool for managing habitats and the wildlife populations. Tender shoots from resprouting saplings and shrubs are highly nutritious and attract many herbivores. But uncontrolled fires in tiger reserve and other protected areas can have extreme effects on native biodiversity and may provide an opportunity to invasive alien species to colonise.
3.4. Elevation Zone Wise Forest Burnt Area. Forest fire
occur-rence was analysed across elevation (altitudinal) gradient (Table 4). Forest fires were very high in elevation range of above 1200 m, which mostly represents savannah/woodland ecosystems. The low elevation (<200 m) forests of Chittoor, Nellore, Krishna, Guntur, and Srikakulam were affected by less fire occurrence as compared to elevation zone of 200–600 m. The areas with southern aspect and high slope (>30%) were found to be more sensitive for fire spread.
3.5. Forest Burnt Area Patches. The numbers of burnt area
patches are found to be 9592. Forest burnt area patches of different size categories were analysed (Table 5). Patch size analysis of forest burnt areas revealed the information that the maximum number (6601) of burnt area patches are under 25 ha. Interestingly the burnt area class of >400 ha shows 5545.3 km2 (64.5%) of total burnt area followed by <25 ha class with representation of 741.1 km2(8.6%) of area.
Table 3: Areal extent of forest burnt areas in Protected Areas of Andhra Pradesh.
No. Protected Area Area (km2) Forest burnt area (km2) % of forest burnt area
(I) Eastern Ghats region
1 Nagarjunasagar Srisailam Tiger Reserve 3568 792.5 22.2
2 Gundla Brahmeswaram 1194 497.8 41.7
3 Rollapadu 6.14 0.0 0.0
4 Rajiv Gandhi national park 2.3 0.0 0.0
5 Peninsula Narasimha 1030.85 28.1 2.7
6 Sri Lankamalleshwara 464.42 73.1 15.7
7 and 8 S.V. Wildlife sanctuary and national park 525.97 1.5 0.3
9 Kaundinya 357.6 17.0 4.7
10 Papikonda 591.4 291.9 49.4
11 Kambalakonda 70.7 0.0 0.0
Subtotal 7811.38 1701.8 21.8
(II) Deccan Plateau region
1 Kawal 893 375.9 42.1 2 Pranahita 136.02 1.5 1.1 3 Sivaram 29.81 2.1 7.1 4 Kinnerasani 635.4 179.3 28.2 5 Eturnagaram 803 279.4 34.8 6 Pakhal 860.2 140.2 16.3 7 Manjira 20 0.0 0.0 8 Pocharam 129.8 0.3 0.3 9 KBR national park 1.425 0.0 0.0
10 Mrugavani national park 3.6 0.0 0.0
11 MHV National Park 14.59 0.0 0.0
Subtotal 3526.89 978.7 27.8
Grand total 11338.27 2680.5 23.6
Table 4: Areal extent of forest burnt area across elevation zones.
Sl. no. Elevation zone (m) Forest area (km2) Forest burnt area (km2) % of burnt area 1 <200 9673.6 1137.7 11.8 2 201–400 15023.5 3477.7 23.1 3 401–600 12947.7 2522.8 19.5 4 601–800 5002.0 935.8 18.7 5 801–1000 1482.1 241.1 16.3 6 1001–1200 713.9 172.1 24.1 7 1201–1400 225.2 90.6 40.2 8 1401–1527 34.0 15.7 46.1 Grand total 45102 8593.5 19.1
3.6. Correlation of Fire Frequency to Forest Edge and Settle-ments. GIS analysis of fire frequency from the forest edge
to interior and disturbance sources (settlements) reveals fires were prevalent in edge forests as compared to core forests. Fire frequency was very high at a distance of 500 m from forest edge (Figure 8) which fell down to nearly zero percentage of burnt area by 4000 m. This could be attributed to man made activities outside their settlement areas, and in general anthropogenic origin forest fire in the state.
Table 5: Size class distribution of forest burnt areas in Andhra
Pradesh. Sl. no.
Burnt area patch size (ha.)
No. of patches Area (km2) % of patches % of burnt area 1 <25 6601 741.1 68.8 8.6 2 26–50 1291 462.5 13.5 5.4 3 51–100 728 513.7 7.6 6.0 4 101–200 446 621.7 4.6 7.2 5 201–300 167 413.7 1.7 4.8 6 301–400 85 295.5 0.9 3.4 7 >400 274 5545.3 2.9 64.5 Grand total 9592 8593.5 100 100
Using random statistics techniques, overall classification accuracy and kappa statistics were computed. The result shows an overall accuracy of classified map is 92.1% and kappa statistics is 0.91.
4. Conclusion
Assessment of forest fire using satellite remote sensing indicates that about one fifth of the state’s forest was under burnt area in the year of 2009. Deccan plateau and Eastern
Ghats were the most affected phytogeographic regions in the state. Smaller protected areas were less vulnerable in comparison with larger ones attributed to the effective management existing with the small areas. Higher elevation savannahs and woodlands experienced prevalent forest fire in comparison with lower elevation areas. The study developed a forest burnt area map using remote sensing data for the conservation planning of forests in general and protected areas in particular. Spatial information generated in the present work is useful for effective forest management and ecological damage assessment.
Acknowledgments
The authors are thankful to Dr. V. Jayaraman, Former Direc-tor, NRSC, Hyderabad, Dr. V. K. Dadhwal, DirecDirec-tor, NRSC, Hyderabad, and Dr. P. S. Roy, Director, IIRS, Dehradun for suggestions and encouragement. The work has been carried out under the national Biodiversity characterization project of Department of Space and Department of Biotechnology, Government of India.
References
[1] S. Joseph, K. Anitha, and M. S. R. Murthy, “Forest fire in India: a review of the knowledge base,” Journal of Forest Research, vol. 14, no. 3, pp. 127–134, 2009.
[2] A. R. Holdsworth and C. Uhl, “Fire in Amazonian selectively logged rain forest and the potential for fire reduction,” Ecological Applications, vol. 7, no. 2, pp. 713–725, 1997. [3] FAO, 2003,http://www.fao.org/english/newsroom/news/2003/
21962-en.html.
[4] T. P. Dawson, N. Butt, and F. Miller, “The ecology of forest fires,” ASEAN Biodiversity, vol. 1, pp. 18–21, 2002.
[5] J. P. Puyravaud, J. P. Pascal, and C. Dufour, “Ecotone structure as an indicator of changing forest-savanna boundaries (Lin-ganamakki Region, southern India),” Journal of Biogeography, vol. 21, no. 6, pp. 581–593, 1994.
[6] M. Gadgil and V. M. Meher-Homji, “Land use and productive potential of Indian Savannas,” in Ecology and Management of the World’s Savannas, J. C. Tothill and J. J. Mott, Eds., pp. 107–113, Australian Academy of Science, Canberra, Australia, 1985.
[7] W. Schule, “Landscapes and climate in prehistory: interactions of wildlife, man, and fire,” in Fire in the Tropical Biota: Ecosystem Processes and Global Challenges, J. G. Goldammer, Ed., vol. 84 of Ecological Studies, pp. 273–318, Springer, Berlin, Germany, 1990.
[8] V. K. Bahuguna and S. Singh, “Fire situation in India,” International Forest Fire News, vol. 26, pp. 23–27, 2002. [9] K. Narendran, “Forest fires—origins and ecological
para-doxes,” Resonance, pp. 34–41, 2001.
[10] S. Saha, “Anthropogenic fire regime in a deciduous forest of central India,” Current Science, vol. 82, no. 9, pp. 1144–1147, 2002.
[11] R. H. Beddome, “The Jeypore forests,” Indian Forester, vol. 3, pp. 188–205, 1878.
[12] D. Brandis, “The forests of South India,” Indian Forester, vol. 7, pp. 363–369, 1882.
[13] NRSA, “Perspectives of geoinformatics in forest fire manage-ment (Indian Forest Fire Response and Assessmanage-ment System),”
Tech. Rep., National Remote Sensing Agency, Hyderabad, India, 2006.
[14] M. Marchetti and C. Ricotta, “Monitoraggio. Contributo del telerilevamento,” in Incendi e complessit Ecosistemica: Dalla pianificazione forestale Al Recupero Ambientale, C. Blasi, G. Bovio, P. Corona, M. Marchetti, and A. Maturani, Eds., pp. 220–225, Ministero dellAmbiente e della Tutela del Territorio, Societa Botanica Italiana, Accademia Italiana di Scienze Forestali, Rome, Italy, 2004.
[15] A. J. Hiremath and B. Sundaram, “The fire-Lantana cycle hypothesis in Indian forests,” Conservation and Society, vol. 3, pp. 26–42, 2005.
[16] J. G. Goldammer and C. de Ronde, Wild Land Fire Man-agement Handbook for Sub—Sahara Africa, Oneworldbooks, Cape Town, South Africa, 2004.
[17] A. Giriraj, B. Shilpa, A. Jentsch, S. Sudhakar, and M. S. R. Murthy, “Tracking fires in India using advanced along track scanning radiometer (A)ATSR data,” Remote Sensing, vol. 2, pp. 591–610, 2010.
[18] V. K. Prasad, K. V. S. Badarinath, and E. Anuradha, “Biophys-ical and anthropogenic controls of forest fires in the Deccan Plateau, India,” Journal of Environmental Management, vol. 86, no. 1, pp. 1–13, 2008.
[19] C. S. Reddy, G. S. Pujar, S. Sudhakar et al., “Mapping the vege-tation types of Andhra Pradesh, India using Remote Sensing,” in Proceedings of the Andhra Pradesh Akademi of Sciences, vol. 12, pp. 14–23, 2008.
[20] 2009,http://glcf.umiacs.umd.edu/.
[21] P. S. Chavez, “Image-based atmospheric corrections—revisit-ed and improvcorrections—revisit-ed,” Photogrammetric Engineering and Remote Sensing, vol. 62, no. 9, pp. 1025–1036, 1996.
Submit your manuscripts at
http://www.hindawi.com
Forestry Research
International Journal of Hindawi Publishing Corporationhttp://www.hindawi.com Volume 2014
Hindawi Publishing Corporation
http://www.hindawi.com Volume 2014
Hindawi Publishing Corporation
http://www.hindawi.com Volume 2014
Ecosystems
Journal ofHindawi Publishing Corporation
http://www.hindawi.com Volume 2014
Meteorology
Advances inHindawi Publishing Corporation
http://www.hindawi.com Volume 2014
Marine Biology
Journal of Hindawi Publishing Corporationhttp://www.hindawi.com Volume 2014
Hindawi Publishing Corporation http://www.hindawi.com
Applied &
Environmental
Soil Science
Volume 2014 Advances inHindawi Publishing Corporation
http://www.hindawi.com Volume 2014
Environmental Chemistry Atmospheric Sciences
International Journal of
Hindawi Publishing Corporation
http://www.hindawi.com Volume 2014
Hindawi Publishing Corporation
http://www.hindawi.com Volume 2014
Hindawi Publishing Corporation
http://www.hindawi.com Volume 2014
International Journal of
Geophysics
Hindawi Publishing Corporationhttp://www.hindawi.com Volume 2014 Geological ResearchJournal of
Earthquakes
Journal ofHindawi Publishing Corporation
http://www.hindawi.com Volume 2014
Biodiversity
International Journal ofHindawi Publishing Corporation
http://www.hindawi.com Volume 2014
Scientifica
Hindawi Publishing Corporationhttp://www.hindawi.com Volume 2014
Oceanography
International Journal ofHindawi Publishing Corporation
http://www.hindawi.com Volume 2014
The Scientific
World Journal
Hindawi Publishing Corporation
http://www.hindawi.com Volume 2014
Journal of Computational Environmental Sciences Hindawi Publishing Corporation
http://www.hindawi.com Volume 2014
Hindawi Publishing Corporation
http://www.hindawi.com Volume 2014