Syddansk Universitet
SuperQuant
a Data Processing Approach to Increase Quantitative Proteome Coverage
Gorshkov, Vladimir; Braga, Thiago Verano; Kjeldsen, Frank
Published in: Analytical Chemistry DOI: 10.1021/acs.analchem.5b01166 Publication date: 2015 Document version
Publisher's PDF, also known as Version of record
Citation for pulished version (APA):
Gorshkov, V., Verano-Braga, T., & Kjeldsen, F. (2015). SuperQuant: a Data Processing Approach to Increase Quantitative Proteome Coverage. Analytical Chemistry, 87(12), 6319–6327. DOI:
10.1021/acs.analchem.5b01166
General rights
Copyright and moral rights for the publications made accessible in the public portal are retained by the authors and/or other copyright owners and it is a condition of accessing publications that users recognise and abide by the legal requirements associated with these rights. • Users may download and print one copy of any publication from the public portal for the purpose of private study or research. • You may not further distribute the material or use it for any profit-making activity or commercial gain
• You may freely distribute the URL identifying the publication in the public portal ?
Take down policy
If you believe that this document breaches copyright please contact us providing details, and we will remove access to the work immediately and investigate your claim.
SuperQuant: A Data Processing Approach to Increase Quantitative
Proteome Coverage
Vladimir Gorshkov,*
,†Thiago Verano-Braga,
†and Frank Kjeldsen*
Department of Biochemistry and Molecular Biology, University of Southern Denmark, Campusvej 55, 5230 Odense M, Denmark
*
S Supporting InformationABSTRACT: SuperQuant is a quantitative proteomics data processing approach that uses complementary fragment ions to identify multiple coisolated peptides in tandem mass spectra allowing for their quantification. This approach can be applied to any shotgun proteomics data set acquired with high mass accuracy for quantification at the MS1
level. The SuperQuant approach was developed and implemented as a processing node within the Thermo Proteome Discoverer 2.x. The performance of the developed approach was tested using
dimethyl-labeled HeLa lysate samples having a ratio between channels of 10(heavy):4(medium):1(light). Peptides were fragmented with collision-induced dissociation using isolation windows of 1, 2, and 4 Th while recording data both with high-resolution and low-resolution. The results obtained using SuperQuant were compared to those using the conventional ion trap-based approach (low mass accuracy MS2 spectra), which is known to achieve high identification performance. Compared to the common high-resolution approach, the SuperQuant approach identifies up to 70% more peptide−spectrum matches (PSMs), 40% more peptides, and 20% more proteins at the 0.01 FDR level. It identifies more PSMs and peptides than the ion trap-based approach. Improvements in identifications resulted in up to 10% more PSMs, 15% more peptides, and 10% more proteins quantified on the same raw data. The developed approach does not affect the accuracy of the quantification and observed coefficients of variation between replicates of the same proteins were close to the values typical for other precursor ion-based quantification methods. The raw data is deposited to ProteomeXchange (PXD001907). The developed node is available for testing at https://github. com/caetera/SuperQuantNode.
M
ass spectrometry-based proteomics is the leading method in qualitative and quantitative investigation of biological systems, and the most commonly used approach is shotgun proteomics.1 Briefly, proteins are extracted from the biological matrix of interest (tissue, cell culture, organelle, etc.) and digested by one or more proteolytic enzymes. The peptide mixture obtained is separated by HPLC and analyzed by tandem mass spectrometry (MS/MS). The resulting fragmen-tation spectra are processed with dedicated software that accesses protein databases to identify and quantify peptides present in the sample.Typical shotgun proteomics experiments address several thousand proteins and result in tens or even hundreds of thousands of peptides presenting in the sample.2,3 Common proteomics methodologies use fractionation before LC-MS/MS analysis to reduce peptide complexity and obtain the deepest possible coverage of the proteome.4−6 However, this is labor intensive, requires a lot of time, and increases the possibility of introducing experimental errors and loss of sample.6 An important challenge for shotgun proteomics is the high frequency of precursor ion coisolation in the MS/MS event. Progress in increasing the sensitivity and speed of MS instrumentation allows deeper investigation of peptide mixtures, thus making this problem increasingly relevant. Recent studies show that approximately 50% of all fragmentation spectra suffer from coisolation of precursor ions.3,7−10Moreover, the recent trend in shotgun proteomics is
to obtain complete or near complete quantitative and qualitative proteome coverage quickly (e.g., hours) in one experiment.11−13 Hence, single-shot proteome analysis lowers operation costs, instrument operation time, and is easier to apply in an automated, nonattendant way.12It inevitably leads, however, to increased complexity of the peptide sample, thus forcing more precursor ion coisolation events to occur. Fragmentation spectra originating from coisolated precursor ions, also referred to as“chimera spectra”or“mixture spectra”, reduce the chance of the correct identification of the target peptide and hence lower the identification success rate by lowering the confidence score threshold.7
There are several methods for extracting quantitative information from mass spectrometry data. Most of these aims to provide relative quantification (e.g., observe the change in the amount of proteins or peptides between different states of the same biological system or between the samples). The dominant approaches of quantitative proteomics are divided into two major directions, with measurements of the abundances in the MS spectrum versus the MS/MS spectrum. The most widely used methods of MS/MS spectra-based quantitation are iTRAQ14 and TMT15 isotopic labeling. The Received: March 27, 2015
Accepted: May 15, 2015 Published: May 15, 2015
Article
pubs.acs.org/ac copying and redistribution of the article or any adaptations for non-commercial purposes.
relative abundances of MS/MS reporter ions are used to derive peptide abundances. In the chimera spectra, reporter ions from all precursors will overlap, leading to inaccurate estimation of abundance ratios between samples. This effect is most pronounced for ratios close to 1:1. Possible ways to circumvent this effect include the use of additional MS3fragmentation16or correction coefficients calculated using spiked-in-proteins.17 The MS1 spectrum-based methods use abundances of the parent ion isotopic envelopes in survey MS1 spectra as a
representative for peptide levels. The most well-known methods of this type are SILAC18and dimethyl labeling,19,20 and label-free methods can be assigned to the same category. This isotopic labeling strategy does not suffer from inaccuracy in reporter ion abundances. Unfortunately, the extensive coisolation of multiple peptides in the MS/MS event inevitably results in many unassigned peptide identifications and quantification of unknown peptide species has limited analytical value. In the presence of peptide coisolation, several over-lapping peak envelopes can be observed in the survey MS1
spectrum. Parent mass and ion abundance can be assigned to each of them, however, only a few proteomic tools can account for these cases.9 Moreover, most of them are able to identify and later quantify only one additional peptide after successful identification of the target peptide.21−23
As shown earlier,24,25 the mass relationship between complementary fragment ions can be used to deconvolute mixture spectra. Because complementary fragment ions can be used to derive individual and unique peptide parent masses, this information can be used to select the corresponding peak envelope from the parent mass spectrum to obtain individual quantitative values. In this study, we took advantage of this possibility and demonstrated how complementary fragment ions allow assessment of quantitative information in MS1scans.
The software employing this concept was developed and thoroughly tested for its applicability to obtain biologically relevant data using a HeLa cell lysate.
■
MATERIALS AND METHODSReagents.If not explicitly stated, all common solutions and reagents were purchased from Sigma-Aldrich and were of HPLC grade or proteomics grade (when applicable).
Cell Culture. Human cervix epithelial adenocarcinoma (HeLa) cells were cultured in 15 cm cell culture dishes in Dulbecco’s Modified Eagle Medium (DMEM) with Glutamax media supplemented with 10% fetal bovine serum (FBS) and 1% penicillin/streptomycin. Cells were harvested at 90%−95% confluency by scraping them off the plate followed by centrifugation. Pellets were stored at −80 °C until further analysis.
Protein Digestion.Cells were lysed and proteins were
on-filter digested as previously published.26Briefly, HeLa cells were lysed with a solution of 2% (w/v) sodium dodecyl sulfate (SDS), 20 mmol/L triethylammonium bicarbonate (TEAB), 0.1 mol/L dithiothreitol (DTT), phosphatase (PhosSTOP, Roche, Switzerland), and protease inhibitors (cOmplete, Roche, Switzerland). Lysis was enhanced and DNA filaments sheared with tip sonication on ice. Protein concentration was measured using Qubit assay (Thermo Fisher Scientific, USA). Proteins were loaded onto spin-filter units (Vivacon 500, 30000 MWCO; Vivaproducts, USA), and the SDS-containing solution was washed out using an urea-containing solution (8 mol/L urea, 20 mmol/L TEAB. Two protein loadings of 75μL each (600μg onfilter) were used, 300μL of urea solution were used
for washing after each loading followed by two washes with 200 μL of urea, and two washes with 375μL of 1% (w/v) sodium deoxycholate (SDC), 20 mmol/L TEAB after both loadings. Alkylation of the reduced thiol groups was done with 50 mmol/ L iodoacetamide, 1% (w/v) SDC, and 20 mmol/L TEAB (300 μL of solution, followed by two times wash with 300μL of 1% (w/v) SDC, 20 mmol/L TEAB), and proteins were digested overnight with trypsin (1:100) (Promega, USA) in 1% (w/v) SDC, 20 mmol/L TEAB. Peptides were collected after centrifugation, and SDC was removed using ethyl acetate and TFA (0.5% (v/v)final concentration).
Dimethyl Labeling. Dimethyl labeling was performed according to a published protocol.27Briefly, 25 μg of peptides per labeling channel were dissolved in 100 μL of 0.1 mol/L TEAB. The peptide amount was measured by amino acid analysis (Biocrom 30, Biochrom, UK). Next, 4μL of 4% (v/v) solution of CH2O, CD2O, or 13CD
2O were added, and the
samples were vortexed. Following, 4 μL of 0.6 mol/L NaBH3CN or NaBD3CN were added and the mixture was incubated for 75 min at room temperature. The efficiency of labeling was monitored by HPLC-MS before quenching the reaction. The reaction was quenched by adding 16 μL of 1% (v/v) ammonia solution followed by 8μL of 5% (v/v) formic acid. Next, the three channels were mixed in a 10:4:1 (light:medium:heavy) ratio. The samples were completely dried in a SpeedVac and stored at−20 °C until analyzed by LC-MS.
LC-MS. Peptides were separated using a Dionex (now Thermo, USA) Ultimate 3000 nanoUPLC system, coupled to a Thermo Orbitrap Fusion mass spectrometer. Peptides were focused on the precolumn (PepMap C18 10 cm×150μm i.d., 5 μm; Thermo, USA) and eluted from the analytical column (PepMap C18 50 cm×75μm i.d., 3μm; Thermo, USA) with the gradient presented in Table 1. The mass spectrometer was
configured to continuously fragment peptide precursor ions for 3 s (top speed mode) between each MS1 scan. MS1 spectra
were recorded in the Orbitrap mass analyzer from 400 to 1200 Th, with 120000 resolution at 200 Th, automated gain control (AGC) target value 5×10⁵, maximum accumulation time 60 ms. Ions were isolated using a quadrupole massfilter with 1, 2, and 4 Th wide isolation windows and fragmented using collision-induced dissociation (CID) in the linear ion trap. MS/ MS spectra were acquired with Orbitrap detection with 15000 resolution at 200 Th, AGC target 1 × 10⁴, maximum
accumulation time 40 ms (referenced as OT-OT technique). For comparison, Orbitrap−ion trap mode (OT-IT technique) was used. CID spectra were recorded in the linear ion trap using “Rapid” settings, AGC target value 5 ×10³, maximum
accumulation time 35 ms, and 2 Th isolation window.
Proteome Discoverer Nodes Development. An algo-rithm for identification and extraction of coisolated peptide fragments was implemented in C# (Visual C# 2013, .NET Framework 4.5.50938) and compiled as a node for Proteome Discoverer 2.x (ComplementaryFinder node). The core idea of the algorithm was published previously;24 however, the new Table 1. HPLC Gradient Used for the Analysisa
time (min)
0 5 25 205 245 270 285 287 300
B (%) 2 2 5 21 35 99 99 2 2
aA: 0.1% formic acid. B: 80% acetonitrile in 0.1% formic acid.
Analytical Chemistry Article
DOI: 10.1021/acs.analchem.5b01166
Anal. Chem.2015, 87, 6319−6327 6320
version has important improvements. The code was fully rewritten to accommodate implementation in Proteome Discoverer and to increase stability and performance. Implementing ComplementaryFinder into Proteome Discov-erer allows users to apply a variety of other processing tools and have the support of more input/output formats. The following new features were added: relative coisolation window borders, selective extraction of primary and secondary spectra, exclusion masses, and secondary mass spectra verification by survey MS1
scan. The explanation of the new parameters is presented in the Results and Discussion. An algorithm for deconvolution of mass spectra to singly charged fragment spectra was implemented in a similar manner; details of applied processing are described in the Results and Discussion. Microsoft Visual Studio Professional 2013 (v 12.0.30501.00 Update 2) was used as an integrated development environment. The developed node is available for testing at https://github.com/caetera/ SuperQuantNode.
Data Analysis.Data analysis was performed using Thermo Proteome Discoverer 2.0.0.673. Mascot 2.3 was used as the database search engine. SwissProt database (2014.04) restricted toHomo sapiens (20340 protein sequences) combined with a common contaminants database (231 protein sequences) was used. Search parameters for the OT-OT technique were: parent ion mass tolerance, 5 ppm; fragment ion mass tolerance, 0.02 Th;fixed modifications, carbamidomethylated cysteine; variable modifications, oxidized methionine and labeled N-terminal and lysine. For the OT-IT technique, fragment ion mass tolerance was set to 0.5 Th, while other parameters were the same. Reversed decoy database was searched separately. For Super-Quant analysis, all MS2 spectra were processed using
home-built deconvolution node to produce fragmentation spectra consisting only of singly charged fragments. Next, deconvoluted spectra were processed with ComplementaryFinder node before database search. Database search results were evaluated using Percolator 2.0528with standard parameters. All peptide− spectrum matches (PSMs) with q-value <0.01 were grouped together by the same sequence and theoretical mass and the highest Percolator SVM score was used as the score for the group. Qvality 2.0529was used for the estimation ofq-value on the PSM group level; PSM groups were filtered by q-value <0.01. Each PSM group gives rise to one peptide. Proteins related to the filtered peptides were grouped using the maximum parsimony principle. No FDR filters were applied at the protein level. Quantification of peptides and proteins was performed using standard settings provided by Proteome Discoverer. Quantification was based on extracted ion chromatograms. Allowed mass deviation in consecutive scans, 6 ppm; retention time tolerance of isotopic multiplets, 0.2 min; minimum signal-to-noise ratio for peaks to be considered for quantification, 1. Mass spectrometric data were deposited to the ProteomeXchange Consortium (http://proteomecentral. proteomexchange.org) via the PRIDE30 partner repository (PXD001907).
■
RESULTS AND DISCUSSIONIdentification Performance of SuperQuant. The first operation of SuperQuant is to employ complementary ion information to improve the quality and number of PSMs during database search and identify cofragmented peptides originating from different precursors. Next, quantitative information for each PSM is extracted to increase the quantified coverage of complex proteomes. To thoroughly test and optimize our
approach, we performed dimethyl labeling of equal amounts of HeLa cell lysate using light, medium, and heavy versions of the labeling reagent. Labeled samples were mixed in 10:4:1 (L:M:H) ratio and analyzed together without prefractionation. Effort was made to balance the peptide elution from the column by compressing the regions of highly hydrophilic and more hydrophobic peptides, the latter being usually less populated than the other regions. The final HPLC gradient profile consisted of three linear gradient regions with different slopes (Table 1): a steep initial gradient was followed by a long and gentle gradient of 5−21% buffer B over 180 min, which was followed by a sharp increase to 35% buffer B.
The width of the isolation window affects the occurrence of precursor ion coisolation. The mainstream principle in shotgun proteomics is to shrink the width as much as possible to minimize the frequency of coisolation. Recently, Hebert et al.11 used a 0.7 Th isolation window for a full yeast proteome analysis while the instrument itself was shown to be efficient even with an isolation window of 0.4 Th. However, the complexity of the sample analyzed in a typical shotgun experiment is too great to avoid peptide coisolation with any reasonable isolation window.31It is now well recognized that theone spectrum =one peptide assumption should be critically revisited.8,32 To test the ability of our approach to solve the coisolation challenge, we analyzed labeled HeLa sample using isolation windows of 1, 2, and 4 Th (each one in triplicate). Each run was analyzed using standard and SuperQuant approaches (see Materials and Methods). With the SuperQuant approach, fragmentation spectra were deconvoluted to the singly charged state, and all peaks that could not be assigned to any charge state according to the isotopic pattern were transferred to the deconvoluted spectra with charge state 1+. ComplementaryFinder node (part of the SuperQuant ap-proach) was applied with the following parameters. The allowed mass range for coisolated precursors (coisolation window) was set 0.6 Th wider on the lower border than the isolation window (e.g., for the isolation window 500−501 Th, the corresponding range of allowed coisolated masses was 499.4−501 Th). This border selection was applied to accommodate 2+ ions presented at the lower border of the isolation window if only thefirst isotopic peak was coisolated. Expected charge states for coisolated ions were 2+, 3+, and 4+, which covers typical charge states for tryptic peptides. All reconstructed (b−y pairs) peptide masses were grouped with a 5 ppm window (e.g., masses having absolute differences less than 5 ppm are considered to belong to the same peptide), and the abundance weighted average (∑jMj×Ij/∑jIj, whereMj=
mass,Ij= corresponding abundance) of all masses in the group
was used as thefinal estimation of the peptide mass. Each mass supported by at least six ions (three complementary ion pairs) was considered to represent a coisolated peptide. Ion peaks supporting this mass were used to generate virtual secondary spectra (extracted). No minimum restrictions were applied to the number of complementary pairs supporting the targeted mass. The spectrum corresponding to it was termed“primary spectrum” and always added to the result. All ions having absolute mass differences less than 10 ppm from the masses of immonium ions formed from 20 common amino acids were excluded from the list of possible complementary pair members. Ions that were not satisfying the complementary rules were added to each resulting spectrum. Finally, peaks corresponding to complementary pairs were intensified (the Analytical Chemistry
abundance of both ions in a pair was increased by the abundance of the basepeak).
The numbers of PSMs, peptides, and proteins identified in labeled HeLa samples are provided in Table 2. For a standard approach (i.e., with standard processing), the best performance was obtained using the 1 Th isolation window even though the abundance of the isolated parent ions might be hampered by the narrow isolation window. Notably, even with the 1 Th isolation window, approximately one additional spectrum was generated for every three recorded spectra, indicating that coisolation was frequent even at narrow isolation settings. For wider isolation windows (4 Th), the number of generated virtual secondary spectra increased, reaching approximately 20 times multiplication in one of the replicates. Such a high multiplication factor could indicate that each isolated spectrum was more complex and contained multiple coisolated peptides or that the data were compromised with many low-quality secondary spectra generated from noise peaks or random events. The average number of peaks per spectrum supplied for ComplementaryFinder node (after deconvolution) was 50, 84, and 150 peaks for 1, 2, and 4 Th isolation windows, respectively. The probability of finding coisolated peptide purely by chance is proportional to the squared number of peaks in the spectra; therefore, it was approximately nine times higher for 4 Th than for 1 Th. This assumption was supported by the lower success rate (fraction of spectra that have PSM assigned) observed for 4 Th samples. Overall, the success rates for all SuperQuant analyses were lower than those for the standard processing, indicating that the quality of virtual secondary spectra might be lower. Such a reduction in the identification rate was expected because SuperQuant processing results in the inclusion of many low-abundance spectra; however, the overall number of identified PSMs, peptides, and proteins was larger. It should be noted that we used high throughput parameters for MS/MS data acquisition (AGC target 1 × 10⁴) and, therefore, the typical number of ions collected to generate the target and secondary product spectra was small. Most of the ion current in the isolation window was expected to be determined by the targeted precursor ion, thus,
as a consequence of the AGC target value, ion statistics for coisolated peptides were poorer than for the targeted peptide. Two different formulas were used to calculate the number of PSMs, peptides and proteins identified in the combined samples of the replicates. Because correct alignment of PSMs across different replicates is difficult to assess, the correspond-ing results are the sum of those for individual samples (e.g., 1Th = 1Th-1 + 1Th-2 + 1Th-3). Conversely, it is straightforward to align the same peptide or protein across all samples, thus a rollup was performed using the sequence, including all modifications, as the unique identifier of peptide and the full name of the protein as its unique identifier. In Table 2, the number of identified proteins and peptides in the combined samples were less than the sum of each individual sample; moreover, the relative improvement for the combined sample was higher than the average improvement for individual samples, which is typical for data-dependent acquisition.
The bottom of Table 2 contains the number of PSMs, peptides, and proteins identified using Orbitrap detection in survey scans and ion trap detection in MS/MS scans (OT-IT). The SuperQuant approach could not be applied for this data because it requires high mass accuracy fragmentation spectra and hence the corresponding columns are empty. The use of ion trap detection is recommended for Orbitrap Fusion by the manufacturer because it allows efficient parallelization of survey and product ion scans, maximizes the utilization of all instrument parts, and is shown to deliver the highest performance.33 Thus, it is important to compare the OT-IT technique with the SuperQuant approach. Comparison of the OT-IT against OT-OT technique using standard processing shows that the former technique has lower success rate. This observation was expected because ion trap spectra have lower spectral quality. Despite this lower spectral quality, the numbers of identified PSMs, peptides, and proteins are higher than for the standard processing approach. By contrast, SuperQuant outperforms the OT-IT technique in identified PSMs and peptides for all tested parameters, but the number of identified proteins was slightly higher for OT-IT. It is worth mentioning that the SuperQuant processing results in a higher number of identifications and provides on average higher quality spectra Table 2. Identified PSMs, Peptides, and Proteins in HeLa 10:4:1 Samplea
MS2spectra PSMs peptides proteins
sample Std SQ Mult. Std SQ Diff(%) Std SQ Diff(%) Std SQ Diff(%) 1Th-1 139963 182916 1.31 50472 (0.36) 63976 (0.33) +26.76 39207 45156 +15.17 4403 4617 +4.86 1Th-2 140709 176661 1.26 48677 (0.35) 59221 (0.32) +21.66 38421 43424 +13.02 4385 4518 +3.03 1Th-3 140865 211530 1.50 53216 (0.38) 69270 (0.30) +30.17 39855 46506 +16.69 4330 4657 +7.55 1Th 421537 571107 1.35 152365 (0.36) 192467 (0.32) +26.32 52982 62574 +18.10 5249 5466 +4.13 2Th-1 140550 311704 2.22 48872 (0.35) 73788 (0.19) +50.98 37917 47984 +26.55 4355 4792 +10.03 2Th-2 141292 303560 2.15 48072 (0.34) 70351 (0.19) +46.35 37432 46880 +25.24 4407 4788 +8.65 2Th-3 141453 448494 3.17 50893 (0.36) 78628 (0.13) +54.50 38165 48280 +26.50 4309 4867 +12.95 2Th 423295 1063758 2.51 147837 (0.35) 222767 (0.16) +50.68 49917 67324 +34.87 5129 5679 +10.72 4Th-1 140898 1367412 9.70 41268 (0.29) 73593 (0.05) +78.33 32256 41035 +27.22 4008 4636 +15.67 4Th-2 141290 2304728 16.31 42195 (0.30) 72994 (0.03) +72.99 32315 38953 +20.54 3940 4712 +19.59 4Th-3 141218 2804985 19.86 42470 (0.30) 71993 (0.03) +69.51 31831 37243 +17.00 3871 4647 +20.05 4Th 423406 6477125 15.30 125933 (0.30) 218580 (0.03) +73.57 41995 60309 +43.61 4592 5534 +20.51
IT-1 201113 N/A N/A 56391 (0.28) N/A N/A 42576 N/A N/A 5035 N/A N/A IT-2 201365 N/A N/A 57575 (0.29) N/A N/A 41490 N/A N/A 4805 N/A N/A IT-3 198973 N/A N/A 56963 (0.29) N/A N/A 40744 N/A N/A 4782 N/A N/A
IT 601451 N/A N/A 170929 (0.28) N/A N/A 55967 N/A N/A 5762 N/A N/A
aNumber in parentheses designates the success rate (PSMs/MS2Spectra); Std, standard approach; SQ, SuperQuant approach; Mult., MS2spectra in
SQ/MS2spectra in Std; Diff, relative difference between standard and SuperQuant.
Analytical Chemistry Article
DOI: 10.1021/acs.analchem.5b01166
Anal. Chem.2015, 87, 6319−6327 6322
(e.g., better mass accuracy, resolution, signal-to-noise ratio, etc.). Thus, by using SuperQuant, one can obtain better analytical performance (measured as the number of identified PSMs and peptides) than for the OT-IT technique without compromising resulting mass spectral quality.
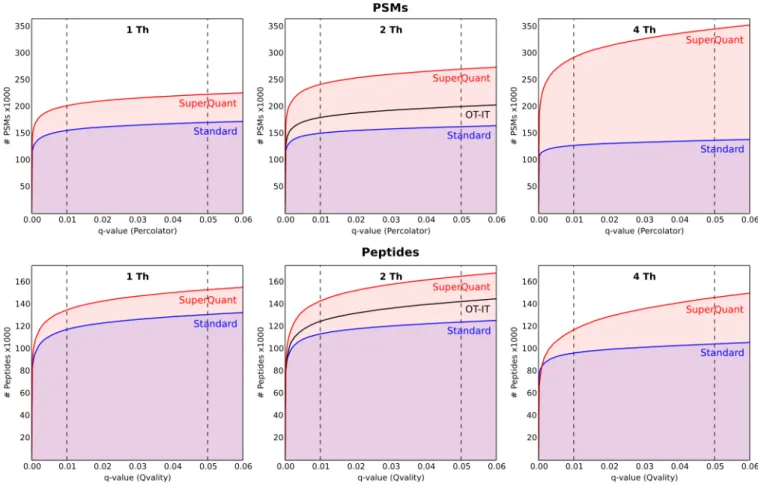
Receiver Operating Characteristic (ROC) Analysis.The performance of the SuperQuant approach is illustrated by the ROC-type plots depicted in Figure 1. The number of identified peptides or PSMs is plotted as a function ofq-value (only q -values less than 0.06 are shown because this region is the most important for practical applications). q-Values were estimated by Percolator for PSM and by Qvality for peptide identifications.
Overall, the SuperQuant approach identifies many more peptides and PSMs at all significance levels. For PSMs, the surplus is growing for wider isolation windows because the number of identifications is slightly lower for standard data processing while the number of identifications for SuperQuant data is increasing. The extent of identified unique peptides, as opposed to PSMs, is more important for the efficient characterization of the sample. In this regard, the observed performance for the SuperQuant approach was still favorable, although to a lesser extent, indicating the redundancy in identified PSMs. The most striking difference was observed for the 4 Th isolation window, where approximately two times more PSMs resulted only in 15% more unique peptide identifications (q-value = 0.01). On the basis of both the PSM- and peptide-level performance, we concluded that the optimal isolation window for SuperQuant was 2 Th.
Quantification Performance of SuperQuant.Next, we assessed the capability of the SuperQuant approach to extend
the depth of the quantitative proteome. Table 3 summarizes PSMs, peptides, and proteins quantified in the labeled HeLa sample. PSM, peptide, or protein was considered successfully quantified if a minimum two of three possible channels were present in the MS1 spectrum. Number of quantifications was usually higher using SuperQuant than when the standard approach was used. This was found even though the ratio of quantifiable peptides was lower in SuperQuant. This can be explained because some of the additional identified peptides had low abundance or the isotopic cluster overlapped with those of other ions present in the isolation window. Results for the combined replicate samples were calculated in the same manner as before: the number of PSMs is the sum of PSMs in individual samples, and for peptides and proteins the proper rollup is reported. The relative improvement for the combined samples was higher than the average improvement of individual samples, and could be opposite in direction (e.g., peptides 4 Th), indicating more complete sampling of corresponding spectra features with the SuperQuant approach.
Best performance was achieved with the 2 Th isolation window, resulting in approximately 10% more quantified PSMs, 15% more quantified peptides, and 7% more quantified proteins. The quantification ratio among quantified and identified PSMs, peptides, and proteins was approximately constant for the standard approach. It increased from PSMs to peptides and to proteins,≈40%,≈50%, and≈60%, respectively, but remained relatively constant for any isolation window. For SuperQuant, the quantification ratio decreased with larger isolation windows and was generally lower than for the standard processing, however, the difference was of little consequence at the protein level.
Figure 1.ROC-type curves for HeLa 10:4:1 sample. Data of all replicates with the same isolation window are merged. Analytical Chemistry
Comparison of the results from OT-OT and OT-IT analysis showed a tendency similar to that observed for identifications alone. After SuperQuant processing, the number of quantified
PSMs and peptides was greater than that found for the OT-IT technique using 1 Th and 2 Th isolation windows; however, at 4 Th, these numbers were lower. Ion trap-based analysis was Table 3. Quantified PSMs, Peptides, and Proteins in HeLa 10:4:1 Samplea
PSMs quantified PSMs quantification ratio
sample Std SQ Std SQ Diff(%) Std (%) SQ (%) 1Th-1 50802 65077 19501 20899 +7.17 38.39 32.11 1Th-2 49242 60287 19039 20316 +6.71 38.66 33.70 1Th-3 53541 70382 20030 21439 +7.03 37.41 30.46 1Th 153585 195746 58570 62654 +6.97 38.14 32.01 2Th-1 48948 74231 18971 21193 +11.71 38.76 28.55 2Th-2 48364 71192 18620 20631 +10.80 38.50 28.98 2Th-3 50971 78863 19123 20906 +9.32 37.52 26.51 2Th 148283 224286 56714 62730 +10.61 38.25 27.97 4Th-1 43029 70775 16791 17623 +4.96 39.02 24.90 4Th-2 43889 68554 16820 16300 −3.09 38.32 23.78 4Th-3 44094 65784 16726 15396 −7.95 37.93 23.40 4Th 131012 205113 50337 49319 −2.02 38.42 24.04
IT-1 56391 N/A 19916 N/A N/A 35.32 N/A
IT-2 57575 N/A 19578 N/A N/A 34.00 N/A
IT-3 56963 N/A 18905 N/A N/A 33.19 N/A
IT 170929 N/A 58399 N/A N/A 34.17 N/A
peptides quantified peptides quantification ratio
sample Std SQ Std SQ Diff(%) Std (%) SQ (%) 1Th-1 39207 45156 16120 17158 +6.44 41.12 38.00 1Th-2 38421 43424 15927 16899 +6.10 41.45 38.92 1Th-3 39855 46506 16113 17102 +6.14 40.43 36.77 1Th 52982 62574 25695 28054 +9.18 48.50 44.83 2Th-1 37917 47984 15698 17169 +9.37 41.40 35.78 2Th-2 37432 46880 15432 16820 +8.99 41.23 35.88 2Th-3 38165 48280 15365 16536 +7.62 40.26 34.25 2Th 49917 67324 24534 28237 +15.09 49.15 41.94 4Th-1 32256 41035 13934 14063 +0.93 43.20 34.27 4Th-2 32315 38953 13807 12851 −6.92 42.73 32.99 4Th-3 31831 37243 13431 11908 −11.34 42.19 31.97 4Th 41995 60309 21436 23431 +9.31 51.04 38.85
IT-1 42576 N/A 16826 N/A N/A 39.52 N/A
IT-2 41490 N/A 15983 N/A N/A 38.52 N/A
IT-3 40744 N/A 15536 N/A N/A 38.13 N/A
IT 55967 N/A 26428 N/A N/A 47.22 N/A
proteins quantified proteins quantification ratio
sample Std SQ Std SQ Diff(%) Std (%) SQ (%) 1Th-1 4403 4617 2537 2612 +2.96 57.62 56.57 1Th-2 4385 4518 2558 2637 +3.09 58.34 58.37 1Th-3 4330 4657 2529 2595 +2.61 58.41 55.72 1Th 5249 5466 3107 3215 +3.48 59.19 58.82 2Th-1 4355 4792 2494 2606 +4.49 57.27 54.38 2Th-2 4407 4788 2496 2605 +4.37 56.64 54.41 2Th-3 4309 4867 2453 2583 +5.30 56.93 53.07 2Th 5129 5679 3041 3260 +7.20 59.29 57.40 4Th-1 4008 4636 2376 2502 +5.30 59.28 53.97 4Th-2 3940 4712 2313 2428 +4.97 58.71 51.53 4Th-3 3871 4647 2243 2299 +2.50 57.94 49.47 4Th 4592 5534 2836 3138 +10.65 61.76 56.70
IT-1 5035 N/A 2779 N/A N/A 55.19 N/A
IT-2 4805 N/A 2657 N/A N/A 55.30 N/A
IT-3 4782 N/A 2617 N/A N/A 54.73 N/A
IT 5762 N/A 3319 N/A N/A 57.60 N/A
aStd, standard approach; SQ, SuperQuant approach; Diff, relative difference between standard and SuperQuant approaches; quantification ratio, no.
quantifications/no. identifications (%).
Analytical Chemistry Article
DOI: 10.1021/acs.analchem.5b01166
Anal. Chem.2015, 87, 6319−6327 6324
superior to the SuperQuant approach in terms of identified proteins, but the difference was marginal.
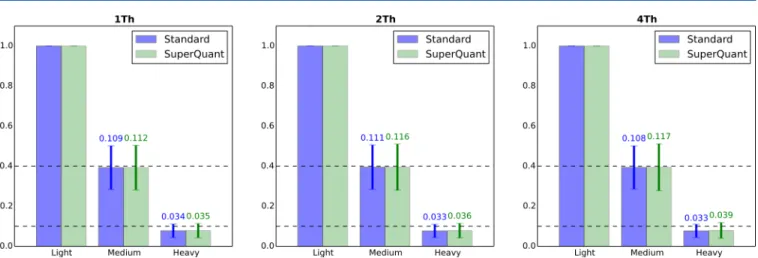
Next, we compared the accuracy of quantification using either the standard or the SuperQuant approach. Because the HeLa sample was constructed to have a specific ratio between channels (10:4:1), we determined whether the expected ratios were observed in our data set. Figure 2 displays the quantification ratio reported for individual peptides in all nine samples (replicates merged). Because one should expect the ratios to be 1:10 for the heavy−light pair and 1:4 for the medium−light pair, all values that were 3-fold higher or lower than the expected values were removed from the analysis as outliers.
As displayed in Figure 2, the values of the experimental channel ratios were close to those expected in all samples. The standard deviation was smaller compared to the mean value for medium−light ratios than for heavy−light ratios. The mean value for heavy−light was lower than the expected value in all cases; however, it was within ±1 standard deviation from the mean. This observed result can be due to the fact that the sampling ratio 1:10 (heavy−light) was more prone to some inevitable technical errors (e.g., pipetting errors) than the 4:10 (medium−light). By comparing the corresponding ratio distributions for SuperQuant and standard processing, no important differences were found. The standard deviation was always slightly higher for the SuperQuant approach. This observation can be explained by the possible increase in low abundance PSMs quantified by SuperQuant. The distribution of observed ratio as a function of abundance for standard and SuperQuant processing are depicted in Supporting Information Figures 1 and 2, respectively. The results showed that no bias in the estimation of sample peptide abundances was introduced by using the SuperQuant approach.
For further testing, we calculated the coefficient of variation (CV) between replicate quantitations of proteins by the standard and the SuperQuant approaches. The data are presented in Table 4. CVs between 10% and 20% are typical values reported for parent ion-based quantitation meth-ods,34−36 thus median CVs observed for both approaches were within the expected magnitude. SuperQuant CVs were normally larger than those for the standard approach, which is not surprising because SuperQuant allows deeper access to the proteome and hence includes more low-abundance PSMs. The
difference was around 0.5−2.0% for the medium−light channel and 1.0−4.0% for the heavy−light channel. The lower CVs observed for the medium−light channel compared to the heavy−light channel (∼6% vs∼13%) could be explained by a larger average magnitude of the measurements in the medium− light channel.
Because the ultimate goal of any quantitative proteomics experiment is to collect reliable and accurate information on differentially regulated proteins, we investigated quantification performance on the protein level (Table 5).
Table 5 shows that the SuperQuant processing produced more unique peptides per protein at every isolation window. The maximal gain in the number of identified unique peptides was observed for 2 Th isolation window and allowed about 0.8 additional unique peptides per protein on average. The significance of the observed differences was estimated using a permutation test with 10000 simulations. The expected values for mean and standard deviation of the difference are shown in Table 5. Two-tailed test p-values were below the limit for Figure 2.Ratio between the abundances of differentially labeled versions of the same peptide for the HeLa 10:4:1 sample. All abundances were normalized to the value of the light channel. The bar height corresponds to the mean value, while whiskers correspond to the standard deviations with their numerical values displayed. Expected ratios (1:10 for heavy/light, 4:10 for medium/light) are shown by dashed lines. Values that differed more than 3-fold from the expected value were considered outliers and removed from the analysis. Replicates were merged.
Table 4. Median Coefficient of Variation of Protein Quantitation between Replicatesa
heavy−light ratio medium−light ratio sample Std (%) SQ (%) Std (%) SQ (%)
1 Th 12.99 13.91 6.01 6.47 2 Th 13.07 15.65 5.93 6.65 4 Th 12.91 17.29 5.57 7.65
aStd, standard approach; SQ, SuperQuant approach.
Table 5. Identified Unique Peptides per Protein for Standard and SuperQuant Approachesa
average number of unique
peptides per protein permutation test isolation
width Std SQ difference μ σ p-value 1 Th 6.00 6.54 0.54 0.00 0.12 4.84×10⁻⁶
2 Th 5.80 6.61 0.81 0.00 0.12 2.31×10⁻¹²
4 Th 5.44 5.76 0.31 0.00 0.11 3.26×10⁻³
aStd, standard approach; SQ, SuperQuant approach;p-value estimated
for two-tailed test. Analytical Chemistry
statistical significance. Improvement in the number of unique peptides per protein leads to greater reliability for the identification and quantification of proteins.
■
CONCLUSIONSSuperQuant is a data processing approach for shotgun proteomics data. It employs complementary fragment ions to deconvolute coisolated ion species following their quantifi ca-tion. The approach was tested using dimethyl-labeled HeLa lysate samples having a constructed ratio between channels (10:4:1, H:M:L). SuperQuant provided reliable qualitative and quantitative information on the sample and performed better than the conventional data processing approach at the same significance level. At its best, this approach resulted in 70% more PSM that translated into 40% more unique peptide and 20% more protein identifications compared to standard processing of the same data. Moreover, the number of identifications was higher than that found with the OT-IT technique and the quality of the fragmentation data was better. The observed CVs between proteins among the replicates were close to the values reported for other precursor ion-based quantification methods. This verifies the reliability and applicability of results obtained using the SuperQuant data processing approach. Thus, SuperQuant allows deeper coverage and quantification of the proteome and may reveal new potentially relevant biological information. The primary benefits of SuperQuant are (1) the laborious and time-consuming prefractionation steps can be avoided without compromising the depth of the analysis, thus saving time and materials necessary for the analysis, (2) the approach can be applied to previously acquired data, adding new information to it, and (3) the researchers can use their instruments more efficiently because the amounts and quality of the data are higher than that obtained with commonly used approaches.
The results indicated that even with the narrowest isolation window tested (1 Th), approximately one in three spectra showed signs of cofragmentation and, on average, 14 additional spectra were generated per recorded spectrum with the 4 Th isolation window. The widest isolation window tested (4 Th) demonstrated the limitations of the presented software. The number of virtual spectra generated was large, and the identification rate decreased. Better suppression of noise in the input spectra or more sophisticated ways to validate coisolated masses could be beneficial for the wider isolation windows. We suggest using 2 Th as the best balance between data complexity and results obtained. There is no limitation to the use of the software with higher-energy collisional dissociation (HCD) fragmentation spectra, however, it is expected that it will be most efficient with CID because CID spectra contain more complementary ion pairs.37 When SuperQuant workflow was applied to HCD fragmentation data, recorded with a 2 Th isolation window (using acquisition parameters identical to the OT-OT technique, except for the gradient length of 2 h), the gain in the number of PSMs, peptides, and proteins was 32%, 12%, and 6%, respectively. Despite the fact that with shorter gradient the number of coisolated precursors is expected to be higher, the improvement was about two times less than for CID data, however, SuperQuant workflow is clearly applicable for HCD data as well. Finally, correctly accounting for possible precursor ion coisolation is the most appropriate way to analyze shotgun proteomics data.
■
ASSOCIATED CONTENT*
S Supporting InformationObserved ratio between the abundances of differentially labeled versions of the same peptide for the HeLa 10:4:1 sample as a function of ion abundance for standard workflow and SuperQuant workflow. The Supporting Information is available free of charge on the ACS Publications website at DOI: 10.1021/acs.analchem.5b01166.
■
AUTHOR INFORMATION Corresponding Authors*For V.G.: phone, +45 6550 8920; E-mail, [email protected]. *For F.K.: phone, +45 6550 2439; fax, +45 6550 2467; E-mail, [email protected].
Author Contributions
†V.G. and T.V.-B. contributed equally Notes
The authors declare no competingfinancial interest.
■
ACKNOWLEDGMENTSWe thank Pernille Lassen (University of Southern Denmark, Department of Biochemistry and Molecular Biology, Odense, Denmark) for helping with the HeLa cell cultivation. We gratefully acknowledgefinancial support by the Danish Council for Independent Research (a grant to F.K., 0602-02691B) and grants from the VILLUM Foundation, including the VILLUM Center for Bioanalytical Sciences at the University of Southern Denmark.
■
REFERENCES(1) Cravatt, B. F.; Simon, G. M.; Yates, J. R., III.Nature2007,450 (7172), 991−1000.
(2) Ghaemmaghami, S.; Huh, W. K.; Bower, K.; Howson, R. W.; Belle, A.; Dephoure, N.; O’Shea, E. K.; Weissman, J. S.Nature2003, 425(6959), 737−741.
(3) Michalski, A.; Cox, J.; Mann, M.J. Proteome Res.2011,10(4), 1785−1793.
(4) Aebersold, R.; Mann, M.Nature2003,422(6928), 198−207. (5) Huang, J.; Wang, F.; Ye, M.; Zou, H. J. Chromatogr., A 2014, 1372C, 1−17.
(6) Ngounou Wetie, A. G.; Shipp, D. A.; Darie, C. C.Adv. Exp. Med.
Biol.2014,806, 581−593.
(7) Houel, S.; Abernathy, R.; Renganathan, K.; Meyer-Arendt, K.; Ahn, N. G.; Old, W. M.J. Proteome Res.2010,9(8), 4152−4160.
(8) Zhang, B.; Pirmoradian, M.; Chernobrovkin, A.; Zubarev, R. A.
Mol. Cell Proteomics2014,13(11), 3211−3223.
(9) Niu, M.; Mao, X.; Ying, W.; Qin, W.; Zhang, Y.; Qian, X.Rapid
Commun. Mass Spectrom.2012,26(16), 1875−1886.
(10) Luethy, R.; Kessner, D. E.; Katz, J. E.; Maclean, B.; Grothe, R.; Kani, K.; Faca, V.; Pitteri, S.; Hanash, S.; Agus, D. B.; Mallick, P.J.
Proteome Res.2008,7(9), 4031−4039.
(11) Hebert, A. S.; Richards, A. L.; Bailey, D. J.; Ulbrich, A.; Coughlin, E. E.; Westphall, M. S.; Coon, J. J.Mol. Cell Proteomics2014, 13(1), 339−347.
(12) Pirmoradian, M.; Budamgunta, H.; Chingin, K.; Zhang, B.; Astorga-Wells, J.; Zubarev, R. A.Mol. Cell Proteomics2013,12(11), 3330−3338.
(13) Thakur, S. S.; Geiger, T.; Chatterjee, B.; Bandilla, P.; Frohlich, F.; Cox, J.; Mann, M.Mol. Cell Proteomics2011,10(8), M110 003699. (14) Ross, P. L.; Huang, Y. N.; Marchese, J. N.; Williamson, B.; Parker, K.; Hattan, S.; Khainovski, N.; Pillai, S.; Dey, S.; Daniels, S.; Purkayastha, S.; Juhasz, P.; Martin, S.; Bartlet-Jones, M.; He, F.; Jacobson, A.; Pappin, D. J.Mol. Cell Proteomics2004,3(12), 1154− 1169.
Analytical Chemistry Article
DOI: 10.1021/acs.analchem.5b01166
Anal. Chem.2015, 87, 6319−6327 6326
(15) Thompson, A.; Schafer, J.; Kuhn, K.; Kienle, S.; Schwarz, J.; Schmidt, G.; Neumann, T.; Johnstone, R.; Mohammed, A. K.; Hamon,
C.Anal. Chem.2003,75(8), 1895−1904.
(16) Ting, L.; Rad, R.; Gygi, S. P.; Haas, W.Nature Methods2011,8 (11), 937−940.
(17) Karp, N. A.; Huber, W.; Sadowski, P. G.; Charles, P. D.; Hester, S. V.; Lilley, K. S.Mol. Cell Proteomics2010,9(9), 1885−1897.
(18) Ong, S. E.; Blagoev, B.; Kratchmarova, I.; Kristensen, D. B.; Steen, H.; Pandey, A.; Mann, M. Mol. Cell Proteomics 2002,1 (5), 376−386.
(19) Boersema, P. J.; Aye, T. T.; van Veen, T. A.; Heck, A. J.; Mohammed, S.Proteomics2008,8(22), 4624−4632.
(20) Hsu, J. L.; Huang, S. Y.; Chow, N. H.; Chen, S. H.Anal. Chem. 2003,75(24), 6843−6852.
(21) Cox, J.; Neuhauser, N.; Michalski, A.; Scheltema, R. A.; Olsen, J. V.; Mann, M.J. Proteome Res.2011,10(4), 1794−1805.
(22) Bern, M.; Finney, G.; Hoopmann, M. R.; Merrihew, G.; Toth, M. J.; MacCoss, M. J.Anal. Chem.2010,82(3), 833−841.
(23) Zhang, N.; Li, X. J.; Ye, M.; Pan, S.; Schwikowski, B.; Aebersold,
R.Proteomics2005,5(16), 4096−4106.
(24) Kryuchkov, F.; Verano-Braga, T.; Hansen, T. A.; Sprenger, R. R.; Kjeldsen, F.J. Proteome Res.2013,12(7), 3362−3371.
(25) Ledvina, A. R.; Savitski, M. M.; Zubarev, A. R.; Good, D. M.; Coon, J. J.; Zubarev, R. A.Anal. Chem.2011,83(20), 7651−7656.
(26) Leon, I. R.; Schwammle, V.; Jensen, O. N.; Sprenger, R. R.Mol.
Cell Proteomics2013,12(10), 2992−3005.
(27) Boersema, P. J.; Raijmakers, R.; Lemeer, S.; Mohammed, S.; Heck, A. J.Nature Protoc.2009,4(4), 484−494.
(28) Kall, L.; Canterbury, J. D.; Weston, J.; Noble, W. S.; MacCoss, M. J.Nature Methods2007,4(11), 923−925.
(29) Kall, L.; Storey, J. D.; Noble, W. S.Bioinformatics2009,25(7), 964−966.
(30) Vizcaino, J. A.; Cote, R. G.; Csordas, A.; Dianes, J. A.; Fabregat, A.; Foster, J. M.; Griss, J.; Alpi, E.; Birim, M.; Contell, J.; O’Kelly, G.; Schoenegger, A.; Ovelleiro, D.; Perez-Riverol, Y.; Reisinger, F.; Rios, D.; Wang, R.; Hermjakob, H.Nucleic Acids Res.2013,41(Database issue), D1063−D1069.
(31) Geromanos, S. J.; Hughes, C.; Golick, D.; Ciavarini, S.; Gorenstein, M. V.; Richardson, K.; Hoyes, J. B.; Vissers, J. P.; Langridge, J. I.Proteomics2011,11(6), 1189−1211.
(32) Wang, J.; Bourne, P. E.; Bandeira, N.Mol. Cell Proteomics2014, 13(12), 3688−3697.
(33) Williamson, J. C.; Edwards, A. V.; Verano-Braga, T.; Schwämmle, V.; Kjeldsen, F.; Jensen, O. N.; Larsen, M. R.Proteomics Submitted for publication.
(34) Aye, T. T.; Low, T. Y.; Bjorlykke, Y.; Barsnes, H.; Heck, A. J.; Berven, F. S.Anal. Chem.2012,84(11), 4999−5006.
(35) Liu, N. Q.; Dekker, L. J.; Stingl, C.; Guzel, C.; De Marchi, T.; Martens, J. W.; Foekens, J. A.; Luider, T. M.; Umar, A.J. Proteome Res. 2013,12(10), 4627−4641.
(36) Burniston, J. G.; Connolly, J.; Kainulainen, H.; Britton, S. L.; Koch, L. G.Proteomics2014,14(20), 2339−2344.
(37) Michalski, A.; Neuhauser, N.; Cox, J.; Mann, M.J. Proteome Res. 2012,11(11), 5479−5491.