Comparative Analysis of Improvement in Power
System Performance by Application of Shunt
FACTS Device STATCOM & SVC
Sapana A. Bhande Nirmala A. Ramtekkar
Priyadarshini Bhagwati College of Engineering Nagpur Priyadarshini Bhagwati College of Engineering Nagpur
Abstract
In emerging electric power systems, increased transactions often lead to situations where system no longer remains in the secure operating region. The Flexible AC Transmission System (FACTS) controllers can play an important role in the power system security enhancement. This paper gives the comparative analysis of of Improvement in Power System Performance by Application of shunt FACTS device STATCOM & SVC. The methodology based on Reactive power sensitivity approach with respect to STATCOM & SVC control parameters. The effectiveness of the proposed algorithm is tested and illustrated on 5-bus system. The simulation is performed using Matpower 4.0 in MATLAB The effectiveness of the proposed algorithm is tested and illustrated on 5-bus system. The simulation is performed using Matpower 4.0 in MATLAB 7.1 environment.
Keywords: FACTS, Static Synchronous Compensator
________________________________________________________________________________________________________ I. INTRODUCTION
A Power system consist of three main components i.e. generating units which supplies power to the system, loads which consumes power and transmission & distribution network which interconnects various buses in the system and carries power from the generating points to the load points[1] . In a competitive electricity market with the rapid development of society, the load demand has grown quickly. A s a result, transmission networks are becoming highly loaded which threatens the power system incurring greater losses, security and reliability[1],stability, ultimately make certain generation patterns economically undesirable. Though building new transmission lines can relive the severe situation, it is hard to implemented due to various limitations such as environmental, right-of-way and cost[1,2,6].
Flexible A.C. Transmission Line, which are power electronics based devices can change parameters like impedance, voltage and phase angle. FACTS devices also helps to reduce flows in heavily loaded lines, resulting in an increased loadability, low system loss, improved stability of the network, reduced cost of production and fulfilled contractual requirement by controlling the power flows in the network. They provide control facilities, both in steady state power flow control and dynamic stability control. The possibility of controlling power flow in an electrical power system without generation rescheduling or topological changes can improve the performance considerably [6].
FACTS devices can play a major role in congestion management, enhancement of security, transfer capability and reliability. FACTS devices can be connected to a transmission line in various ways, such as in series, shunt or a combination of series and shunt. The static VAR compensator (SVC) and static synchronous compensator (STATCOM) are connected in shunt, static synchronous compensator (SSSC) and thyristor controlled series capacitor (TCSC) are connected in series. Thyristor controlled phase shifting transformer (TCPST) is connected in series and shunt combination. The reactive power support in the system plays a very important role in maintaining an acceptable system voltage profile and helping in improvement of security.
In this paper STATCOM & SVC are considered for improvement of power system performance and comparative results are obtained by using MATLAB programming with and without STATCOM & SVC.
II. ABOUT STATCOM
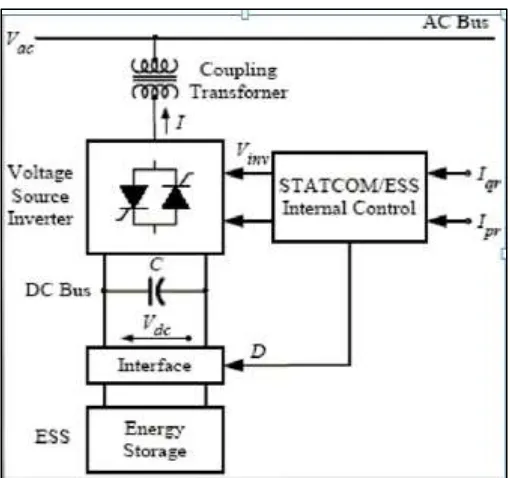
Fig. 1: Functional Diagram Of STATCOM
III. ABOUT SVC
An SVC is a shunt connected static var generator or absorber whose output is adjusted to exchange capacitive or inductive reactive current so as to maintain or control specific parameters of the power system i.e. typically bus voltages. The static var compensator is a parallel combination of capacitor and inductor; the latter is under phase angle control called as Thyristor Controlled Reactor (TCR). Fixed capacitor (FC) with TCR, shown in Fig. 1. This combination provides a fast variable source of reactive power.
Fig. 2: Structure of SVC
IV. MODELLING OF STATCOM
A STATCOM consist of one VSC and its associated transformer. It is the static counterpart of rotating synchronous condenser but it generates or absorbs reactive power at a faster rate because no moving part is involved. In principle it performs the same voltage regulation function as the SVC but in a more robust manner. The Equvalent Circuit Of STATCOM is shown in Fig.2.In steady state fundamental frequency studies the STATCOM may be represented in the same way as asynchronous condenser, which in most cases is the model of synchronous generator with zero active power generation A more flexible model may be realized by representing STATCOM as a variable voltage source EvR, for which the magnitude and phase angle may be adjusted using a suitable iterative algorithm to satisfy a specified voltage magnitude at the point of connection with the AC network. The shunt voltage source of the three phase STATCOM may be represented by;
vR vR
vR
vR V j
E cos sin
(1) Where indicate phase quintiles a, b, c. The voltage magnitude,
vR
V is given maximum & minimum limits, which are
function of STATCOM capacitor rating. However
vR may take any value between 0 and 2πradian. With reference to the equivalent circuit assuming three phase parameters, the following transfer admittance equation can be written as:
vR k vR k
E V Y I
(2) Where,
c
tk c k b k b k a k a k
k I I I
I ,
c
tk c k b k b k a k a k
k V V V
V
c
tvRk c vRk b vRk b vRk a vRk a vRk
vR V V V
E
c vRk b vRk a vRk
vR
Y Y Y
Y
0 0
0 0
0 0
V. MODELLING OF SVC
A possible structure of the SVC is given in Fig. 1. It is a shunt-connected device composed of several modules built of a fixed capacitance in parallel with a thyristor controlled reactor. The equivalent susceptance Beq is determined by the firing angle α of the thyristors which is defined as the delay angle measured from the peak of the capacitor voltage to the firing instant. The fundamental frequency equivalent neglecting the harmonics of the current results in
Beq= BL (α) +Bc
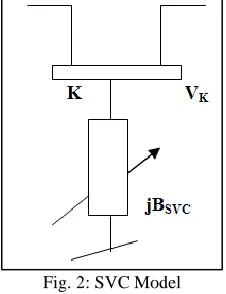
Parallel equivalent susceptances of the modules, each controlled separately. Thus, the SVC can be modeled as a shunt-connected variable susceptance BSVC(Fig. 2) with a lower bound BSVCand an upper bound BSVC[7]. In the power flow equations this is accounted for by including the reactive power.
SVC can be modeled as shunt connected suseptance BSVC. In the power flow equations this is accounted for by including the reactive power. QSVC=-VK2 BSVC into the reactive power balance at bus k subject to: BSVCmin ≤ BSVC ≤ BSVCmax.
Fig. 2: SVC Model
VI. STATCOM POWER FLOW MODEL
vR vR vR
vR V j
E cos sin (3)
Based on the STATCOM equivalent circuit, the following may be written:
* *
* * k vR vR vR vR vRvR V I V Y V V
S (4)
After performing some complex operations, the following active and reactive power equations are obtained for the converter bus k, respectively
cos sin
,2 k vR vR k vR vR k vR vR vR
vR V G V V G B
P
sin cos
,2 k vR vR k vR vR k vR vR vR
vR V B V V G B
Q
cos sin
,2 vR k vR vR k vR vR k vR k
k V G V V G B
P
sin cos
,2 vR k vR vR k vR vR k vR k
k V B V V G B
Q
Using this power equations, the linearised STATCOM model is given below, where the voltage magnitude
vR
V and phase angle
vR
are taken to be the state variables.
vR vR vR k k k vR vR vR vR vR k k vR k vR vR vR vR vR vR k k vR k vR vR vR k vR k k k k k k vR vR k vR k k k k k k kR kR k k V V V V V V Q Q V V Q Q V V P P V V P P V V Q Q V V Q Q V V P P V V P P P P Q P
VII. SVC POWER FLOW MODEL The SVC can be incorporated in N-R method using equation
ISVC= jBSVC Vk (1) The reactive power drawn by the SVC, also the reactive power injected at bus k is
QSVC = Qk =- V2k BSVC (2)
The linearised equation is given by equation, where the equivalent susceptance 𝐵𝑆𝑉𝐶is taken to be the state variable
[∆𝑄∆𝑃𝑘
𝑘] (𝑖)
=[00 𝑄0
𝑘] (𝑖) [ ∆𝜃𝑘 ∆𝐵𝑆𝑉𝐶 𝐵𝑆𝑉𝐶 ⁄ ] (𝑖) (3)
At the end of the iteration (i) the variable shunt susceptance BSVC is updated according to
(4)
The changing susceptance represents the total SVC susceptance necessary to maintain the nodal voltage magnitude at the specified value.
Once the level of compensation has been computed then the thyristor firing angle can be calculated. However the additional calculation requires an iterative solution because the SVC susceptance and thyristor firing angle are non-linearly related. The thyristor firing angle can be included using the following equations. The positive sequence susceptance of the SVC is given by
(5) Where XL=ωL, XC= 1/ωc
𝑄𝑘= −𝑉𝑘2 𝑋𝑐𝑋𝐿{𝑋𝐿−
𝑋𝑐
𝜋[2(𝜋 − 𝛼𝑆𝑉𝐶) + 𝑠𝑖𝑛(2𝛼𝑆𝑉𝐶)]} (6) The linearised SVC equation can be given by
[𝛥𝑄𝛥𝑃𝑘
𝑘] (𝑖)
= [𝐽1 𝐽2𝐽3 𝐽4]
(𝑖)
[𝛥𝛼𝛥𝛳𝑘
𝑆𝑉𝐶] (𝑖)
(7)
Where J1=0, J2=0, J3=0 and
J4 = 2𝑉𝑘2
𝜋𝑋𝐿[𝑐𝑜𝑠(2𝛼𝑆𝑉𝐶) − 1]
At the end of iteration (i), the variable firing angle αsvc is updated according to
𝛼𝑆𝑉𝐶(𝑖) = 𝛼𝑆𝑉𝐶(𝑖−1)+ 𝛼𝑆𝑉𝐶(𝑖) (8)
VIII. METHOD FOR OPTIMAL LOCATION OF STATCOM & SVC
Sensitivity Approach
A sensitivity approach is the Conventional approach which could be applied for finding the optimal location of shunt FACTS devices.
Reactive Transmission Congestion Distribution Factor (QTCDF)
The real power flow & reactive power flow in a line k connected between bus i & bus j can be written as Pi j = Vi Vj Yij cos ( θij + δj - δi )-Vi2 Yij cos θij (1) Qi j= -Vi Vj Yij sin ( θij + δj - δi ) - Vi2 Yij sin θij-Vi2 Ysh/2 (2) Where
Vi-magnitude of voltage at bus i Vj- magnitude of voltage at bus j δi-angle at bus i
δj- angle at bus j
Reactive transmission congestion distribution factor(QTCDF) are defined as the change in the reactive power flow (∆Qij) in a transmission line k connected between bus i & bus j due to unit change in the reactive power injection(∆Qn) at bus-n & can be written as n ij k n Q Q QTCDF
(3)
Similarly, PTCDF for line K can be calculated as
n ij k n P P PTCDF
(4)
Using Taylor series approximation Eq.3 & 4 can be written a
j j ij i i ij j i ij i i ij ij V V P V V P P P P (5) j j ij i i ij j i ij i i ij ij V V Q V V Q Q Q Q (6)
Eq.(5) &(6) can be written as
j ij i ij j ij i ij
ij a b c V d V
P
(7)
j ij i ij j ij i ij
ij a b c V d V
Q
' ' ' ' (8)
The coefficient appearing in above eq. Can be obtained using partial derivative of real &reactive power flow with respect to variable δ and V as
aij = Vi Vj Yij sin ( θij + δj -δi ) bij =- Vi Vj Yij sin ( θij + δj -δi ) cij = Vj Yij cos( θij + δj -δi ) - 2Vi Yij cos θij
dij = Vj Yij cos( θij + δj -δi )
'
ij
a = Vi Vj Yij cos ( θij + δj -δi )
'
ij
b = -Vi Vj Yij cos ( θij + δj -δi )
'
ij
c = -Vj Yij sin ( θij + δj - δi ) +2 ViYij cos θij-Vi Ysh
'
ij
d = - Vi Yij sin( θij + δj -δi )
For determining of congetion distribution factor following jacobian relation has been used:
(9)
Neglecting P-V & Q-V above eq. Can be simplified as
∆P = [J11][∆δ] ∆Q = [J22][∆V] Therefore
It is assumed that change in the bus voltage on real power flow & bus angle on active power flow is negligible therefore above eq. Becomes
j ij i ij
ij a b
P
j ij i ij
ij a V b V
Q
' '
Substituting the values of Δδi & ΔVi in above both eq. & expanded as
ij
P
= (aijmi1 + bij mj1) ∆P1 + (aijmi2 + bij mj2) ∆P2 +--- + (aijmin+ bij mjn) ∆Pn (12)
ij Q
= (aij' ni1 +
'
ij
b nj1) ∆Q1 + (
'
ij
a ni2 +
'
ij
b nj2) ∆Q2 + --- + (
'
ij
a nin+
'
ij
b njn) ∆Qn (13)
Eq. Can be written as
ij
P
= k
PTCDF 1 ∆P1 + PTCDF 2k∆P2 +--- + PTCDF nk∆Pn
ij Q
= QTCDF 1k∆Q1+ QTCDF 2k∆Q2 +---+QTCDF nk∆Qn Where
k n
PTCDF = (aijmin + bij mjn)
k n QTCDF = (
'
ij
a nin +
'
ij b njn)
These are real & Reactive transmission congestion distribution factor corresponding to the bus n & line K connected between bus i & j.
The optimal location of STATCOM can be considered at a bus having most negative QTCDF.
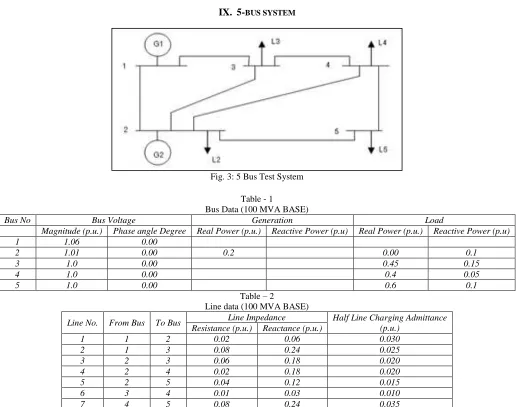
IX. 5-BUS SYSTEM
Fig. 3: 5 Bus Test System
Table - 1
Bus Data (100 MVA BASE)
Bus No Bus Voltage Generation Load
Magnitude (p.u.) Phase angle Degree Real Power (p.u.) Reactive Power (p.u) Real Power (p.u.) Reactive Power (p.u)
1 1.06 0.00
2 1.01 0.00 0.2 0.00 0.1
3 1.0 0.00 0.45 0.15
4 1.0 0.00 0.4 0.05
5 1.0 0.00 0.6 0.1
Table – 2
Line data (100 MVA BASE)
Line No. From Bus To Bus Line Impedance Half Line Charging Admittance (p.u.)
Resistance (p.u.) Reactance (p.u.)
1 1 2 0.02 0.06 0.030
2 1 3 0.08 0.24 0.025
3 2 3 0.06 0.18 0.020
4 2 4 0.02 0.18 0.020
5 2 5 0.04 0.12 0.015
6 3 4 0.01 0.03 0.010
Table – 3
Line Flow Limit for 5-Bus System From Bus-To Bus Line Flow Limit(pu)
1-2 1.20
1-3 0.55
2-3 0.55
2-4 0.55
2-5 0.55
3-4 0.55
4-5 0.55
Table - 4
Sensitivity Approach Results of 5 Bus System Bus Number QTCDF
3 -0.761141 4 -0.481845 5 -0.436032
The optimal placement of shunt fact device has been considered at a bus having most negative transmission congestion distribution factor (QTCDF) i.e. at Bus no. 3.
X. RESULTS
With & Without STATCOM
With STATCOM & SVC placed at bus-3 again the load flow of 5 bus system is obtained. Table 5 to 8 shows the comparison of results with and without STATCOM & SVC
Table – 5 Voltage Magnitude(P.U.)
Line With SVC Without SVC
1 0.058+j0.0429 0.0581+j0.0431 2 0.0416+j0.0155 0.0455+j0.029 3 0.0238-j0.0085 0.0241-j0.0065 4 0.0244-j0.0063 0.0256-j0.0014 5 0.0263+j0.0197 0.0267+j0.0212 6 0.0126-j0.002 0.0103-j0.0062 7 0.0246-j0.0226 0.0234-j0.0218 Total Losses 0.02113+j0.0387 0.02137+j0.0574
Table – 6
Voltage Phase Angle (Degree)
Bus Number 1 2 3 4 5
With STATCOM 1.06 1.01 1 0.986 0.9809 Without STATCOM 1.06 1.01 0.97430 0.96531 0.97396
With SVC 1.06 1 1 0.984 0.9737
Without SVC 1.06 1 0.9668 0.9574 0.9648 Table - 7
Bus power(p+jq) p.u.
Bus No. Without STATCOM With STATCOM With SVC Without SVC 1 1.3357 + 0.8615i 1.3382+ 0.75i 1.3415+0.9239i 1.3359+1.0683i 2 0.4433 - 0.0456i 0.4557- 0.3638i 0.4501-0.6475i 0.4341-0.2421i 3 -0.4297 - 0.1300i -0.4342+0.2858i -0.4336+0.4082i -0.4273-0.13i 4 -0.3612 - 0.4585i -0.3694-0.464i -0.3685-0.462i -0.3578-0.4535i 5 -0.5777 - 0.0877i -0.5832-0.0862i -0.5782-0.0841i -0.5711-0.0853i
Table – 8
Transmission Line Losses(I2Z) p.u.
Line Without STATCOM With STATCOM
P loss Q loss P loss Q loss
1 0.0538 0.0295 0.0537 0.0293
2 0.0443 0.0248 0.0414 0.015
3 0.0247 -0.0062 0.0239 -0.0095
4 0.0263 -0.0011 0.0249 -0.006
5 0.0271 0.0213 0.0267 0.0198
6 0.0104 -0.0066 0.012 -0.0037
Total Losses 0.2103 0.0397 0.2072 0.0218
XI. CONCLUSION
FACTS devices are a powerful tool to improve the voltage profile of the system. In this paper STATCOM & SVC is simulated using Matpower 4.0 in MATLAB 7.1 environment. Finally, comparative results are obtained which compares the following parameter with STATCOM & SVC.
Improvements of the voltage profile
Active and reactive power losses are reduced.
REFERENCES
[1] N. G. Hingorani and L. Gyugyi, “Understanding FACTS Concepts and Technology of Flexible AC Transmission Systems” IEEE Press, 2000.
[2] Acha E,Fuerte-EsquivelC.R.,Ambriz-Perez H. and Comacho C, “FACTS:Modelling and Simulation in power networks”,John Wiley and Sons Ltd,England,2004.
[3] Ashiwini Kumar,S.C.Shrivastava,”A Zonal Congestion Management Approach using real and reactive power Rescheduling”,IEEE Transaction on Power System,Vol 19,No. 1,Feb. 2004.
[4] M.k.Veram and S.C.Shrivastava,”Enhancement of voltage stability margin under Contingencies using FACTS controller”,International Journalof Emerging Electric Power System,Vol. 2,Issue 2,2005,Article 1050.
[5] V. Ajjarapu,C. Christy,”The continuation Power Flow:A Toll for Steady State voltage stability”,IEEE Transactions on Power Systems,Vol.7,No. 1, Feb 1992.
[6] S.N.Singh and A.K.David,”Optimal Location of FACTS devices for Congestion Managment”,Electric Power Research,Vol. 46, No. 3, 1998,pp.251-257. [7] Jai Govind Singh, Sri Niwas Singh, S.C.Srivastava, Lennart Söder,” Power System Security Enhancement by optimal placement of UPFC”, Proceedings of
the IASTED International Conference November 24 - 26, 2010 Phuket, Thailand Power and Energy Systems (AsiaPES 2010),Pg No. 228-235.
[8] S. Gerbex, R. Cherkaoui, and A. J. Germond, Member, IEEE,” Optimal Location of FACTS Devices to Enhance Power System Security”, 2003 IEEE Bologna PowerTech Conference, June 23-26, Bologna, Italy,
[9] B. Kalyan Kumar, S.N. Singh and S.C. Srivastava, “Placement of FACTS controllers using modal controllability indices to damp out power system oscillations”, The Institution of Engineering and Technology 2007, IET Gener. Transm. Distrib., 2007, 1, (2), pp. 209–217.
[10] H C Leung T S Chung,” Optimal Placement of FACTS Controller in Power System by a Genetic-based Algorithm”, IEEE 1999 International Conference on Power Electronics and Drive Systems, PEDS’99, July 1999, Hong Kong, Pg No. 833-836.
[11] S.N. Singh and A.K. David, “Congestion management by optimizing FACTS device allocation,” International conference on Electric utility deregulation & restructuring and power technologies 2000, City university, London, 4-7 April 2000, pp. 23-28.
[12] K.S. Verma, S.N. Singh and H.O. Gupta, "Optimal location of UPFC for congestion management", Electric Power Systems Research, Vol.58, No.2, pp. 89-96, July 2001.
Text Books
[13] Enrique Acha,Claudio R.Fuerte-Esuivel,Hugo Ambriz-Perez,Cesar Angeles-Camacho,”FACTS Modelling and Simulation in Power Networks”,John Wiley & Sons Ltd.