A Compression Algorithm Design and Simulation for
Processing Large Volumes of Data from Wireless
Sensor Networks
Priyanka Vangali
University of Houston, Clear Lake 2700 Bay Area Blvd Houston, TX77058, USA
Xiaokun Yang
University of Houston, Clear Lake 2700 Bay Area Blvd Houston, TX77058, USA
ABSTRACT
As Internet of things (IoT) advances, the growth in data volume from wireless sensor networks (WSNs) is explosive and is likely to overwhelm traditional datacenters. Therefore this paper presents a field-programmable gate array (FPGA) design and simulation on a data compression algorithm as a case study. By collecting and compressing raw data from IoT network, the large amount of sen-sor data is dramatically reduced and translated into valuable infor-mation to the servers. Simulation results show that the compression ratio can reach 30.08% with a very low processing latency (20 ms for compressing 1 KB sensor data).
Keywords
Data compression, Field-programmable gate array (FPGA), In-ternet of things (IoT), Wireless Sensor Networks (WSNs)
1. INTRODUCTION
Recent technological breakthrough in low power processing units and communication devices have enabled the development of distributed autonomous nodes able to sense environmental data, compute and transmit it using wireless communication to a base station known as sink for future analysis; thus, forming a wireless sensor network (WSN) [1, 2].
Generally WSN is a wireless network consisting of spatially dis-tributed autonomous devices using sensors to monitor physical or environmental conditions. In mesh type of network, each node relays data for network, and all the mesh nodes cooperate in dis-tribution of data in the network.
In this paper, we employ a specific Bluetooth mesh technol-ogy which enables Bluetooth-equipped devices to receive and act upon messages. The devices also repeat the message to sur-rounding devices thus extending the range of Bluetooth devices and turning it into a mesh network for Internet of things (IoT). In applications such as environmental science, water resources, ecosystems and health care where continuous monitoring of large amount of data, the WSN plays an important role and gen-erates data size of the order of trillions bytes per day on just one edge/fog node. Therefore, it is necessary to design a compression scheme to transmit the data in the network when the aggregate data of network is produced at a rate more than the bandwidth. Compression can be used to reduce the data representation when applications store the data locally so that more data can be re-membered.
Compression could be performed by lossy or lossless techniques. In lossy compression scheme, the bits are reduced by identify-ing unnecessary information and removidentify-ing it. High compression ratios are observed at the expense of moderate accuracy losses in many WSN applications. Lossless technique is a converse of lossy technique. In lossless compression scheme, the bits are reduced by identifying and eliminating statistical redundancy.
There is no information loss and the file can be decompressed to get the original file.
As a case study, we use a lossy compression algorithm to com-press data when sensor accuracy is excom-pressed in terms of margin, and the probability distribution of error is either uniform or un-known [3]. More specifically, the main contributions are:
(1) We presented a synthesizable compression algorithm using which large amount of sensor data can be compressed by an field-programmable gate array (FPGA) engine before sending the data to actual servers. The FPGA used in this project is Anvyl Spartan-6-LX45.
(2) The compression algorithm tries to represent minimum sets of data instead of representing the whole set. This type of com-pression technique is lossy scheme which is explained above. The algorithm takes into consideration of all the possibilities of data and stores only the data is needed.
(3) In order to program the FPGA, we applied Mentor Graphic ModelSim for Simulation, ISE design suite for synthesis, iM-PACT for generating the bit stream and thereby programming the FPGA. We were able to get the compression rate ranging from 30.08% to 85% .
The rest of the paper is organized as follows. In section 2 we describe the relevant work. The compression algorithm and flow chart are described in section 3. In section 4 the design of the al-gorithm is illustrated. In section 5 we describe about the Verilog Simulation. Conclusion is in section 6.
2. RELATED WORK
In WSN the two main elementary activities are data acquisition and transmission. In order to reduce the power associated while transmission various compression schemes such as K-RLE [4], Adaptive Huffman coding [5] and many more [6], in this pa-per we implement the compression algorithm using a low-cost system-on-chip (SoC) architecture proposed in [7, 8].
As a discussion in [9], authors explained about the algorithm that is developed in context of habitat monitoring which achieves a good reduction in the amount of data sets that has to be trans-mitted. It introduces a small amount of error into each reading, bounded by a control knob, the larger the bound on this error, the greater the savings from compression.
The standard is named as compressed data stream protocol (CDP) and is implemented on tinyOS platform using the nesC programming language and TOSSIM simulator. The key fea-tures of this compression scheme is minimizing the protocol overhead and at the same time providing considerable flexibil-ity for complex network data gathering operations where diverse sampling rates and both lossless and lossy compression algo-rithms with different parameters are simultaneously supported. In this approach, CDP can significantly reduce retransmission in noisy WSN, which reduces the data retransmission and the total lower layer packet overhead, thereby reducing the total transmit-ted bytes over the network. Reliability is not being addressed by CDP, as CDP is intended to be a lightweight transport protocol. Furthermore, paper [11] shows how a data compression appli-cation such as collection tree protocol (CTP) is used for data collection from different sensor nodes into the root node and achieve data compression using compression algorithm in order to increase the network lifetime. Similarly, paper [12] presents a way to design/customize a reconfigurable hardware to the tar-get application domain and make the SoC custom-fabricated. While [13] presents the generic IoT device design flow and vari-ous platform choices for IoT devices to efficiently tradeoff cost, power, performance and volume constraints.
3. ALGORITHM
Data reduction before transmission, either by data compression or feature extraction would significantly increase the network life time. In this section, we introduce a low-latency and energy-efficient compression algorithm. It requires less storage com-pared to other techniques. This technique was earlier developed for habitat monitoring that obtains up to 20 to 1 data reduction in the amount of environmental data that needs to be transmitted on certain data sets.
More specifically, letri = (ti, vi)be the inputs from the sen-sors in the network. X-axis represents the time and Y-axis repre-sents the value. We consider the first two points from the input data stream asr0 andr1. The first point is saved az with
X-coordinate oft0and Y-coordinate ofv0. The second data point is
being transformed to a vertical line segment with X-coordinate oft1 and error range ase. Therefore, the Y-coordinate of each
point lies within the range[v1−e, v1+e]. Then the high line is
formed by joining thev1+epoint and thez, similarly the low
line is formed by joining thev1−epoint and thez.U LandLL
represent the high and low points of of the high line and low line att1, respectively.
The next input data point continues to transform into a vertical line segment, we calculate the point of intersection of the high line and low line att2.ulandllrepresent the high and low points
of the new data point asv2+eandv2−e, respectively. Then we
need to update thez,U L, andLLby checking if the new (third) data point is lying inside the region, on the region, or outside the region.
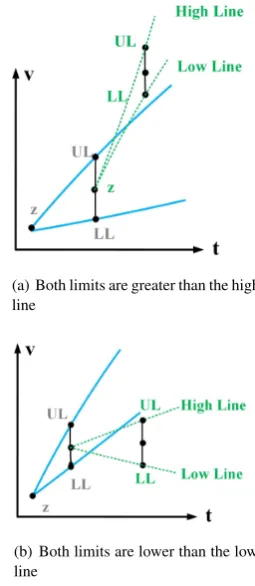
Totally there will be 5 different cases to updatez, in what fol-lows theU LandLLshould be recompute. The first and second cases shown in Fig. 1(a) and Fig. 1(b) are that bothulandllare greater than the high line or lower than the low line. In these two caseszshould be updated. In other words, the previouszcannot represent the new data point so that it will be remembered by hardware buffers/memory, and thenr1will be the newzused to
reform the high line and low line.
From the hardware perspective, the high line and low line slope can be formulated as
SHL=
(v1 +e)−v0
t1−t0 (1) and
SLL=
(v1−e)−v0
t1−t0 . (2)
(a) Both limits are greater than the high line
(b) Both limits are lower than the low line
Fig. 1: Both limits are out of the range – new point cannot be represented by z
Then, the upper limit on the high line at point t2 can be calculated as
HLt2= (t2−t0)×SHL+v0 (3) and the lower limit on the Low Line at point t2 can be calculated as
LLt2= (t2−t0)×SLL+v0. (4) Moreover, Fig. 2(a) shows the case thatulis greater than the high line andllis lower than the high line. Likewise, Fig. 2(b) shows an example thatulis greater than low line andllis less than low line. In the first case the low line should be updated to reduce the compression range; on the contrary the high line should be modified in the second case.
Finally, iful is less than high line andll is greater than low line, which is shown in Fig. 2(c), both the high line and low line should be updated. In sum, for the case in Fig. 2 the new point input can be represented byz so that it can be ignored by the cloud/fog servers.
4. IMPLEMENTATION
In this section, we briefly introduce the sensor prototype and FPGA design structure. In what follows, we focus on the hard-ware description language (HDL) design on the algorithm.
4.1 CSR Mesh
(a) ul out of the range but ll in the range
(b) ul in the range but ll out of the range
(c) Both limits in the range
Fig. 2: At least one point in the range – new point can be represented by z
network from existing Bluetooth smart and smart ready devices. It has a capability to increase the scale of what we can control via our mobile devices. The power consumption is20×less than that of Wi-Fi. Each device (single node) in the network is identified with 128-bit Device UUID.
In our work, we use CSR1010 Bluetooth models to estabilish the mesh network involving one IoT host/server and three humid-ity sensors. The mesh control protocol is used to send control and status messages to devices organized in mesh network. The mesh protocol is used to associate devices to the specific net-work. More important, the CSR mesh has the ability to overlay networks in the same building by which we can have more flex-ibility over facilities network, employee network and individual room networks during deployment of this mesh technology.
4.2 FPGA Structure
In addition, we perform the compression ratio display on an An-vyl FPGA board. The AnAn-vyl development board is based on Xil-inx Spartan 6 XC6SLX45-CSG48 FPGA with a speed grade of -3. On the board 6 7-segment displays are multiplexed to get the output illuminated in each specific display. The 4 most signifi-cant displays are used as the input data counters, and the 2 least significant displays are applied as the output data timers. A scanning display circuit is used to show a 2-digit number on each display. This circuit drives the cathode signals and corre-sponding anode patterns of each digit in a continuous succession,
at an update rate which is faster than the human eye response. Each digit is illuminated just one-sixth of the time, but the digit appears continuously illuminated. In order to find all the 6 digits to appear continuously illuminated, each digit has to be driven once in every 1 to 16 ms at a refresh frequency of 1 KHz to 60 Hz.
Moreover, in this work we employ ISE design suite for synthe-sizing our Verilog code and ISE iMPACT for deploying the code on the FPGA. ISE webpack edition offers HDL synthesis and simulation, implementation, device fitting and JTAG program-ming. During synthesis and implementation in ISE design suite, a “.bit” file is generated from the Verilog code and this “.bit” file can then be used to program the FPGA. The FPGA can be pro-grammed over the USB JTAG at port J12 using Xilinx’s iMPACT software or Digilent Adept software.
4.3 HDL Design
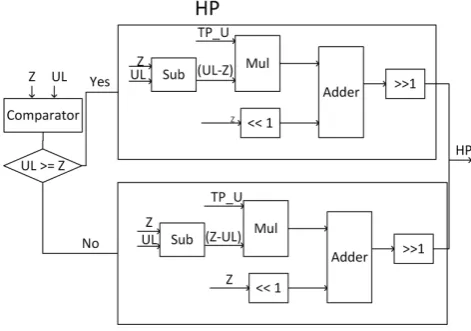
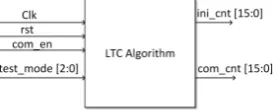
In cases where data has to be transmitted over the network, it is preferable to transmit less amount data for a good net-work life time. This could be achieved by data compression lo-cally before the transmission. Compression helps in reducing the data storage space and transmission capacity. As shown in Fig. 3, the compression design structure involves 4 inputs, clock (clk), reset (rst), compression enable (com en), and test mode (test mode[2:0]) signals. Additionally there are 2 output inter-faces, “ini cnt[15:0]” and “com cnt[15:0]”, which are used to monitor the initial data count and compressed data count. The main function of the design under test (DUT) is the high line intercept point (HP) and low line intercept point (LP) de-scription. LetHP denotes the intercept of high line with the next dataset, and similarly theLPrepresents the intercept of low line with the next dataset. Hence, the HP can be calculated as:
HP =T P
T U ×(U L−v0) +v0 (5)
and the LP can be written as:
LP =T P
T L ×(LL−v0) +v0 (6)
where “TP” is the time at which the new dataset is available, “TU” is the time at which the “UL” is obtained, and “TL” is the time at which “LL” is obtained. From the hardware design per-spective, Fig. 4 and Fig. 5, respectively, show the design structure of HP and LP computation.
Fig. 3: Compression block structure
Fig. 5: Low Line point Calculation
5. EXPERIMENTAL RESULTS
In this section, the compression performance is estimated as compression ratio and processing latency. Furthermore, the hard-ware cost of the display logic is collected. Finally, we show the demo on the Anvyl Spartan 6 FPGA board.
Compression ratio:Compression ratio is the only factor which determines the good compression algorithm suitable to WSNs. In WSNs, higher compression means less amount of data has to be transmitted or stored. Basically, the compression rate can be calculated as
CompressionRatio= 1−CompressedSize
OriginalSize (7)
Processing efficiency:The system has been designed using Ver-ilog HDL. We simulated the DUT in Mentor Graphic ModelSim for checking the results. Fig. 6 shows the simulation waveform. Additionally we also design a monitor in the test bench to count the number of both input and output data, monitor the time con-sumption, and auto-compute the compression rate. As an exam-ple shown in Fig. 7, in this test vector, we achieves a 30% data compression for processing 1024 Bytes data and spends 20 ms calculation latency.
Fig. 6: Simulation waveform
Fig. 7: Simulation results shown in the transcript window
FPGA demo and slice count:In what follows, a relatively low cost Anvyl development board having configuration as Spartan 6 XC6SLX45-CSG484 FPGA with a speed grade of -3 has been chosen for implementing this project. All the sensor data is given as inputs to the FPGA board, and an energy efficient compression algorithm is developed for compressing the sensor data before sending it to the actual server.
To get clear results of the compression implementation, a seven segment display is designed and programmed on the FPGA board. First of all, a simulation was run to check the waveform of Verilog code for implementing the seven segment display. The ISE design suite is used to generate the “*.bit” file during simu-lation. For configuration, the program searches for all the “*.bit” files inside the folder. The FPGA configuration has been done using Xilinx iMPACT.
After simulation and implementation, the slice count used is found to be 34 out of 27288 and as stated above the speed of anvyl board is of grade -3. Figure 8 shows the desired number specified in the Verilog code is been displayed on the seven seg-ment display.
6. CONCLUSION AND FUTURE WORK
In this paper, we proposed a way to compress sensor data be-fore actually transmitting it to the fog/cloud servers. The algo-rithm is designed in Verilog HDL and verified using Mentor Graphic ModelSim. We have also synthesized and implemented the seven segment display on the Anvyl Spartan 6 Xilinx devel-opment board. Simulation results showed a reduction of the data size (30.08%) and a fast processing speed (20ms for 1 KB data) based on the design.
Future scope for this paper would be integrating the compression algorithm on FPGA board with the mesh network. Instead of controlling the mesh network by software, the FPGA board will be employed as a part of the smart fog/edge computing edge.
7. REFERENCES
[1] X. Liu, J. Zhou, C. Wang, etc. “An Ultralow-Voltage Sensor Node Processor With Diverse Hardware Acceleration and Cognitive Sampling for Intelligent Sensing”, IEEE Trans. on Circuits and Systems-II: Express Briefs, Vol. 62, No. 12, PP. 1149 - 1153, Aug. 2015
[2] M. Fan, Q. Han, and X. Yang,“Energy Minimization for On-Line Real-Time Scheduling with Reliability Awareness”, Journal of Syst. and Software, Vol. 127, PP. 168-176, May 2017.
[3] H. P. Medeiros, M. Maciel, R. Souza, and M. Pellenz “Lightweight Data Compression in Wireless Sensor Net-works Using Huffman Coding”, Intl. Journal of Distributed Sensor Networks, PP. 1550-1477, Jan. 2014.
[4] E. Capo-Chichi, H. Gyennet, and J. Friedt, “K-RLE : A new Data Compression Algorithm for Wireless Sensor Net-work”, 2009 3rd Intl. Conference on Sensor Technolo-gies and Applications (SENSORCOMM2009), PP. 502– 507, Aug. 2009
[5] M. Yuanbin, Q. yubing, L.Jizhong, L.Yanxia “A Data Com-pression Algorithm Based On Adaptive Huffman Code for Wireless Sensor Networks”, 2011 4th Intl. Conference on Intelligent Computation Technology and Automation (ICI-CTA2011), April 2011
[6] B. Ying, “An Energy-Efficient Compression Algorithm for Spatial Data in Wireless Sensor Networks”, 2016 18th Intl. Conference on dvanced Communication Technology (ICACT2016), PP. 515–426, March 2016
[7] X. Yang and J. Andrian,“A High Performance On-Chip Bus (SBUS) Design and Verification”,IEEE Trans. Very Large Scale Integr. (TVLSI) Syst., vol. 23, no. 7, pp. 1350–1354, July 2014.
[8] X. Yang and W. Wen,“Design of A Pre-Scheduled Data Bus for Advanced Encryption Standard Encrypted System-on-Chips”,2017 22nd Asia and South Pacific Design Automa-tion Conference (ASP-DAC2017), pp. 506-511, Jan. 2017. [9] T. Schoellhammer, B. Greenstein, E. Osterweil, M.
Wim-brow, and D. Estrin, “Lightweight Temporal Compression of Microclimate Datasets”, 2004. 29th Annual IEEE Intl. Con-ference on Local Computer Networks, PP. 515–426, Dec. 2004.
[10] Y. Liang and N. Erratt “Compressed Data – Stream col: An Energy Efficient Compressed Data – Stream Proto-col for Wireless Sensor Networks”, 2011 IET Communica-tions, Vol. 5, No. 18, PP. 2673 – 2683, Dec. 2011.
[11] R. Sharma, “A Data Compression Applications for Wire-less Sensor Networks Using LTC Algorithmic”, 2015 IEEE Intl. Conference on Electro/Information Technology (EIT), PP. 598–604, Oct. 2015.
[12] K. Compton and S. Hauck “Automatic Design of Reconfig-urable Domain-Specific Flexible Cores”, IEEE Trans. Very
Large Scale Integr. Syst. (TVLSI), Vol. 16, No. 5, PP. 493-503, May 2008.
[13] D. Chen, J. Cong, S. Gurumani, etc. “Platform Choices and Design Demands for IoT Platforms: Cost, Power, and Performance Tradeoffs”, IET Journals, Vol. 1, No. 1, PP. 70–77, Dec. 2016.
[14] I. Beretta, V. Rana, D. Atienza, and D. Sciuto “A Mapping Flow for Dynamically Reconfigurable Multi-Core System-on-Chip Design”, IEEE Trans. Comput.-Aided Design In-tegr. Circuits Syst. (TCAD), Vol. 30, No. 8, PP. 1211-1224, Aug. 2011