Available online at http://www.ijabbr.com
Corresponding Author E-mail: [email protected] 583 | Page
Evaluation of genotype × environment interaction in chickpea genotypes using
path analysis
Ezatollah Farshadfar*1, Elham Mahtabi2, Mohammad Mahdi Jowkar2
1
Campus of Agriculture and Natural Resources, Razi University, Kermanshah, Iran 2
Department of Agronomy and Plant Breeding, Kermanshah Branch, Islamic Azad University, Kermanshah, Iran
ABSTRACT
Chickpea (Cicer arietinum L.) is one of the most important crops worldwide that is a subject of many plant breeding programs in many countries. In addition, climates are changing all over the world and drought becomes one of the most serious problems versus yield of crops. In order to screen drought tolerant genotype in Chickpea, twenty genotypes were tested under rainfed and irrigated conditions in the experimental field of College of Agriculture, Razi university, Kermanshah, Iran during 2008- 2011 growing seasons. Descriptive diagrams of hundred seed weight (HSW), number of pod per plant (NPPL), number of seed per pod (NSPO) and grain yield (GY) exhibited high GE interaction and variability between the investigated characters indicating possible selection of drought tolerant and stable entries. Analysis of variance revealed highly significant differences (P<0.01) between the genotypes and environments exhibiting genotypic diversity and variability between genotypes and environments. GE interaction was highly significant for HSW and NPPL but non-significant for GY and NSPO. Based on mean comparisons of GY, HSW, NPPL and NSPO, 2, 7, 8 and 3 classes of genotypes were found, respectively. The results extracted from path analysis over environments showed the contributions of NSPO (=0.82), HSW (=0.54) and NPPL (=0.12) on adaptability of grain yield, therefore the most contribution was attributed to number of seed per pod in the phenotypic stability of grain yield.
Key words: Chickpea, Genotype × environment interaction. Path analysis
INTRODUCTION
584 | Page potential with regard to increase yield is the main goal of many chickpea breeding programs (Robertson et al, 1997; Collard et al, 2003). Drought is one of the most serious problems versus yield of crops all over the world and different changing climates. Nowadays, scientists are trying to understand and assess of mechanisms that plants use to overcome drought stress by application of several approaches (Reyazul et al, 1997; Farshadfar et al, 2013). Interaction between genotype (G) and environment (E) often reduce association between genotype and phenotype because of environment interfering. These interactions make some kind of complexity in plant breeding programs so selecting one superior genotype for some climates is a hard issue. To meet this challenge, it is essential to examine genotypes in several environments to determine their genetic potential (Yaghoutipor and Farshadfar, 2007). Both parametric and non-parametric statistical methods are used to study of interaction between G and E (Mohammadi et al, 2010). Path analysis is one of the most popular multivariate techniques in statistics science. Path analysis is a form of factor analysis that is similar to principal component method (Darvishzadeh et al, 2011; Zobel et al, 1988). This model is one of the most effective approaches to analysis of genotype and phenotype correlations lead to understand direct and indirect traits effects on yield as a complex trait. Such a complex characteristic in crop plants is a result of several physiological factors during growth (Grafius and Thomas, 1971). This complexity nature of yield trait is a main reason that we study its components instead of yield (Farshadfar et al, 2012). For example, number of heads per plant, kernel per head and kernel weight are components for grain yield so understanding sequential relationship between them and yield is essential to investigate a model to yield trait (Tai, 1975).The objectives of the present investigation were (1) assessment of phenotypic stability of different chickpea genotypes under stress and non-stress conditions and (2) determination of the contribution of yield components in the phenotypic stability of seed yield
MATERIALS AND METHODS
Plants Genetic Materials and Experimental Design
585 | Page Statistical analaysis
Analysis of variance and comparison of means with Tukey test were performed using SAS (2003) software. The path analysis was done by SPSS software. The model of path analysis is as follows:
Wij=µwi+V1iR1j+V2iR2j+V3iR3j+eij
Where the observed yield (Wij) is composed of mean genotypic effect (µwi), genotype environment interaction effects (V1i,V2i and V3i), environmental components (R1j, R2j and R3j) and error deviate (eij).Vgi in this formula is the variance of yields of genotype (Tai, 1975, 1979; Tai et al, 1994).
RESULTS AND DISCUSSION
Descriptive diagrams
Descriptive diagrams of the measured traits (Fig. 1) showed GE interaction and high variability for all traits. GY variation was high for genotypes 12 and 17, while low for 8 and 19. Very low GE interaction was found for GY in environment 2 (Fig. 1a) indicating specific adaptation of GY in this environment. Interaction between genotype and environment of HSW was lower than that of GY and almost the same for all genotypes with a little higher in genotypes 1 and 9 (Fig. 1b). The variation and genetic interaction for NPPL trait (Fig. 1c) was higher than HSW but lower than GY. Genotypes 11 and 13 displayed lower variation in comparison to other genotypes, hence they are more stable. Variation of environments 4 and 5 was lower than others and this variation is almost similar in three initial environments. Descriptive diagram for NSPP (Fig. 1d) showed very low variation among genotypes. Only genotypes 6 and 13 showed a little higher variation among others. Farshadfar et al, (2012) showed different values of variability and GE interactions Between 14 genotypes of bread wheat (Triticum aestivum L.) in six environments for yield and yield components.
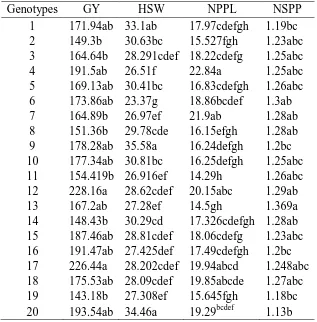
Analysis of variance and mean comparisons
586 | Page and NSPO, respectively. Observed variability among genotypes was higher for HSW and NPPL. Genotypes 1, 9 and 20 occupied first class for HSW, exhibited higher values, and others located in classes 2 to 7. Genotypes 4, 7, 12, 17 and 18 showed maximum value of NPPL locating in the first class with significant differences with other genotypes. There were three classes for NSPO, hence low variability was found in this trait for all 20 genotypes.
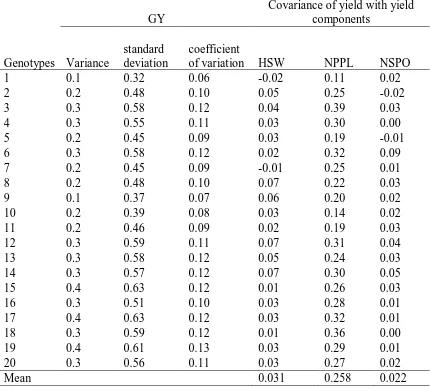
Covariance of yield with other characters
Successful application of genotypic and phenotypic variances to study of complex traits such as yield depends on the attitude of researcher (Mehdi, 1986).
Genetic covariance between yield and another trait shows that selection on yield will affect response to selection on the other (Guillaume and Whitlock, 2007). The results revealed higher phenotypic covariance between NPPL and GY with the average of 0.25 followed by HSW (0.033) and NSPO (0.022). Variance, standard deviation and coefficient of variation for each genotype are indicated in Table 4. High values of genetic and/or phenotypic covariance between two traits may represent a high level of variation that can be very useful in plant breeding programs.
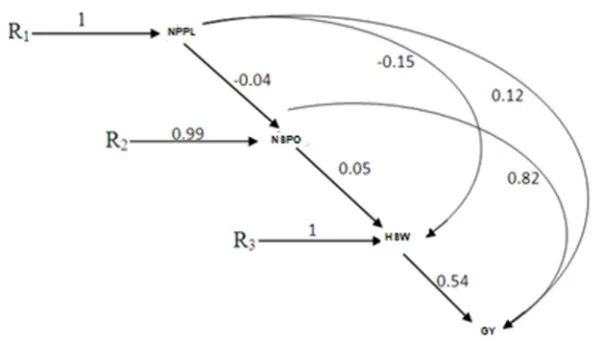
Path analysis over environments
Generally, the aim of path analysis is using correlation matrix or covariance of fewer factors for interpretation of variance. Path analysis for different environments is shown in Fig. 2. As it can be seen from this Figure, direct effect of NSPO on GY (0.82) is greater than HSW (0.54) and NPPL (0.12). Falak et al, (2003) reported the same results. Indirect effect of NPPL through HSW was higher than direct effect (0.56) but the conditions were different for NSPP by lower indirect effect of (0.59). Among V1, V2 and V3 that are considered as genotypic components for each genotype, V2 showed higher values followed by V3. Therefore relative contribution of number of seed per pod (NSPO) in the phenotypic stability of GY is higher than HSW (V3) and NPPL (V1). Environmental components of genotype × environment interaction exhibited that absolute value of r1 and r3 in all environments was higher than r2 indicating that sensitivity of NPPL and HSW to the environmental variation was higher than NSPL. Therefore high grain yield and stability of chickpea genotypes were because of higher genotypic component V2 (NSPO) and lower environmental components r2 (NSPP).
Conclusion
587 | Page REFERENCES
Collard, B.C.Y., Pang, E.C.K., Ades, P.K., Taylor, P.W.J. (2003). Preliminary investigation of QTLs for seedling resistance to ascochyta blight from Cicer echinospermum, a wild relative of chickpea. Theoretical Applied Genetic, 107:719 –729.
Darvishzadeh, R., HatamiMaleki, H., Sarrafi, A. (2011). Path analysis of the relationships between yield and some related traits in diallel population of sunflower (Helianthus annuus L.) under well-watered and water-stressed conditions. Australian Journal of Crop Science, 5 (6): 674-680.
Falak, N., Ashraf, M., Ghafoor, A. (2003). Path analysis and relationship among quantitative traits in chickpea (Cicer arietinum L.). Pakistan Journal of Biological Science, 6 (6): 551-555. FAO. (2004). Food and Agriculture Organization of the United Nations, Rome, Italy.
Farshadfar, E., Rasoli, V., Mohammadi, R., Veisi, Z. (2012). Path analysis of phenotypic stability and drought tolerance in bread wheat ( Ttiticum aestivum L.). International Journal of Plant Breeding, 6(2): 106-112.
Farshadfar, E., Sutka, j. (2006). Biplot analysis of genotype-environment interaction in durum wheat using AMMI model. Acta Agronomica Hungarica, 54(4): 459-467.
Farshadfar, E., Haghparast, R., Qaitoli, M. (2008). Chromosomal localization of the genes controlling agronomic and physiological indicators of drought tolerance in barley using disomic addition lines. Asian Journal of Plant Science, 7(6): 536-543.
Farshadfar, E., Mohammadi, R., Mohsen Farshadfar, M., Dabiri, S.H. (2013). Relationships and repeatability of drought tolerance indices in wheat-rye disomic addition lines. Australian Journal of Crop Science, 7(1):130-138.
Grafius, J. E., Thomas, R.L. (1971). The case for indirect genetic control of sequential traits and the strategy of deployment of environmental resources of the plant. Heredity, 26: 433-442.
Guillaume, F., Whitlock, M. C. (2007). Effects of migration on the genetic covariance matrix. Journal of Evolutionary Biology, 61:2398–2409.
Mehdi, S.S. (1986). Predicted response to S1 selection for yield and disease resistance traits in two sunfower populations. Ph.D. Thesis, South Dakota State Univ., Brookings, SD, U.S.A.
588 | Page Reyazul, R.M., Zaman-Allah, M., Sreenivasulu, N., Trethowan, R., Varshney, R.K. ( 2012). Integrated genomics, physiology and breeding approaches for improving drought tolerance in crops.Theoretical Applied Genetic. DOI 10.1007/s00122-012-1904-9.
Robertson, L.D., Ocampo, B., Singh, K.B. (1997). Morphological variation in wild annual Cicer species in comparison to the cultigen. Euphytica, 95: 309-319.
Singh, K.B., Reddy, M.V. (1994). Registration of eight ascochyta blight-resistant, early-maturing, large-seeded chickpea germplasms. Crop Science, 34:1416–1417.
Sudupak, M. A., Akkaya, M.S., Kence, A. (2002). Analysis of genetic relationships among perennial and annual Cicer species growing in Turkey using RAPD markers. Theoretical Applied Genetic, 105:1220–1228.
Tai, G.C.C. (1975). Analysis of genotype-environment interactions based on the method of path coefficient analysis. Canadian Journal of Genetic and Cytology, 17: 141 – 149.
Tai, G.C.C. (1979). Analysis of genotype environment interaction of potato yield. Crop Science, 19: 434 – 438.
Tai, G.C.C., Levy, D., Coleman, W.K. (1994). Path analysis of genotype-environment interaction of potatoes exposed to increasing warm climate. Euphytica, 75:49-61.
Yaghotipoor, A., Farshadfar, E. (2007). Non-parametric estimation and component analysis of phenotypic stability in chickpea (Cicer aritinum L.). Pakistan journal of biological science, 10: 2646-2648.
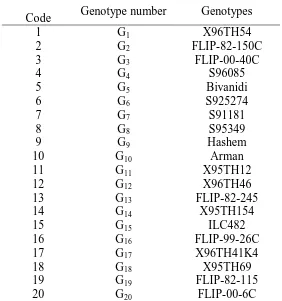
589 | Page Table: List of chickpea genotypes under investigation
Genotypes Genotype number Code X96TH54 G1 1 FLIP-82-150C G2 2 FLIP-00-40C G3 3 S96085 G4 4 Bivanidi G5 5 S925274 G6 6 S91181 G7 7 S95349 G8 8 Hashem G9 9 Arman G10 10 X95TH12 G11 11 X96TH46 G12 12 FLIP-82-245 G13 13 X95TH154 G14 14 ILC482 G15 15 FLIP-99-26C G16 16 X96TH41K4 G17 17 X95TH69 G18 18 FLIP-82-115 G19 19 FLIP-00-6C G20 20
Table 2: Analysis of variance for yield and yield components.
Source df GY HSW NPPL NSPP
Replication 2 7689.527ns 4.906ns 13.629ns .071ns
Environment 5 460591.2** 179.272** 3746.125** 0.137**
Genotype 19 9668.1** 148.4** 96.6** 0.047**
Environment ×
Genotype 95 2987.2ns 12.952** 16.573** 0.012ns
Error 238 2820.961 7.032 10.68 0.015
590 | Page Table 3: Mean comparison of yield and yield component
Genotypes GY HSW NPPL NSPP
1 171.94ab 33.1ab 17.97cdefgh 1.19bc 2 149.3b 30.63bc 15.527fgh 1.23abc 3 164.64b 28.291cdef 18.22cdefg 1.25abc
4 191.5ab 26.51f 22.84a 1.25abc
5 169.13ab 30.41bc 16.83cdefgh 1.26abc 6 173.86ab 23.37g 18.86bcdef 1.3ab
7 164.89b 26.97ef 21.9ab 1.28ab
8 151.36b 29.78cde 16.15efgh 1.28ab 9 178.28ab 35.58a 16.24defgh 1.2bc 10 177.34ab 30.81bc 16.25defgh 1.25abc 11 154.419b 26.916ef 14.29h 1.26abc 12 228.16a 28.62cdef 20.15abc 1.29ab
13 167.2ab 27.28ef 14.5gh 1.369a
591 | Page Table 4: Variance, standard deviation , coefficient of variation and covariance of yield
and yield components
GY
Covariance of yield with yield
components
Genotypes Variance
standard deviation
coefficient
of variation HSW NPPL NSPO
1 0.1 0.32 0.06 -0.02 0.11 0.02
2 0.2 0.48 0.10 0.05 0.25 -0.02
3 0.3 0.58 0.12 0.04 0.39 0.03
4 0.3 0.55 0.11 0.03 0.30 0.00
5 0.2 0.45 0.09 0.03 0.19 -0.01
6 0.3 0.58 0.12 0.02 0.32 0.09
7 0.2 0.45 0.09 -0.01 0.25 0.01
8 0.2 0.48 0.10 0.07 0.22 0.03
9 0.1 0.37 0.07 0.06 0.20 0.02
10 0.2 0.39 0.08 0.03 0.14 0.02
11 0.2 0.46 0.09 0.02 0.19 0.03
12 0.3 0.59 0.11 0.07 0.31 0.04
13 0.3 0.58 0.12 0.05 0.24 0.03
14 0.3 0.57 0.12 0.07 0.30 0.05
15 0.4 0.63 0.12 0.01 0.26 0.03
16 0.3 0.51 0.10 0.03 0.28 0.01
17 0.4 0.63 0.12 0.03 0.32 0.01
18 0.3 0.59 0.12 0.01 0.36 0.00
19 0.4 0.61 0.13 0.03 0.29 0.01
20 0.3 0.56 0.11 0.03 0.27 0.02
592 | Page (a)
(b)
(c)
(d)