Received 7 April 2015; revised 11 June 2015 and 25 August 2015; accepted 23 September 2015. Date of publication 16 October 2015; date of current version 22 October 2015.
Digital Object Identifier 10.1109/JTEHM.2015.2485261
A Transform-Based Feature Extraction Approach
for Motor Imagery Tasks Classification
HAMZA BAALI1, AIDA KHORSHIDTALAB2, MOSTEFA MESBAH3,4,
AND MOMOH J. E. SALAMI2, (Senior Member, IEEE)
1Malaysia Industry Transformation, Technology Park Malaysia, Kuala Lumpur 57000, Malaysia 2Intelligent Mechatronics System Research Unit, Department of Mechatronics Engineering,
International Islamic University Malaysia, Kuala Lumpur 50728, Malaysia
3Department of Electrical and Computer Engineering, Sultan Qaboos University, Muscat 123, Oman 4School of Computer Science and Software Engineering, The University of Western Australia, Perth, WA 6009, Australia
CORRESPONDING AUTHOR: H. BAALI ([email protected])
ABSTRACT In this paper, we present a new motor imagery classification method in the context of electroencephalography (EEG)-based brain–computer interface (BCI). This method uses a signal-dependent orthogonal transform, referred to as linear prediction singular value decomposition (LP-SVD), for feature extraction. The transform defines the mapping as the left singular vectors of the LP coefficient filter impulse response matrix. Using a logistic tree-based model classifier; the extracted features are classified into one of four motor imagery movements. The proposed approach was first benchmarked against two related state-of-the-art feature extraction approaches, namely, discrete cosine transform (DCT) and adaptive autore-gressive (AAR)-based methods. By achieving an accuracy of 67.35%, the LP-SVD approach outperformed the other approaches by large margins (25% compared with DCT and 6 % compared with AAR-based methods). To further improve the discriminatory capability of the extracted features and reduce the com-putational complexity, we enlarged the extracted feature subset by incorporating two extra features, namely, Q- and the Hotelling’sT2statistics of the transformed EEG and introduced a new EEG channel selection method. The performance of the EEG classification based on the expanded feature set and channel selection method was compared with that of a number of the state-of-the-art classification methods previously reported with the BCI IIIa competition data set. Our method came second with an average accuracy of 81.38%. INDEX TERMS Brain-computer interface, channel selection, feature extraction, linear prediction, orthogonal transform.
I. INTRODUCTION
The aim of Brain-computer interface (BCI) is to set a direct communication link between the brain and an external elec-tronic device whereby brain signals are translated into useful commands. Such communication link would assist people suffering from severe muscular (motor) disabilities, due to diseases or accidents, with an alternative means of com-munication and control that bypass the normal output path-ways [1]–[3]. BCI systems comprise three categories: active (asynchronous), reactive (synchronous) and passive [2], [3]. In the first category, the user consciously controls the interface independently from any external cues or temporal constraints. In the second category, the user executes the required mental task as a response to an external stimulation.
In the last category, the BCI derives its outputs from arbitrary brain activity without the purpose of voluntary control. Most of the aforementioned BCI systems rely on classification algorithms based on EEG signals to identify the user’s mental state [2], [3].
In the last few decades, there has been an increased research effort devoted to improve the performances of BCI systems. Despite this effort, an efficient way of accu-rately predicting motor imagery tasks (user intention) using EEG signal remains elusive. In this paper, we focus on two important sub-components of BCI systems, namely feature extraction and channel selection. The first sub-component deals with the process of identifying a set of signal features that are effective in discriminating between different classes 2168-23722015 IEEE. Translations and content mining are permitted for academic research only.
of interest. The second sub-component is a type of feature selection that addresses the problem of finding the most infor-mative subset of channels from which the features should be extracted.
Commonly used methods for feature extraction can be grouped into the following categories: 1) time domain meth-ods that compute quantities from the time domain such as the mean, the variance and the Hjorth parameters [4], [5], 2) parametric model-based techniques such as autoregressive model (AR) adaptive autoregressive (AAR) model and multivariate autoregressive (MVAR) model [6]–[9], 3) trans-form methods such as discrete cosine transtrans-form (DCT), principal component analysis (PCA), linear discriminant analysis (LDA), wavelet transform (WT) [9]–[16], and Common spatial subspace decomposition (CSSD) [17] 4) frequency-based techniques that extract features from the frequency domain such as spectral edge frequency, frequency of the maximum spectral power and signal power within a given frequency band [18] and 5) time-frequency parame-ters such as thel2-norm of the interpolated spectra between preselected reactive frequency bands [19]. A good review of the different feature extraction approaches proposed in the context of BCI can be found in [20].
Transform based approaches form an important class of feature extraction techniques. Their goal is to find a more compact lower-dimensional representation in which most amount of the data energy is packed in the fewest number of uncorrelated coefficients. By eliminating irrelevant features (transform coefficients), these methods allow extracting effective features that preserve the generalization performance while lessening the computational complexity in the classification stage [21].
Transform based approaches for feature extraction can be subdivided into linear and nonlinear, supervised and unsupervised signal dependent and signal independent
methods. The widely used linear techniques are
PCA and LDA. The first one is unsupervised and aims at maximizing the variance of the projected data, using the eigenvectors of the sample covariance matrix, onto a low-dimensional subspace called principal subspace. In con-trast, the latter is supervised and attempts to find a linear mapping that maximizes linear class separability of the data in a low-dimensional space [22]. To reduce the amount of computation and avoid the curse of dimensionality in case of multi-channel data, feature extraction is sometimes combined with channel selection. Algorithms for channel selection can be divided into two main categories: Filter-based and wrapper-based. Filter-based methods select the best channels using performance criteria that are unrelated to the applied classifier. Wrapper-based methods, on the other hand, use the performance of the classifier as indication measure of how good the selected channels are [23] and [24].
Recently, the authors introduced a signal-dependent linear orthogonal transform, referred to as LP-SVD transform [25]. The transform has the advantage of forming the transforma-tion matrix using only the AR model parameters instead of the
data samples as in the case of PCA. This transform is used in this paper to map EEG data into a new domain where only a few spectral coefficients (also called transform coefficients, expansion coefficients or scores) contain most of the signal’s energy. A subset of these transform coefficients in conjunc-tion with the LP coefficients and the error variance were used as features in the classification of EEG into four class motor imagery movements. In addition, a wrapper-based channel selection method was described, in which channels are added based on their contribution to the overall accuracy of the classifier. The feature selection method was validated using BCI IIIa competition dataset and its discrimination capability between the different classes was assessed against a number related state-of-the-art approaches including BCI competition III winners.
The rest of the paper is organized as follows. Section 2.1 describes the EEG data, its acquisition procedure, and pre-processing. Section 2.2 introduces the LP-SVD transform and details the process of feature extraction. Section 2.3 outlines the channel selection approach, describes the applied classi-fier and the cross-validation procedure. Section 3 deals with performance analysis by comparing the proposed technique to those of a number of state-of-the-art approaches.
II. MATERIALS AND METHOD
A. EEG DATA COLLECTION AND PRE-PROCESSING
The dataset IIIa from the BCI competition III (2005) [26] was used to evaluate the effectiveness of the proposed feature extraction and classification approaches. It is a widely used benchmark dataset of multiclass motor imagery movements recorded from three subjects; referred to as K3b, K6b and L1b. The multichannel EEG signals were recorded using a 64-channel Neuroscan EEG amplifier (Compumedics, Charlotte, North Carolina, USA). Only 60 EEG channels were actually recorded from the scalp of each subject using 10-20 systems and referential montage. The left and right mastoids served as reference and ground respectively. The recorded signal was sampled at 250 Hz and filtered using a bandpass filter with 1 and 50 Hz cut-off frequencies. A notch filter was then applied to suppress the interference due to power line. During the experiments, each subject was instructed to perform imagery movements asso-ciated with visual cues. Each trial started with an empty black screen att=0 seconds. At time pointt =2 seconds, a short beep tone was presented and a cross ‘+’ appeared on the screen to raise the subject’s attention. Att = 3 seconds, an arrow pointed to one of the four main directions (left, right, upwards or downwards) was presented. Each of the four direction indicated by this arrow instructed the subject to imagine one of the following four movements: left hand, right hand, tongue or foot, respectively. The imagination process was performed until the cross disappeared att =7 seconds. Each of the four cues was randomly displayed ten times in each run. No feedback was provided to the subject. The recorded dataset from subject K3b consists of 9 runs, while the ones from K6b and L1b consist of 6 runs each, which
resulted in 360 (9 × 10 × 4) trials for subject K3b and 240 (6×10×4) trials for each of the other two subjects.
B. LP-SVD BASED FEATURE EXTRACTION
This section discusses the design of the LP-SVD transform and describes the dimensionality reduction stage (feature selection). For comparison purposes, we then briefly intro-duce the DCT which is a widely used unsupervised signal independent linear feature extraction method.
1) THE LP-SVD TRANSFORM
The LP-SVD transform is constructed using a two-step pro-cess, namely the estimation of LPC filter coefficients and the computation of the left singular vectors of LPC filter impulse response matrix using SVD.
Linear prediction (LP) is a time series analysis method that has found wide applications in a number of signal processing applications including signal modeling, compres-sion, and feature extraction [27]. In the frequency domain, LP minimizes the distance between an all pole (representing the signal model) spectrum and the actual spectrum of the signal. In the time domain, this is equivalent to predicting the current value of the signal,y(n), based on a linear combina-tion of itsPpast samples, namely,y(n−i)fori=1, . . . ,P, which can be mathematically expressed as:
y(n)= − P
X
i=1
aiy(n−i)+e(n) , (1) where,ai are the linear prediction coefficients (LPCs),Pis the prediction order and e(n)is the prediction error or the prediction residual. Equation (1) can be expressed in a more compact form using the following matrix notations:
y=He, (2)
wherey= [y(1) , . . . ,y(N)]T ande=[e(1) , . . . ,e(N)]T are respectively the N × 1 columns vectors of the signal samples and the prediction residual, whileH is theN ×N impulse response matrix of the synthesis filter (also called LPC filter) whose entries,h(n), are completely determined by the linear prediction coefficientsai.His a lower triangular and Toeplitz matrix of the form:
H= 1 0 · · · · 0 h(1) 1 ... · 0 ... ... ... · ... · · · · · h(N−1) h(N−2) · · 1 , (3)
where the entries ofHare given by:
h(n)= δ (n)− P X i=1 aih(n−i), for 0≤n≤N −1 0, elsewehere (4)
andδ (n)is the discrete Dirac function.
Applying the singular value decomposition (SVD) to H
gives:
y=UDVTe (5)
UandV are theN×N orthogonal matrices containing the left and right eigenvectorsH,Dis theN×Ndiagonal matrix of singular values [28].
We define the transformation that maps the measurement vector (y) to a feature vector (θ) as:
θ=UTy (6)
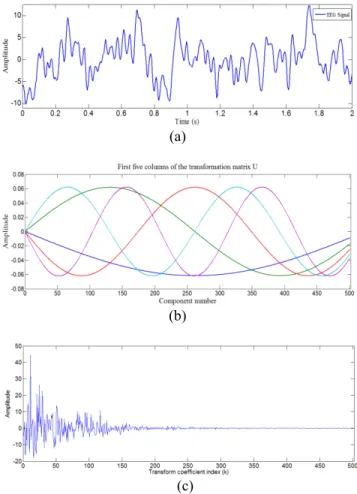
It is important to note that the transform operation (UTy) by itself does not achieve any dimensionality reduction. It only decorrelates and packs a large fraction of the signal energy into a relatively few transform coefficients as shown in Fig.1.
FIGURE 1. Signal transformation using LP-SVD: (a) Original EEG signal trace from subject L1b, (b) Exemplary basis functions (c) Transform coefficients with AR(1) as a signal model.
Our approach for feature reduction involves the extraction of features from each EEG segment that include the LP coef-ficients (ai), the prediction error variance (Vr), theQ-statistic and the Hotelling’sT2statistic of the transformed signal in addition to a subset of significant transform coefficients ofθ. These features are described below.
2) LP COEFFICIENTS AND ERROR VARIANCE
According to above LP analysis, the EEG vector is described in terms of all-poles filter coefficients and the prediction error. There are two classical approaches used to solve for the LP parameters, namely the autocorrelation and the covariance methods. The autocorrelation method guarantees the stability of the filter and allows the efficient Levinson-Durbin recur-sion to be used to estimate the model parameters [27]. Once the coefficients are estimated, the prediction error sequence can be computed using (1). The estimate of the prediction errore(n) variance is given by:
Vr= 1 N −1 N X n=1 (e(n)− ¯e)2, (7)
where e¯ is the arithmetic mean of the prediction error vectoreandNis its length.
3) Q- AND HOTELLING’ST2STATISTICS
Letbybe the best approximation, in the least squares sense,
of y on the subspace S spanned by the basis vectors
{u1,u2, . . . ,ur}associated with therlargest singular values of the impulse response matrixH; that is:
by=UbUb T y, (8) where b U =(u1,u2, . . . ,ur)
The approximation error vectord =y−
byis orthogonal to s∈S(i.e.,hd,si =0 for everys∈S). The subspace spanned byUbis referred to as the signal space while its orthogonal
complimentDis called the error space.
The Q-statistic, sometimes referred to as the squared pre-diction error (SPE), measures the error between the vectory
and its dimensionally reduced versionby. It is mathematically expressed as [29]: Q= ky− byk 2 =yT(I− b UUb T )y (9)
There are several ways of selecting the reduced set of the r uncorrelated variables. In this study, we heuristically chooserto be 10% of the number of basis vectorsui.
The Hotelling’sT2statistic measures the overall variability in the transformed data vector. It is defined as the sum of the transform coefficients weighted by their corresponding singular valuesσi. These positive singular values, arranged in descending order, are used to assign more or less importance to the different elements of the vectorθ.
T2= r X i=1 θ2 i σi (10) The above equation can be expressed in a more compact form as:
T2=yTbUbD −1
b
UTy (11)
wherebDis ther×rdiagonal matrix containing therlargest
singular values ofHarranged in decreasing order.
4) TRANSFORM COEFFICIENTS OR SCORESbθ
As discussed earlier, the data vectoryis presented in the new coordinatesuiby the transform coefficients or scoresθi. The transform coefficients corresponding to theklargest singular values are selected as features:
bθ=bUy, (12)
The columns ofUbare{u1,u2, . . . ,uk}.
C. CHANNEL SELECTION
Channel selection, addresses the problem of finding the most informative subset of channels to be used in classification. Here, we propose a wrapper type method closely related to the sequential forward selection (SFS) algorithm used in feature selection literature [20]. This method proceeds as follow:
1. Extract features from all 60 EEG monopolar channels and high accuracy bipolar channels. Due to the large number of bipolar channels (60×59/2 = 1770), we used only bipolar channels with accuracy greater than 40 % (acc>40 %) based on the results reported in [7]. In fact, provided that the classes are equally distributed as in the case of Data Set IIIa, the theoretical baseline accuracy for a four class taxonomy is 25 %. However, the actual confidence limits depend on the number of trials per class. Based on the simulation results reported in [33], the approximate 99% upper confidence limits are 31.3 % for subject K3b (80 trials per class) and 34.4 % for the other two subjects (60 trials per class). The selected threshold was chosen to be 15 % more than the baseline threshold and at least 6 % more than the actual upper limits.
2. Run the classifier with the combination of the three central channels, C3, Cz andC4, associated with the primary motor cortex, as initial guess.
3. At each iteration, select from the remaining channels the one that yields a maximal increase of the perfor-mance (accuracy).
4. RemoveC3,CzandC4from the selected channels and repeat step (3) to test these three channels.
D. CLASSIFICATION AND VALIDATION
The classifier used in this study is a logistic model tree implemented as part of the Weka software package [32]. The classifier, that uses SimpleLogistic, has a merit over other classifiers due to its use of LogitBoost. LogitBoost, with simple regression functions as base learners, is used to fit the logistic models. The stage-wise model fitting approach used in SimpleLogistic means that a potentially large number of LogitBoost iterations have to be performed; as it might be necessary to fit a simple linear function to the same variable many times. In each step, the algorithm identifies the variable that is most correlated with the current residual. Thereafter, it computes the simple linear regression coefficient of the residual on this chosen variable, and then adds it to the current coefficient for that variable. The optimum number of
iterations to be performed is selected by using five-fold cross-validation.
To evaluate the classification results, we used 10 fold cross-validations where the data is randomly split into 10 folds of equal size. At each iteration, one fold is used for testing and the other 9 folds are used to train the classifier. The test results are collected and averaged over all folds to obtain the cross-validation estimate of the accuracy. Therefore, the presented accuracy is the average accuracy of 10 times of distinct evaluation on each dataset. All our results presented in the subsequent sections were obtained through this cross validation procedure.
III. EXPERIMENTAL RESULTS AND DISCUSSION
This section is divided into three parts. The first part is devoted to the AR model order selection. The second part, evaluates the performance of the LP-SVD based feature extraction method against two related feature extraction methods. The last part, incorporates a channel selection approach, expands the extracted features and benchmarks the proposed approach against a number of state-of-the-art classification approaches previously applied to BCI IIIa com-petition dataset.
A. PART I: AR MODEL SELECTION
To investigate the appropriate AR model order and the num-ber of transform coefficients to be retained as features, we performed a series of simulations. In this part, only the parameters characterizing the LP-SVD transform are used as features, namely, a subset of transform coefficients (bθ), the
LP coefficients (ai) and the prediction error variance (Vr). The features were extracted from the electrode sites over the primary motor area C3, CZ, and C4. These are widely considered to be the most informative channels [7], [20].
We varied the AR model order from one to seven using
the EEG segments from t = 3.5 sec to t = 5.5 sec
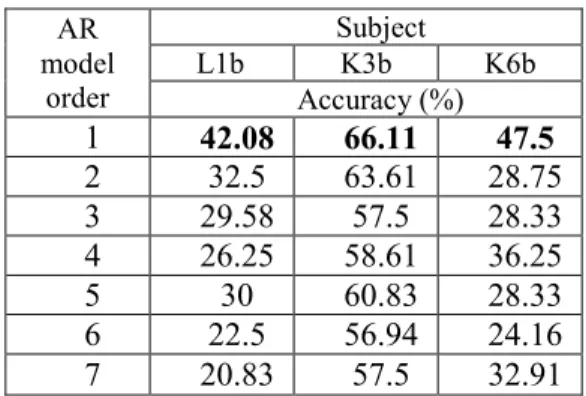
(501 samples) from each trial. The best model order was selected based on the resulting classification accuracy. This criterion is more suitable, in the present context, than the com-monly used one in signal representation (modeling), namely the tradeoff between the model order and the prediction error variance. Table 1 shows the classification results as function of the order of the AR model.
For all subjects, the highest classification accuracy, on average, was obtained with first order AR model and using a subset of four transform coefficients with results ranging from 42.08% for subject l1b to 66.11% for subject K3b. Therefore, this model order and number of transform coef-ficients will be used in subsequent analysis.
In the particular case of first order model, the basis function becomes sinusoidal; that is [25]:
ujk =Asin(jφk),
fork=1, . . . ,N and j=1, . . . ,N. (13) The parameterAis chosen so that the norm ofuk is unity andN is the lenght of the EEG segment.φk,k =1, . . . ,N,
TABLE 1.AR model order selection.
TABLE 2.Performance (classification accuracy) of DCT-based feature extraction using 60 Monopolar Channels.
TABLE 3.Classification performances using 60 monopolar channels.
are the positive roots of the equation: a sinNφ−sin(N+1) φ=0, andais the linear prediction coefficient.
B. PART II: FEATURE EXTRACTION EVALUATION
In this part, we compare the performance of the feature extraction method to those using similar state-of-the-art approaches, which is based on signal modeling and orthog-onal transform. These techniques are based on adaptive autoregressive (AAR) model [7] and discrete cosine trans-form (DCT) [30], [31]. In particular, Schlögl et al. [7] applied a third order adaptive autoregressive (AAR) model for EEG signal analysis. The extracted AAR coefficients,
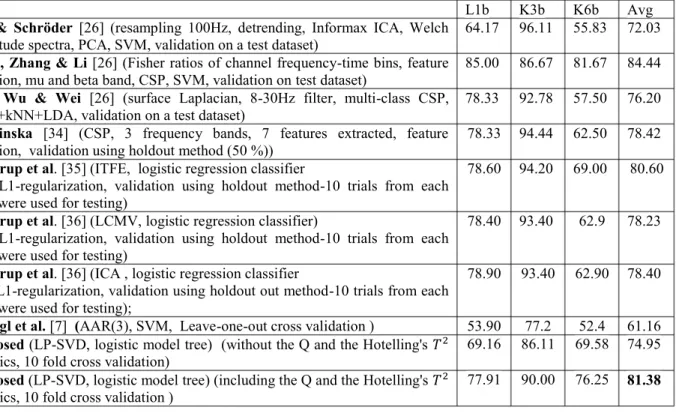
TABLE 4. BCI classification performance comparison of the proposed algorithm against state-of-the-art methods.
which provide dynamic information about the signal spectrum, served as features. The authors used three differ-ent classifiers namely, neural network based on k-nearest neighbour (kNN), support vector machines (SVM), and linear discriminant analysis (LDA) to classify the EEG signal into one of the four classes described earlier. The results showed that the SVM-based classifier achieved highest accuracies followed by LDA and then kNN. The authors also reported that the best results were obtained when using the features extracted from all 60 monopolar channels. In this evaluation, we used the same channels (60 monopolar channels) to pro-vide a fair comparison between the methods.
DCT is a signal independent real, orthogonal transform that is asymptotically equivalent to the optimal PCA for highly correlated first-order stationary autoregressive signals. To find the adequate number of DCT coefficients, that achieve the highest classification performance for the different sub-jects, we varied the number of retained low frequency DCT coefficients from 5 to 50 with a step size of 5. Table 2 summarizes the obtained classification results as a function of the number of retained DCT coefficients. The number of coefficients required, for subjects K6b, L1b and K3b, to achieve the highest classification accuracies were 15, 40, and 20, respectively.
The performances of the different aforementioned feature extraction approaches are summarized in Table 3. In partic-ular, it can be seen that when only the transform coefficients were used as features, the proposed approach outperformed the DCT-based one by up to 23 % in terms of accuracy
(for subject L1b) with 10 times fewer number of features. Meanwhile, when the LP coefficient and the residual error variance were added to the LP-SVD transform coefficients, our technique performed better than the two methods for subjects L1b and K6b and achieved comparable results to the AAR-based method for subject K3b. On average, the improvement, in terms of accuracy was about+25%
com-pared to DCT and+6 % compared to AAR-based methods.
It is pertinent to point out that, unlike DCT which results only in the transform coefficients as features, our method results in other features, LPC coefficients and residual signal variance that led to a better characterization of the signal. In addition, the DCT is signal independent while our proposed transform is signal dependent. These two facts explain the difference in performance between the two methods.
C. PART III: CLASSIFICATION PERFORMANCE
In this part, we incorporated a channel selection procedure as part of our classification algorithm and extended our fea-ture vector by including the Q-statistic and the Hotelling’s T2 statistic. Table 4 summarizes the classification results obtained using the proposed algorithm along with those using the first three BCI IIIa competition winners [26] as well as recently proposed methods by Koprinska [34], Grosse-Wentrup and Buss [35], Grosse-Wentrup [36], and Schlögl et al. [7]. It is worth highlighting that in all reported studies, subject K3b yielded the highest accuracies while subject K6b produces the worst results. This pattern might be attributed to the subjects experience differences with the
use of BCI systems as suggested in [36]. This might also be due to the fact that more trials are collected from this subject compared to the other two subjects. In addition, it is noted that the most frequent algorithm used for channel/feature selec-tion in these studies was the common spatial patterns (CSP) algorithm, and two of these were BCI competition winners. CSP transforms the original signal into a new space where the variance of one of the classes is maximized while the variance of the others is minimized. Koprinska applied CSP method, extended to multiclass problems, to extract seven features from 3 frequency bands. The extracted features were then used to compare five state-of-the-art motor imaginary move-ments based BCI methods [34]. The results show that dif-ferent feature selections work best with difdif-ferent classifiers. However, overall, the best feature selection method was the Correlation-Based Feature Selection (CFS) while the best classifier was SVM. The extension of the CSP algorithm, initially developed for two-class paradigms, to multiclass tax-onomy was usually performed based on heuristics. Wentrup et al addressed this problem in the framework of information theoretic feature extraction (ITFE) [35]. The same author presented an approach for improving the SNR of ICA in EEG analysis based on linearly constrained minimum vari-ance (LCMV) spatial filtering. CSP-based methods achieved different performances ranging from 72 % to 84 %. This variation in performance may be due to the fact that different authors used different preprocessing and classifiers.
The incorporation of two extra features, Q and the Hotelling’sT2statistics of the transformed EEG, and channel selection procedure in our approach subsequently improved the performances of the basic technique and reduced the number of selected channels to 20, 26 and 14 for subjects L1b, k3b and k6b, respectively. Overall, the proposed method ranked second best among all considered methods with an average accuracy of 81.38 % and achieved better than the competition winner for subject K3B.
We could, as was done by the competition winners, have applied advanced channel and feature selection, filtering, and parameter tuning to further enhance the performance of our algorithm. This was, however, not the main aim of this study. We chose a rather simple classification procedure to emphasize the importance of the proposed features. Future works on classification will include such additions.
IV. CONCLUSION
In this study, we presented a feature extraction approach based on the combination of autoregressive modeling and orthogonal transformation. Results of classification experiments, using a benchmark dataset from the BCI competition III, and comparison against closely related approaches, DCT and AAR, demonstrates that the presented features are compact and offers a significant improvement. Along with feature extraction, we were also interested in channel selection. In particular, we incorporated a simple procedure for channel selection which allows further improvement of the performances. The number of transform
coefficients was kept constant during all the experiments. It would be interesting to address the issue of parameters tuning in a future study.
REFERENCES
[1] F. Lotte, M. Congedo, A. Lécuyer, F. Lamarche, and B. Arnaldi, ‘‘A review of classification algorithms for EEG-based brain–computer interfaces,’’ J. Neural Eng., vol. 4, no. 2, pp. R1–R13, 2007.
[2] T. O. Zander, C. Kothe, S. Jatzev, and M. Gaertner, ‘‘Enhancing human-computer interaction with input from active and passive brain-human-computer interfaces,’’ inBrain-Computer Interfaces, D. S. Tan and A. Nijholt, Eds. London, U.K.: Springer-Verlag, 2010.
[3] J. F. D. Saa and M. Çetin, ‘‘Discriminative methods for classification of asynchronous imaginary motor tasks from EEG data,’’IEEE Trans. Neural Syst. Rehabil. Eng., vol. 21, no. 5, pp. 716–724, Sep. 2013.
[4] B. Hjorth, ‘‘EEG analysis based on time domain properties,’’ Electroencephalogr. Clin. Neurophysiol., vol. 29, pp. 306–310, Sep. 1970. [5] C. Vidaurre, N. Krämer, B. Blankertz, and A. Schlögl, ‘‘Time domain parameters as a feature for eeg-based brain–computer interfaces,’’Neural Netw., vol. 22, no. 9, pp. 1313–1319, 2009.
[6] D. J. Krusienski, D. J. McFarland, and J. R. Wolpaw, ‘‘An evaluation of autoregressive spectral estimation model order for brain-computer inter-face applications,’’ inProc. 28th Annu. Int. Conf. IEEE Eng. Med. Biol. Soc., vol. 1. Aug./Sep. 2006, pp. 1323–1326.
[7] A. Schlögl, F. Lee, H. Bischof, and G. Pfurtscheller, ‘‘Characterization of four-class motor imagery EEG data for the BCI-competition 2005,’’ J. Neural Eng., vol. 2, no. 4, pp. L14–L22, 2005.
[8] C. W. Anderson, E. A. Stolz, and S. Shamsunder, ‘‘Multivariate autore-gressive models for classification of spontaneous electroencephalographic signals during mental tasks,’’IEEE Trans. Biomed. Eng., vol. 45, no. 3, pp. 277–286, Mar. 1998.
[9] B. Graimann, J. E. Huggins, A. Schlögl, S. P. Levine, and G. Pfurtscheller, ‘‘Detection of movement-related patterns in ongoing single-channel elec-trocorticogram,’’IEEE Trans. Neural Syst. Rehabil. Eng., vol. 11, no. 3, pp. 276–281, Sep. 2003.
[10] A. Subasi and M. I. Gursoy, ‘‘EEG signal classification using PCA, ICA, LDA and support vector machines,’’Expert Syst. Appl., vol. 37, no. 12, pp. 8659–8666, 2010.
[11] L. Gupta, S. Kota, S. Murali, D. L. Molfese, and R. Vaidyanathan, ‘‘A feature ranking strategy to facilitate multivariate signal classification,’’ IEEE Trans. Syst., Man, Cybern. C, Appl. Rev., vol. 40, no. 1, pp. 98–108, Jan. 2010.
[12] C. Brunner, M. Naeem, R. Leeb, B. Graimann, and G. Pfurtscheller, ‘‘Spatial filtering and selection of optimized components in four class motor imagery EEG data using independent components analysis,’’Pattern Recognit. Lett., vol. 28, no. 8, pp. 957–964, 2007.
[13] L. Qin and B. He, ‘‘A wavelet-based time-frequency analysis approach for classification of motor imagery for brain-computer interface applications,’’ J. Neural Eng., vol. 2, no. 4, pp. 65–72, 2005.
[14] D. Birvinskas, V. Jusas, I. Martisius, and R. Damasevicius, ‘‘EEG dataset reduction and feature extraction using discrete cosine transform,’’ inProc. 6th IEEE UKSim/AMSS Eur. Symp. Comput. Modeling Simulation (EMS), Nov. 2012, pp. 199–204.
[15] M. Z. Parvez and M. Paul, ‘‘Epileptic seizure detection by analyzing EEG signals using different transformation techniques,’’Neurocomputing, vol. 145, pp. 190–200, Dec. 2014.
[16] R. Yang, A. Song, and B. Xu, ‘‘Feature extraction of motor imagery EEG based on wavelet transform and higher-order statistics,’’Int. J. Wavelets Multiresolution Inf. Process., vol. 8, no. 3, pp. 373–384, 2010.
[17] D. Zhang, Y. Wang, X. Gao, B. Hong, and S. Gao, ‘‘An algorithm for idle state detection in motor imagery based brain–computer interface,’’ Comput. Intell. Neurosci., pp. ID-39714, 2007.
[18] B. D. Mensh, J. Werfel, and H. S. Seung, ‘‘BCI competition 2003—Data set IA: Combining gamma-band power with slow cortical potentials to improve single-trial classification of electroencephalographic signals,’’ IEEE Trans. Biomed. Eng., vol. 51, no. 6, pp. 1052–1056, Jun. 2004.
[19] D. Coyle, G. Prasad, and T. M. McGinnity, ‘‘A time-frequency approach to feature extraction for a brain-computer interface with a comparative analysis of performance measures,’’EURASIP J. Appl. Signal Process., vol. 19, pp. 3141–3151, 2005.
[20] A. Bashashati, M. Fatourechi, R. K. Ward, and G. E. Birch, ‘‘A survey of signal processing algorithms in brain–computer interfaces based on electrical brain signals,’’J. Neural Eng., vol. 4, no. 2, p. R32, 2007. [21] U. Ozertem, D. Erdogmus, and R. Jenssen, ‘‘Spectral feature projections
that maximize Shannon mutual information with class labels,’’Pattern Recognit., vol. 39, no. 7, pp. 1241–1252, 2006.
[22] C. M. Bishop,Pattern Recognition and Machine Learning. New York, NY, USA: Springer-Verlag, 2006.
[23] A. Al-Ani and A. Al-Sukker, ‘‘Effect of feature and channel selection on EEG classification,’’ inProc. 28th Annu. Int. Conf. IEEE Eng. Med. Biol. Soc., Aug./Sep. 2006, pp. 2171–2174.
[24] B. Lou, B. Hong, X. Gao, and S. Gao, ‘‘Bipolar electrode selection for a motor imagery based brain–computer interface,’’J. Neural Eng., vol. 5, no. 3, pp. 342–349, Sep. 2008.
[25] H. Baali, R. Akmeliawati, M. J. E. Salami, A. Khorshidtalab, and E. Lim, ‘‘ECG parametric modeling based on signal dependent orthogonal trans-form,’’ IEEE Signal Process. Lett., vol. 21, no. 10, pp. 1293–1297, Oct. 2014.
[26] B. Blankertz et al., ‘‘The BCI competition. III: Validating alternative approaches to actual BCI problems,’’IEEE Trans. Neural Syst. Rehabil. Eng., vol. 14, no. 2, pp. 153–159, Jun. 2006.
[27] P. P. Vaidyanathan,The Theory of Linear Prediction. San Rafael, CA, USA: Morgan & Claypool, 2007.
[28] G. Strang,Computational Science and Engineering. Wellesley, MA, USA: Wellesley Cambridge Press, 2007.
[29] A. Khawaja,Automatic ECG Analysis Using Principal Component Anal-ysis and Wavelet Transformation(Karlsruhe Transactions on Biomedical Engineering), vol. 3. Karlsruhe, Germany: Universitätsverlag Karlsruhe, 2006.
[30] N. Ahmed, P. J. Milne, and S. G. Harris, ‘‘Electrocardiographic data compression via orthogonal transforms,’’ IEEE Trans. Biomed. Eng., vol. BME-22, no. 6, pp. 484–487, Nov. 1975.
[31] P. C. Hansen, Discrete Inverse Problems: Insight and Algorithms. Philadelphia, PA, USA: SIAM, 2010.
[32] M. Hall, E. Frank, G. Holmes, B. Pfahringer, P. Reutemann, and I. H. Witten, ‘‘The WEKA data mining software: An update,’’ACM SIGKDD Explorations Newslett., vol. 11, no. 1, pp. 10–18, 2009. [33] G. Müller-Putz, R. Scherer, C. Brunner, R. Leeb, and G. Pfurtscheller,
‘‘Better than random: A closer look on BCI results,’’ Int. J. Bioelectromagn., vol. 10, no. 1, pp. 52–55, 2008.
[34] I. Koprinska, ‘‘Feature selection for brain-computer interfaces,’’ inNew Frontiers in Applied Data Mining, T. Theeramunkonget al., Eds. Berlin, Germany: Springer-Verlag, 2010.
[35] M. Grosse-Wentrup and M. Buss, ‘‘Multiclass common spatial patterns and information theoretic feature extraction,’’IEEE Trans. Biomed. Eng., vol. 55, no. 8, pp. 1991–2000, Aug. 2008.
[36] M. Grosse-Wentrup, ‘‘Feature extraction in non-invasive brain-computer interfaces,’’ Ph.D. dissertation, Faculty Elect. Comput. Eng., Tech. Univ. Munich, Munich, Germany, 2008.
HAMZA BAALIreceived the Ph.D. degree from the Intelligent Mechatronics Systems Research Unit, International Islamic University Malaysia. He is currently with the Department of Electronics, Malaysia Industry Transformation, Kuala Lumpur. His primary research interests include biomedical signal analysis, sparse representation, and machine learning.
AIDA KHORSHIDTALAB was born in Iran. She received the B.Eng. degree in computer engi-neering from IAU, South Tehran Branch, and the M.Sc. degree in mechatronics engineering from the International Islamic University Malaysia, Malaysia, in 2012, where she is currently pur-suing the Ph.D. degree. For her master’s thesis, she worked on EEG signal processing and brain-actuated assistive robot. Her research interests include biomedical signal processing, cybernetics and assistive, and rehabilitation robotics.
MOSTEFA MESBAHreceived the Ph.D. degree in electrical and computer engineering from the University of Colorado at Boulder, Colorado, USA, in 1993. He joined Sultan Qaboos Univer-sity (SQU), Oman, in 2014. He was a Lecturer with the University of Colorado at Boulder and the Queensland University of Technology, Australia, and a Research and Senior Research Fellow with the University of Queensland, Australia, and the University of Western Australia, Australia. He is currently an Associate Professor with the Department of Electrical and Computer Engineering, SQU, and an Adjunct Senior Research Fellow with the School of Computer Science and Software Engineering, University of Western Australia, Australia. He has authored in the area of signal processing and its applications (more than 120 publications in international journals and conferences) and supervised more than ten Ph.D. students. He was a Lead Guest Editor of theEURASIP Journal on Advances in Non-Stationary Electrophysiological Signal Analysisof the Special Issue on Processing in 2012. His recent research interests are in the areas of signal and image processing and their biomedical applications.
MOMOH J. E. SALAMI (S’82–M’85–SM’01) received the B.S.E.E. degree from the University of Ife, Ife, Nigeria, in 1977, and the Ph.D. degree in electrical engineering from the University of Calgary, Calgary, Canada, in 1985. He has been actively involved in teaching and research activi-ties at the university level in Nigeria (with the Uni-versity of Ilorin), Saudi Arabia (with King Saud University) and Malaysia since the completion of his graduate studies.
He joined the International Islamic University Malaysia in1996, where he is currently a Professor with the Department of Mechatronics, Faculty of Engineering. He has authored or co-authored over 100 publications in both local and international journals and conference proceedings and being one of the contributors in a recently published book entitledThe Mechatronics Handbookby Prof. Bishop. His research interests include digital signal and image processing, intelligent control system design and instrumentation.